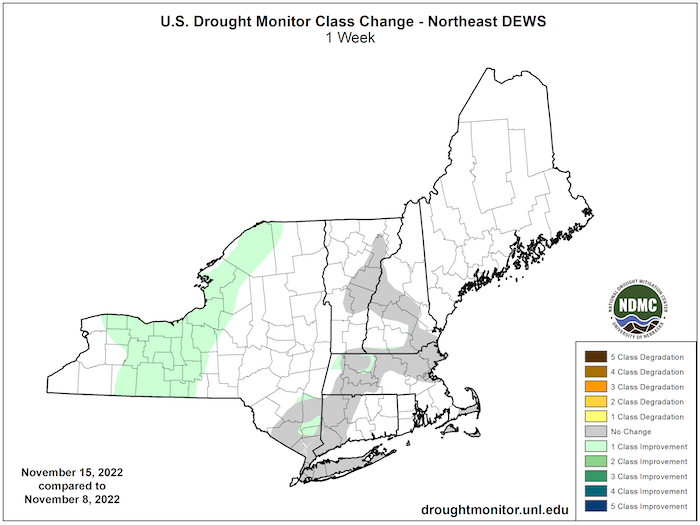
Despite rainfall from post-tropical storm Nicole, groundwater and long-term precipitation deficits persist in New England and southern New York.
For more details, see the Northeast Drought Early Warning System Dashboard.
Key Points
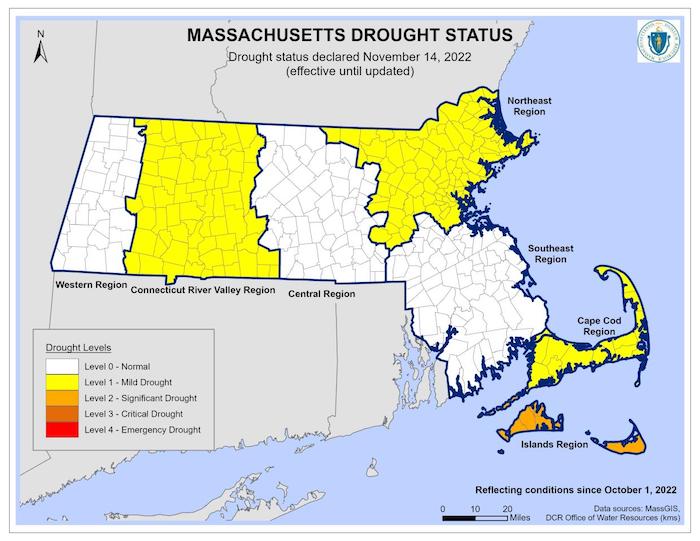
- Severe Drought (D2) remained for communities north of Boston.
- Moderate Drought (D1) was spotty through parts of Massachusetts, New Hampshire, southern New York, and Connecticut.
- Abnormally Dry (D0) conditions were cleared from upstate New York by rains from the remnants of Nicole.
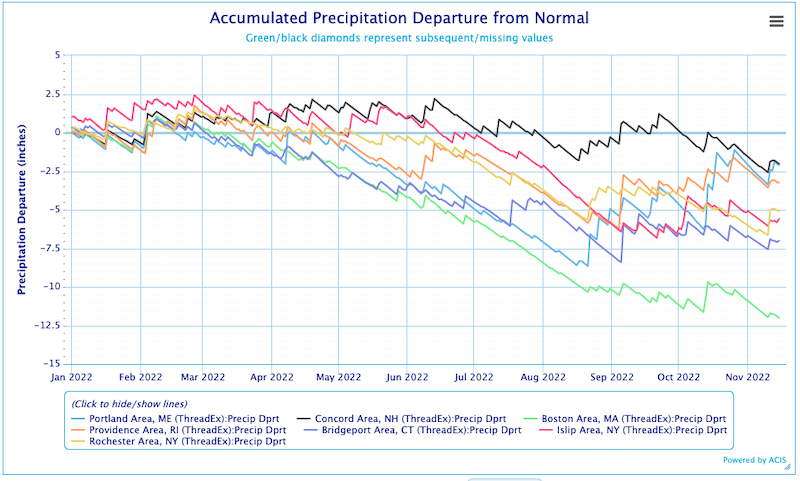
- Six and twelve-month precipitation departures are still quite significant in some parts of southern New England.
Current U.S. Drought Monitor map for the Northeast Drought Early Warning System with data valid for November 15, 2022. The U.S. Drought Monitor is updated each Thursday to show the location and intensity of drought across the country.
According to the latest U.S. Drought Monitor:
- Severe drought (D2) conditions exist in 0.35% of the region.
- Moderate drought (D1) conditions exist in 2.73% of the region.
- Abnormally dry (D0) conditions exist in 12.01% of the region.
U.S. Drought Monitor Categories
Current U.S. Drought Monitor map for the Northeast Drought Early Warning System with data valid for November 15, 2022. The U.S. Drought Monitor is updated each Thursday to show the location and intensity of drought across the country.
According to the latest U.S. Drought Monitor:
- Severe drought (D2) conditions exist in 0.35% of the region.
- Moderate drought (D1) conditions exist in 2.73% of the region.
- Abnormally dry (D0) conditions exist in 12.01% of the region.
Current Conditions
U.S. Drought Monitor 1-Week Change Map
Accumulated Precipitation Departure from Normal
State-Reported Drought Conditions and Impacts
Connecticut
- Connecticut Drought Information Center
- Drought Impacts:
- November 11, 2022: Shelton Herald – Upgraded Water Treatment Plant Could Improve Water Sourcing During Drought
|
County |
Rainfall (in.) |
Departure (in.) |
Percent (%) |
Normal (in.) |
|
Litchfield |
23.15 |
-4.05 |
85% |
27.20 |
|
Hartford |
22.35 |
-4.85 |
82% |
27.20 |
|
Tolland |
23.72 |
-1.59 |
94% |
25.31 |
|
Windham |
23.40 |
-2.07 |
92% |
25.47 |
|
Fairfield |
21.70 |
-4.82 |
82% |
26.52 |
|
New Haven |
23.25 |
-1.96 |
92% |
25.21 |
|
Middlesex |
25.28 |
-1.69 |
94% |
26.97 |
|
New London |
21.49 |
-3.29 |
87% |
24.78 |
|
County |
Rainfall (in.) |
Departure (in.) |
Percent (%) |
Normal (in.) |
|---|---|---|---|---|
|
Litchfield |
44.89 |
-5.81 |
89% |
50.70 |
|
Hartford |
42.46 |
-8.46 |
83% |
50.92 |
|
Tolland |
44.46 |
-5.65 |
89% |
50.11 |
|
Windham |
45.03 |
-5.19 |
90% |
50.23 |
|
Fairfield |
39.75 |
-10.63 |
79% |
50.38 |
|
New Haven |
42.55 |
-6.15 |
87% |
48.70 |
|
Middlesex |
45.77 |
-5.72 |
89% |
51.49 |
|
New London |
41.20 |
-8.93 |
82% |
50.13 |
Connecticut preliminary precipitation data (inches) by county through October 2022 (includes CoCoRaHS data) for the past 6 months (top) and 12 months (bottom). Source: National Weather Service: Boston/Norton, MA, Albany, NY, and Upton, NY.
Maine
Massachusetts
- Massachusetts Drought Management Task Force
- Drought Impacts:
- November 10, 2022: The Boston Globe – Removing Historic Dam: Let the River Run
- November 9, 2022: MVTimes – Bees Impacted By Drought
- November 10, 2022: The Salem News – Drought and Water Bans Linger
- November 6, 2022: Greenfield Recorder – Effects of the Summer Drought
New Hampshire
- New Hampshire Department of Environmental Services: Drought
- Drought Impacts:
- November 10, 2022 The Eagle Times - Climate Change/Drought: Recreation and Tourism
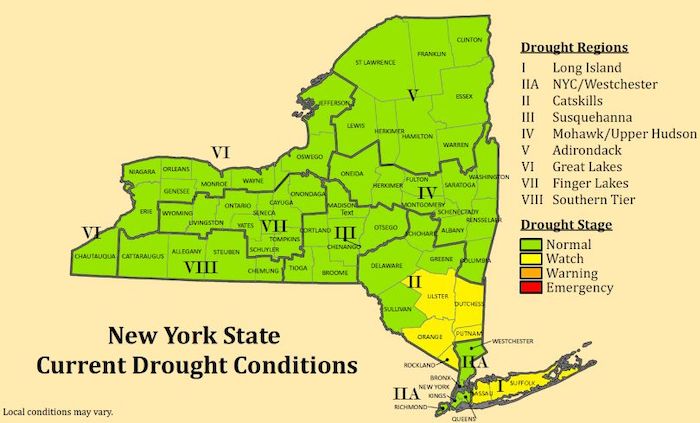
New York
- New York State Department of Environmental Conservation (DEC): Drought
- Drought Impacts:
- November 15, 2022: DEC Week in Review – Prescribed Fire Burns and Wildland Fires Controlled In 8 Counties
- November 9, 2022: Tompkins Weekly – Drought Affecting Local Orchards
- November 9, 2022: City of Kingston, NY – Drought Emergency Lifted
- November 5, 2022: DEC Week in Review – Wildland Fires in 8 Counties
Rhode Island
- Rhode Island Water Resources Board: Drought Management Program
|
Rhode Island Drought Region |
Rainfall (in.) |
Departure (in.) |
Percent (%) |
Normal (in.) |
|---|---|---|---|---|
|
Northwest |
25.56 |
-0.21 |
99% |
25.77 |
|
Northeast |
24.60 |
-0.16 |
99% |
24.76 |
|
Central West |
22.37 |
-2.44 |
90% |
24.81 |
|
Central East |
22.87 |
-0.73 |
97% |
23.60 |
|
Eastern |
19.78 |
-2.45 |
89% |
22.23 |
|
Southern |
21.41 |
-2.10 |
91% |
23.51 |
|
New Shoreham |
19.40 |
-3.90 |
83% |
23.30 |
|
Rhode Island Drought Region |
Rainfall (in.) |
Departure (in.) |
Percent (%) |
Normal (in.) |
|---|---|---|---|---|
|
Northwest |
48.98 |
-4.80 |
91% |
53.78 |
|
Northeast |
46.76 |
-4.90 |
91% |
51.66 |
|
Central West |
44.71 |
-6.06 |
88% |
50.77 |
|
Central East |
43.67 |
-6.64 |
87% |
50.31 |
|
Eastern |
38.90 |
-8.73 |
82% |
47.63 |
|
Southern |
42.79 |
-7.14 |
86% |
49.93 |
|
New Shoreham |
37.79 |
-10.61 |
78% |
48.40 |
Rhode Island preliminary precipitation data (inches) by drought region through October 2022 (includes CoCoRaHS data) for the past 6 months (top) and 12 months (bottom). Source: Boston/Norton, MA Weather Forecast Office, National Weather Service.
Vermont
Outlooks
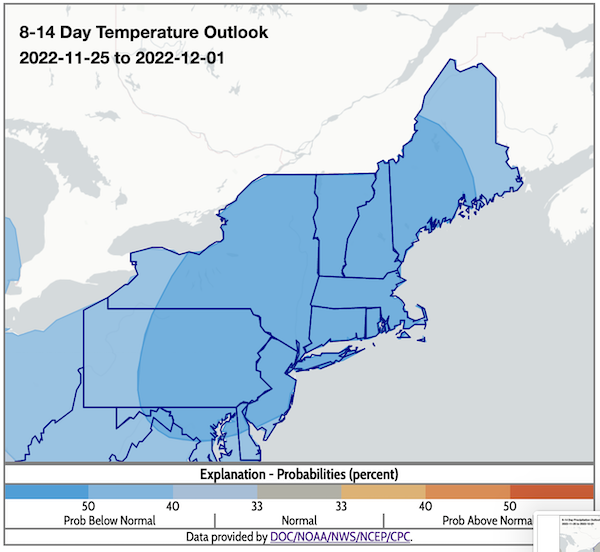
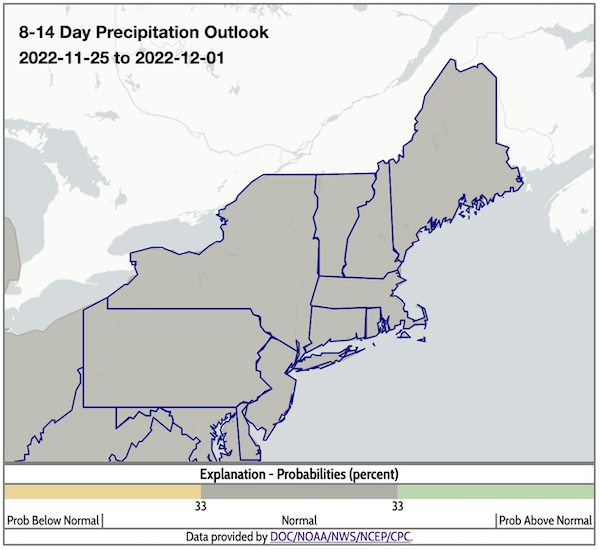
- According to the Climate Prediction Center's 8–14 day outlook (valid November 25–December 1, 2022), odds favor below-normal temperatures and near-normal precipitation throughout the Northeast.
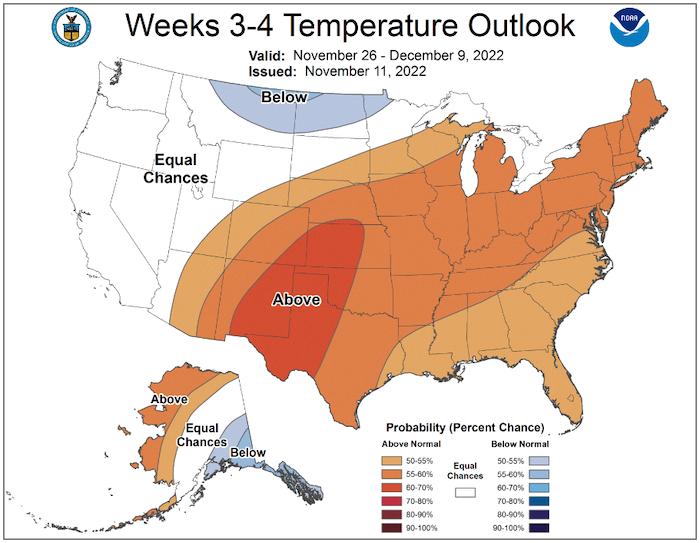
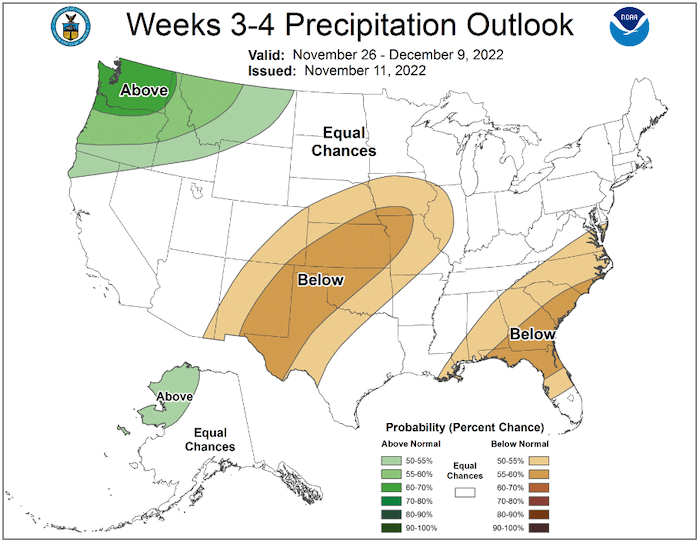
- The week 3–4 outlook (valid November 26–December 9, 2022) favors above-normal temperatures and equal chances of above- and below-normal precipitation across the entire Northeast.
8–14 Day Temperature Outlook
8–14 Day Precipitation Outlook
Temperature Outlook Week 3–4
Precipitation Outlook Week 3–4
What We Are Watching
Urban Heat Mapping Campaigns
NOAA announced the application window for the Urban Heat Mapping Initiative.
Watch for a link in the next Drought Status Update to a recording of the Urban Heat Mapping results from 2022 campaign cities.
Featured Resources
- Flash Drought Tools: Advantages and Disadvantages by Indicator Type
- Flash Drought Prediction and Monitoring Tools
- Experimental Rapid Onset Drought Product in the National Weather Service's Week-2 U.S. Hazards Outlook
- Learn more about this product
- Watch the November 8 stakeholder feedback webinar
- New: Northeast DEWS Dashboard Groundwater Status Map
- This map is located under the "USGS Streamflow and Groundwater" section of the Dashboard. Access the percentile classes by clicking on the "USGS" tile below the groundwater map.
- This map is based on observations retrieved from the U.S. Geological Survey (USGS) Instantaneous Values Web Service. Data include approved, quality-assured data, as well as more recent provisional data, whose accuracy has not been verified by USGS. USGS data are provided to meet the need for timely best science and on the condition that neither the USGS nor the U.S. Government shall be held liable for any damages resulting from the authorized or unauthorized use of the data.
- Station percentile values used in this map were computed by the Northeast Regional Climate Center. They are based on the historical data occurring within a 31-day window centered on the date of interest and filtered down to just the measurement taken closest to the date of interest for each year. These percentile values, therefore, may differ from those available from other sources, where other methods of percentile computation may have been employed.
- New: USGS Water Cycle Diagram
- This tool is available in Spanish and English and as an educational resource with interactive versions for kids (beginner, intermediate, and advanced).
- Northeast DEWS Partners meeting resources list
Additional Resources
- Look back at previous Northeast DEWS Drought Status Updates
- Your local National Weather Service office
- NOAA Regional Climate Services Monthly Webinar Series (next webinar is on November 29)
- USDA Northeast Climate Hub
- USGS New England and New York Water Science Centers
Contacts for More Information
Sylvia Reeves
Regional Drought Information Coordinator (Northeast DEWS)
NOAA/CIRES/National Integrated Drought Information System (NIDIS)
Email: sylvia.reeves@noaa.gov
Ellen L. Mecray
Regional Climate Services Director, Eastern Region
NOAA/NESDIS/National Centers for Environmental Information
Email: Ellen.L.Mecray@noaa.gov
Prepared By
Sylvia Reeves
NOAA/National Integrated Drought Information System (NIDIS), CIRES
Samantha Borisoff, Jessica Spaccio, Keith Eggleston, Art DeGaetano
Northeast Regional Climate Center
Ellen Mecray
Regional Climate Services Director, Eastern Region, NOAA
David Hollinger
USDA Climate Hubs
Gardner Bent
USGS New England Water Science Center
In partnership with National Weather Service Offices of the Northeast and State Climate Offices of the Northeast.
This drought status update is issued in partnership between the National Oceanic and Atmospheric Administration (NOAA), U.S. Geological Survey, and the U.S. Department of Agriculture (USDA) to communicate concern for drought expansion and intensification within the Northeast U.S. based on recent conditions and the forecasts and outlooks. NIDIS and its partners will issue future drought status updates as conditions evolve.