Amid Insufficient Precipitation, Drought and Dryness Expanded in Western New York.
Key Points:
- Abnormal Dryness (D0) and drought (D1–D2) expanded slightly in western New York, where streamflow and groundwater levels have been below normal.
- As of November 14, 2023, 5.6% of New York state is in drought (D1–D2), impacting an estimated 827,478 people. This is a 2.6% increase in drought coverage from October 31.
- Abnormally Dry (D0) conditions were also introduced on Cape Cod and the Islands based on below-normal precipitation and sluggish recovery of groundwater levels.
- The Climate Prediction Center’s outlook for November 25–December 8 favors above-normal temperatures and equal chances of above- or below-normal precipitation. Despite the prospect of precipitation in the next seven days, little improvement is expected for New York.
Current U.S. Drought Monitor map for the Northeast Drought Early Warning System (DEWS) with data valid for November 14, 2023. The U.S. Drought Monitor is updated each Thursday to show the location and intensity of drought across the country.
According to the latest U.S. Drought Monitor:
- 9.5% of the Northeast DEWS is experiencing Abnormally Dry (D0) conditions
- 2.4% of the Northeast is in drought (D1–D2).
U.S. Drought Monitor Categories
Abnormally Dry (D0)
Abnormally Dry (D0) indicates a region that is going into or coming out of drought. View typical impacts by state.
Moderate Drought (D1)
Moderate Drought (D1) is the first of four drought categories (D1–D4), according to the U.S. Drought Monitor. View typical impacts by state.
Severe Drought (D2)
Severe Drought (D2) is the second of four drought categories (D1–D4), according to the U.S. Drought Monitor. View typical impacts by state.
Extreme Drought (D3)
Extreme Drought (D3) is the third of four drought categories (D1–D4), according to the U.S. Drought Monitor. View typical impacts by state.
Exceptional Drought (D4)
Exceptional Drought (D4) is the most intense drought category, according to the U.S. Drought Monitor. View typical impacts by state.
Current U.S. Drought Monitor map for the Northeast Drought Early Warning System (DEWS) with data valid for November 14, 2023. The U.S. Drought Monitor is updated each Thursday to show the location and intensity of drought across the country.
According to the latest U.S. Drought Monitor:
- 9.5% of the Northeast DEWS is experiencing Abnormally Dry (D0) conditions
- 2.4% of the Northeast is in drought (D1–D2).
The U.S. Drought Monitor is released weekly on Thursday mornings, with data valid through 7 a.m. ET the previous Tuesday.
Current Conditions
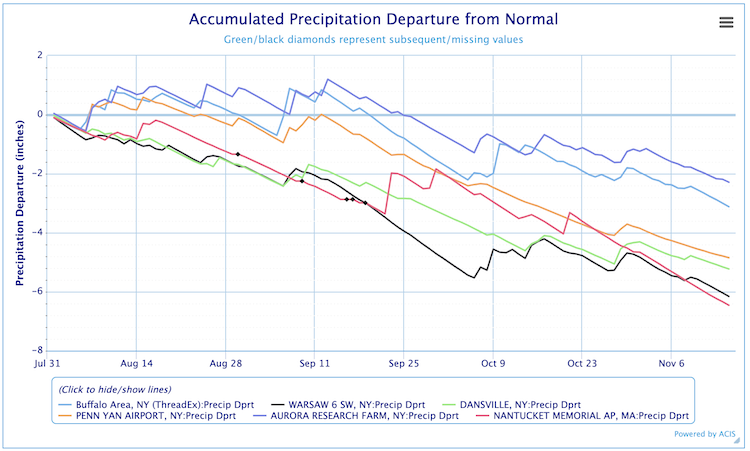
According to the latest USDA National Agricultural Statistics Service (NASS) Crop Progress & Conditions Report, all western New York reporting sites are closing out the growing season with 4-week precipitation deficits well over 1.5 inches. Maine, Massachusetts, and New Hampshire all have some stations with 4-week precipitation deficits over 2 inches.
Accumulated Precipitation Departure from Normal
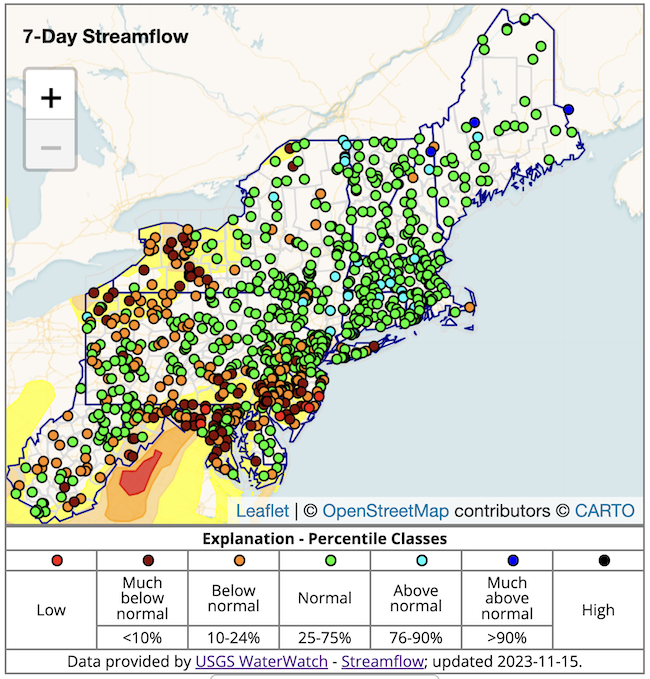
7-Day Streamflow Conditions: Northeast U.S.
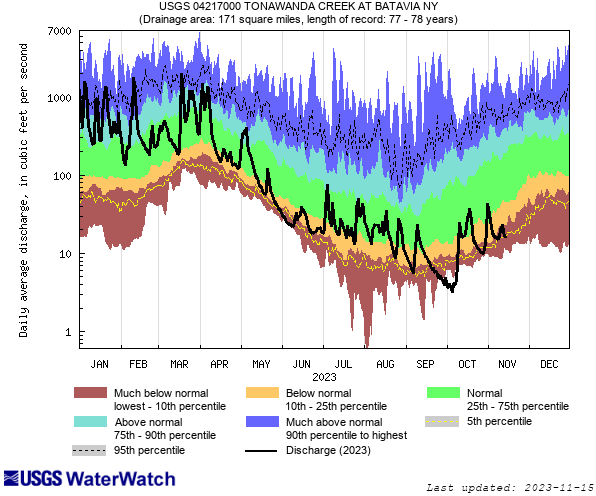
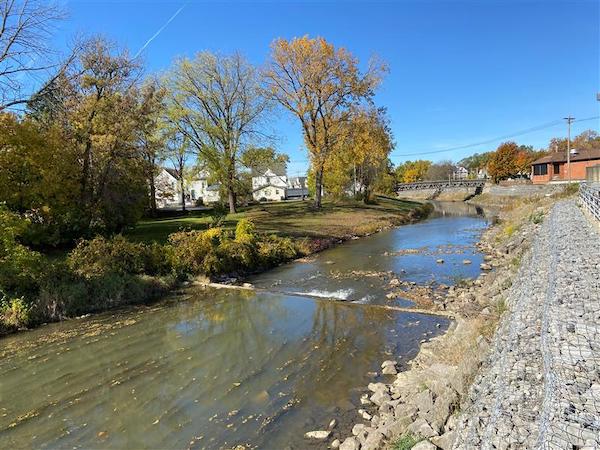
Streamflow Conditions: Tonawanda Creek, Batavia, New York
The hydrograph below shows streamflow conditions at a U.S. Geological Survey (USGS) site on Tonawanda Creek at Batavia in western New York, which is currently in Moderate Drought (D1). The period of record for this site is 78 years, and currently in mid-November streamflows are in the lowest 5th percentile for this period in history. As noted in the September 29 Northeast Drought Status Update, during a few days in late September the observed daily mean streamflow was the lowest for that day in history.
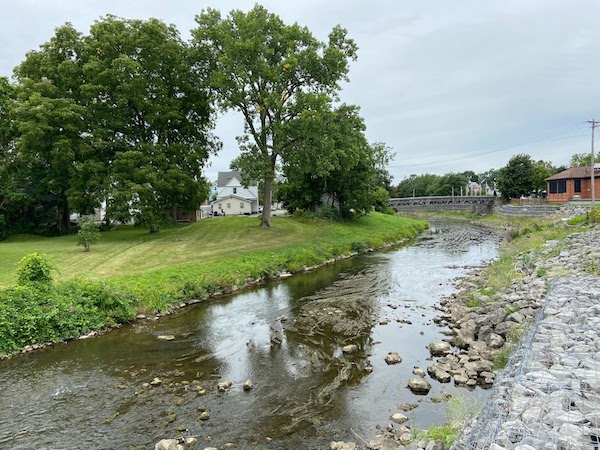
Tonawanda Creek: August 23 vs. October 23
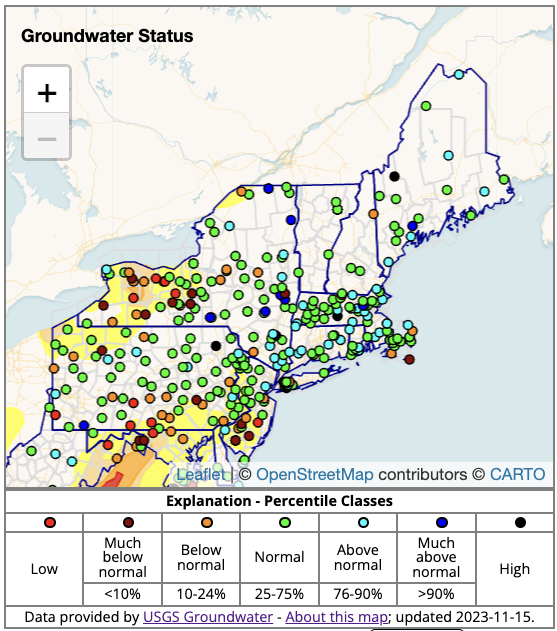
Groundwater Levels: Northeast U.S.
Groundwater levels are below-normal across much of western New York, where drought and dryness persist. At one U.S. Geological Survey well in Gainesville, New York, the groundwater level dropped to 13.91 feet below the land surface, as of November 15, 2023. This is the 2nd lowest on record for this date in the past 16 years.
A Condition Monitoring Observer Report from Wyoming, New York on November 2 indicated families were experiencing depleted wells and difficulty finding drilling companies that could get them into their schedules to dig new/deeper wells. The drilling companies were responding to numerous calls, and a waiting list was in place. Meanwhile, residents reported that their daily lives were impacted as they were forced to buy water for drinking and cooking, take fewer showers, and reduce clothes and dishwashing.
Outlooks
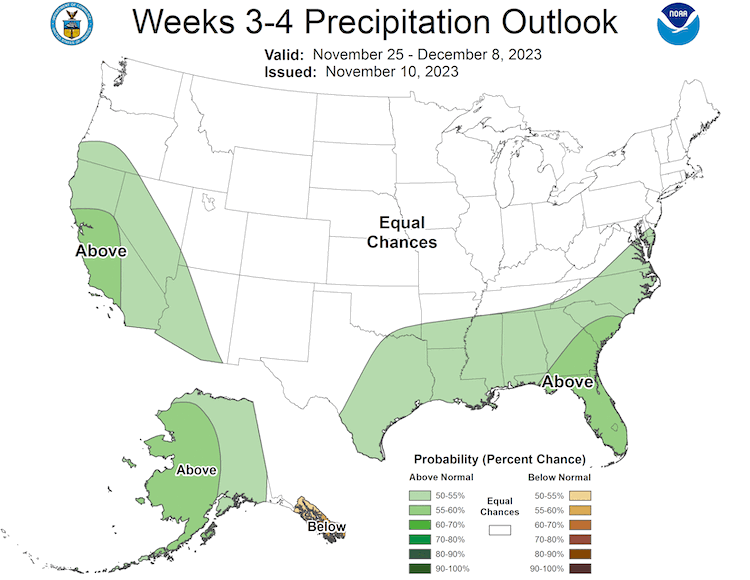
The 3–4 week temperature probabilities favor above-normal temperatures for the Northeast, with equal chances of above- or below-normal precipitation From November 25–December 8, 2023. As a result, little improvement is expected for all areas experiencing Abnormally Dry (D0) conditions and drought (D1–D2).
Week 3–4 Precipitation Outlook
Featured Resources
- The U.S. Global Climate Research Program (USGCRP) released the 5th National Climate Assessment (NCA5) on November 14, 2023. Read the White House fact sheet and the Regional Impacts document.
- Expanded Drought.gov Historical Conditions Tool: NOAA’s National Integrated Drought Information System (NIDIS) partnered with NOAA’s National Centers for Environmental Information (NCEI) to expand and improve the Drought.gov Historical Data & Conditions Tool, which allows users to visualize historical drought conditions by state and county.
- Dry Times: View the November 15 edition of NIDIS's bi-weekly drought newsletter.
- U.S. Drought Monitor Change Maps: Through USDA’s Office of the Chief Economist, the National Drought Mitigation Center added additional change map timescales for the USDM.
What We Are Watching
- Climate.gov: How does El Niño affect snowfall over North America?
- NOAA Research: Recent “Triple-Dip” La Niña upends current understanding of ENSO.
- Drought, Wildfires, and Water Supply Concerns:
- Cornell University expands smoke sensor network in New York
- November 9, 2023: Washington Post – Hundreds of Fires are Burning in the Appalachians
- November 9, 2023: Interstate Commission on the Potomac River Basin – Streamflow “Trend is Worrying”
Additional Resources
- Look back at previous Northeast DEWS Drought Status Updates.
- Northeast Drought Early Warning System Dashboard.
- Sign up for NIDIS emails on our email sign up form.
- Your local National Weather Service office.
- NOAA Regional Climate Services Monthly Webinar Series (next webinar is November 30).
- USDA Northeast Climate Hub.
- USGS New England and New York Water Science Centers.
- Explore drought information for your state:
- Connecticut Drought Information Center
- Maine Drought Task Force
- Massachusetts Drought Management Task Force
- New Hampshire Department of Environmental Services: Drought
- New York State Department of Environmental Conservation (DEC): Drought
- Rhode Island Water Resources Board: Drought Management Program
- Vermont Agency of Natural Resources, Department of Environmental Conservation: Drought and Other Hazards
Contacts for More Information
Sylvia Reeves
Regional Drought Information Coordinator (Northeast DEWS)
NOAA/CIRES/National Integrated Drought Information System (NIDIS)
Email: sylvia.reeves@noaa.gov
Ellen L. Mecray
Regional Climate Services Director, Eastern Region
NOAA/NESDIS/National Centers for Environmental Information
Email: Ellen.L.Mecray@noaa.gov
Prepared By
Sylvia Reeves
NOAA/National Integrated Drought Information System (NIDIS), CIRES
Samantha Borisoff, Jessica Spaccio, Keith Eggleston, Art DeGaetano
Northeast Regional Climate Center
Ellen Mecray
Regional Climate Services Director, Eastern Region, NOAA
Gardner Bent
USGS New England Water Science Center
In partnership with National Weather Service Offices of the Northeast and State Climate Offices of the Northeast.
This drought status update is issued in partnership between the National Oceanic and Atmospheric Administration (NOAA), U.S. Geological Survey, and the U.S. Department of Agriculture (USDA) to communicate concern for drought expansion and intensification within the Northeast U.S. based on recent conditions and the forecasts and outlooks. NIDIS and its partners will issue future drought status updates as conditions evolve.
