Snow Drought and Early Melt Will Impact Already Stressed Water Supplies
Register here for the April 25 PNW Drought and Climate Outlook Webinar.
Key Points
- As of the beginning of April, snowmelt has begun in much of the region. However, given the water deficits in soils, streamflows in areas of Oregon and Idaho where drought is most severe are not reflecting increased flow. In Oregon, several of the southern and eastern major basins have started melt-out 4–6 weeks early after reaching only 60% of the typical snow water equivalent (SWE) peak. In Idaho melt-out has begun about 2 weeks early.
- Temperatures during the last 3 months were well above normal in the Oregon and Washington Cascades and in most high-elevation regions of eastern Oregon (Figure 4). This is driving the rapid anomalous melt-out of the snowpack.
- Much of southern and eastern Oregon and portions of Idaho recorded their driest 3-month January–March on record while nearly all of the southern half of Oregon and Idaho were in their lowest 10th percentile.
- Major Oregon reservoirs, especially those in the southern and eastern parts of the state, reflect low refill rates this year compared with historical conditions, with many at lower levels than on the same date (April 1) in 2021 and well below median historical storage for this date.
- Recent water supply forecasts from the USDA Natural Resources Conservation Service indicate a strong possibility that the Snake River and Henry’s Fork may experience their lowest water supply in the last forty years. Similar years include 1988, 1992, and 2001–2004.
- Impacts to agriculture, including rangelands, forage, crops, and livestock, will continue into spring and summer.
- Given the long-term forecasts, a spring surge in precipitation that could ameliorate the current drought is unlikely. The most likely and hopeful scenario is that summer temperatures will be close to normal and not exacerbate the drought conditions. Seven counties in Oregon have received emergency drought declarations, and four more have submitted requests for declarations.
Current U.S. Drought Monitor map for the Pacific Northwest, as of April 5, 2022. The U.S. Drought Monitor (USDM) is updated each Thursday to show the location and intensity of drought across the country. Drought categories show experts’ assessments of conditions related to dryness and drought including observations of how much water is available in streams, lakes, and soils compared to usual for the same time of year
U.S. Drought Monitor Categories
Current U.S. Drought Monitor map for the Pacific Northwest, as of April 5, 2022. The U.S. Drought Monitor (USDM) is updated each Thursday to show the location and intensity of drought across the country. Drought categories show experts’ assessments of conditions related to dryness and drought including observations of how much water is available in streams, lakes, and soils compared to usual for the same time of year
Current Conditions
- 70.70% of the Pacific Northwest Drought Early Warning System (DEWS) region is in drought, with 23.34% experiencing extreme (D3) or exceptional (D4) drought conditions. While water availability in some areas of Washington and Idaho has improved over the winter months, D3 (extreme) and D4 (exceptional) drought conditions have persisted throughout central and eastern Oregon, with some expansion in southwestern Oregon.
- Current snow water equivalent (SWE) in basins across the region reflect the lack of winter precipitation in the areas where drought is most widespread or severe. Snow water equivalent in southern Oregon basins currently is 26%–34% of normal (1991-2020 median), and SWE is 56%–68% of normal in eastern Oregon, southeastern Washington, and southern Idaho. SWE in basins through northeastern Oregon, central Washington, and central Idaho is 71%–87% of normal. SWE is highest in Washington on the western slopes of the Cascades (greater than 90% of normal) (Figure 1). In Oregon, several of the southern and eastern major basins have started melt-out 4–6 weeks early after reaching only 60% of the typical SWE peak.
- Current (April 7, 2022) SWE is much lower relative to the same date in 2021, and peak SWE values are also lower than on the same date last year. For example, SWE in the Klamath Basin is at 36% of normal, whereas at this time last year it was at 81% of normal. Peak SWE in the Klamath Basin is also below that of last year.
- As of the beginning of April, snowmelt has begun in much of the region. However, given the water deficits in soils, streamflows in areas of Oregon and Idaho where drought is most severe are not reflecting increased flow. Instead, meltwater likely is being absorbed by soils or evaporating. The Observed Water Year Natural Runoff for the period of October 2021 to April 7, 2022 reflects lower than normal flows across southeastern and central Oregon and southern Idaho (Figure 2).
- Much of southern and eastern Oregon and portions of Idaho recorded their driest 3-month January–March on record while nearly all of the southern half of Oregon and Idaho were in their lowest 10th percentile (Figure 3).
- Temperatures during the last 3 months were well above normal in the Oregon and Washington Cascades and in most high-elevation regions of eastern Oregon (Figure 4). This is driving the rapid anomalous melt-out of the snowpack.
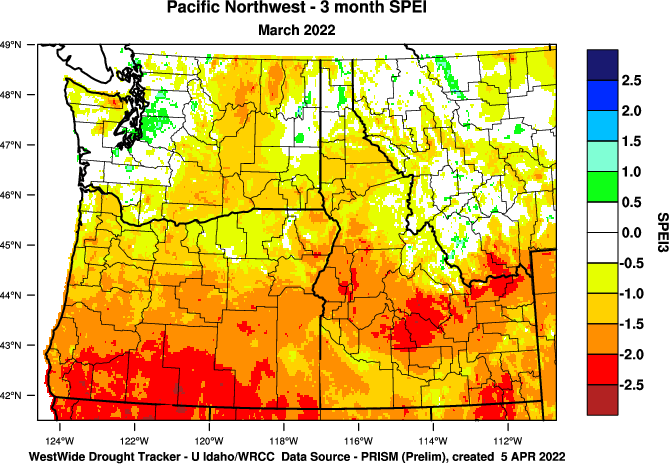
- The 3-month Standardized Precipitation Evapotranspiration Index (SPEI) for the region reflects the severity of drought across southern and central Oregon and Idaho (Figure 5).
Figure 1. Snow Water Equivalent (SWE) Percent of 1991–2020 Median
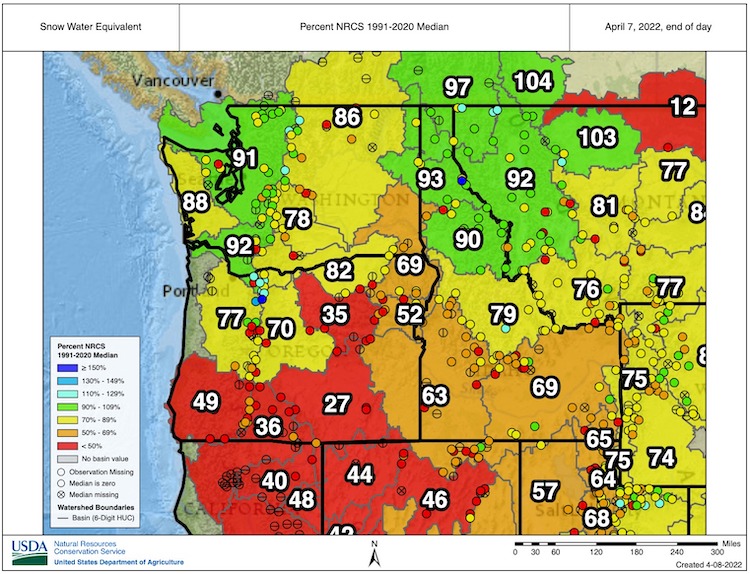
Figure 2. Observed Water Year Natural Runoff Percent of Normal
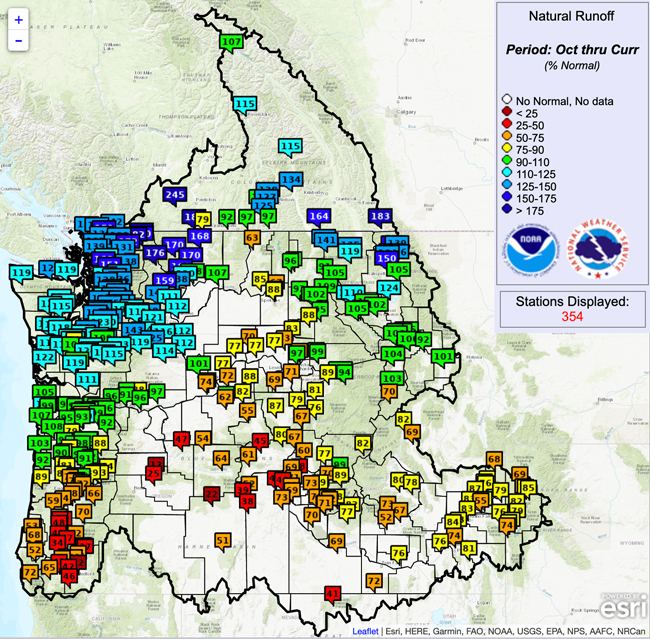
Figure 3. January–March Precipitation Percentile Rankings
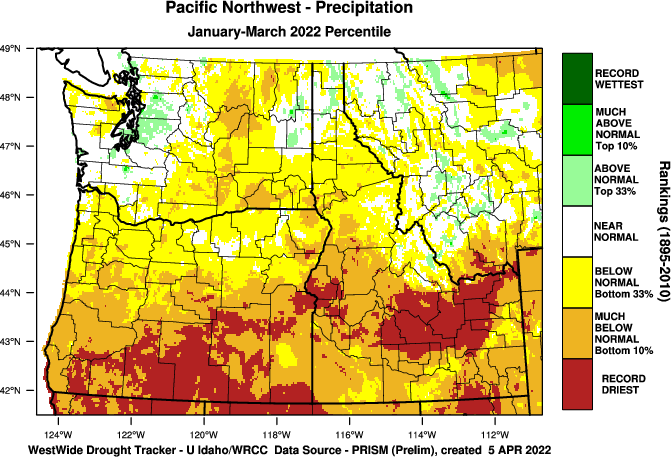
Figure 4. January–March Temperature Percentile Rankings
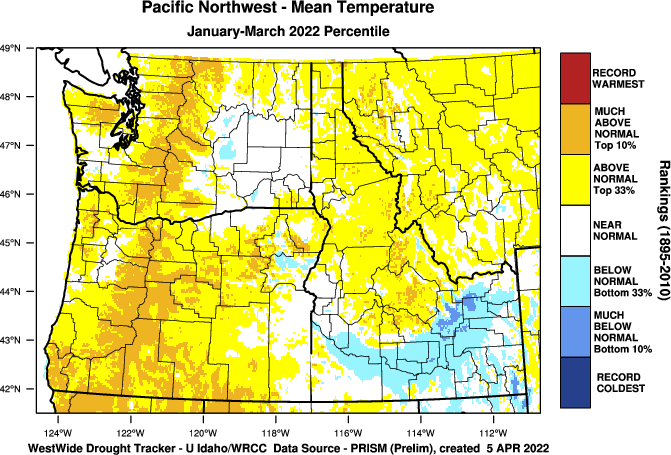
Figure 5. 3-Month Standardized Precipitation Evapotranspiration Index (SPEI)
Drought Impacts
- Seven counties in Oregon have received emergency drought declarations, and four more have submitted requests for declarations. Klamath County was the first to receive a declaration, on March 4, 2022, which was based on low snowpack, reservoir levels, and streamflow. In 2021, by contrast, drought in the county was declared almost a month later. Washington State will be evaluating the current drought emergency declaration (issued July 2021, set to expire on June 1, 2022) in early May.
- Major Oregon reservoirs, especially those in the southern and eastern parts of the state, reflect low refill rates this year compared with historical conditions, with many at lower levels than on the same date (April 1) in 2021 (Figure 6) and well below median historical storage for this date. Four reservoirs in central Oregon, Wickiup, Prineville, Crescent Lake, and Ochoco, are at record low levels for this date.
- Water storage levels in reservoirs in the Boise System in Idaho are relatively high as of April 7, 2022, but this is in part because irrigation has not started. Meltout and runoff in this area started about two weeks earlier in 2022 than 2021, which could put a strain on demand later this year (Figure 7). The Snake River System is looking at one of the lowest water supply years of the last four decades. Similar years include 1988, 1992, and 2001-2004 (Figure 8). There is currently concern that the storage rights in Jackson Lake, one of the oldest reservoirs in the system, may not fill.
- Impacts to agriculture, including rangelands, forage, crops, and livestock, will continue into spring and summer. Drought impacts submitted from Malheur County, Oregon, through the Condition Monitoring Observer Reports include dry soils resulting in blowing dust and loss of topsoil and plants that are not emerging from winter dormancy as they normally would in spring.
- There are a number of crops and livestock experiencing drought conditions, including winter wheat, barley, oats, spring wheat, hay, and alfalfa, as well as beef cattle, dairy cattle and sheep.
- Recent USDA National Agricultural Statistics Service (NASS) reports document observed impacts (ID, OR, WA, MT). These include low soil moisture affecting crops and areas used for livestock grazing. Several areas are reporting early concerns about limited irrigation water and plans to turn on water later than normal due to reduced flows.
- For the week ending April 3, winter wheat conditions were rated fair to very poor in 55% of Idaho, 68% of Oregon, 35% of Washington, and 90% of Montana.
- Seed growers in the region are reporting shortages of seed for key forage crops like oats and barley. Lack of seed, in combination with limited water in stock ponds and increased prices for feed, may result in greater culling of herds.
Condition Monitoring Observer Reports (CMOR): Given the ongoing drought, you may be seeing impacts that are the result of longer-term conditions. If you submit a report on impacts, use the current date and note in the accompanying text that the impacts may be the result of conditions that began earlier in the year, or even in the previous year or growing season.
Figure 6. Water Storage in Oregon's Major Reservoirs
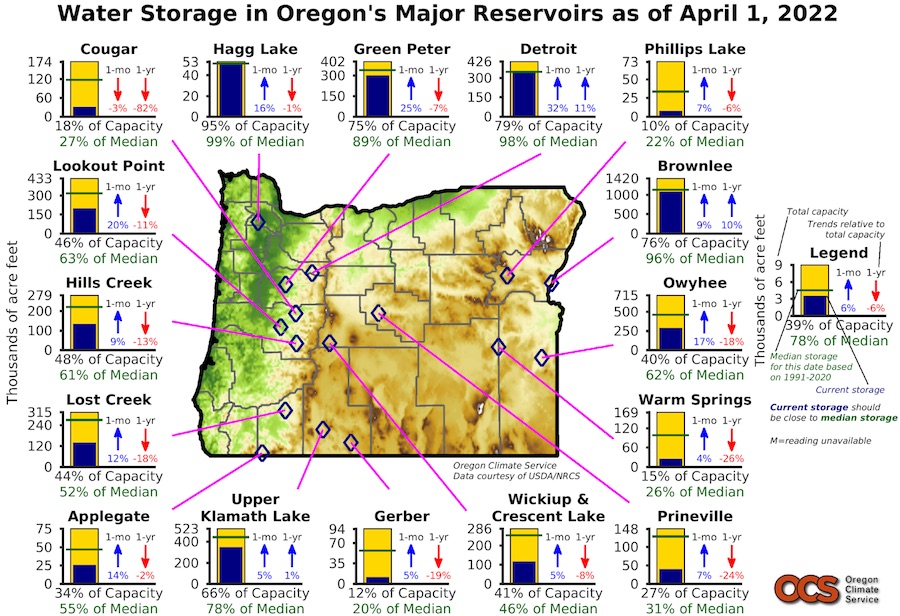
Figure 7. Bureau of Reclamation Major Storage Reservoirs
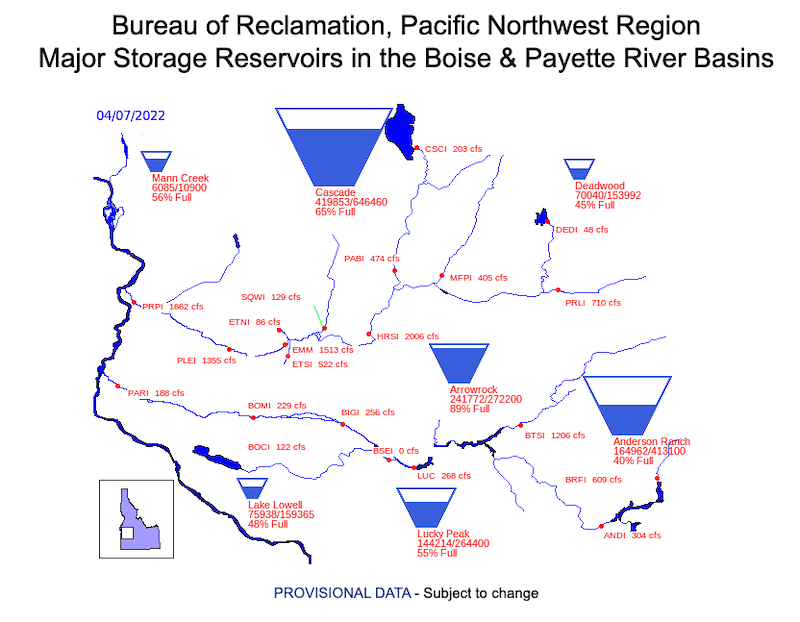
Figure 8. Snake River Historic and Forecasted Surface Water Supply
Outlook and Potential Impacts
- The U.S. Seasonal Drought Outlook (Figure 9) indicates that drought is likely to persist across much of Oregon, eastern Washington, and central and southern Idaho. The Climate Prediction Center Seasonal Outlooks for April-May-June favor below-normal temperatures in Washington, northwestern Oregon, and northern Idaho and an equal chance of above- or below-normal temperatures for the rest of the region (Figure 10). The precipitation outlook for the same period indicates equal chances of above- or below-normal precipitation for Washington, northwestern Oregon, and northern Idaho and below-normal precipitation for most of Oregon and central and southern Idaho (Figure 11).
- Given these long-term forecasts, a spring surge in precipitation that could ameliorate the current drought is unlikely. The most likely and hopeful scenario is that summer temperatures will be close to normal and not exacerbate the drought conditions. If summer temperatures approach record highs (not likely, but possible), drought could intensify and approach previous record levels of drought in these areas.
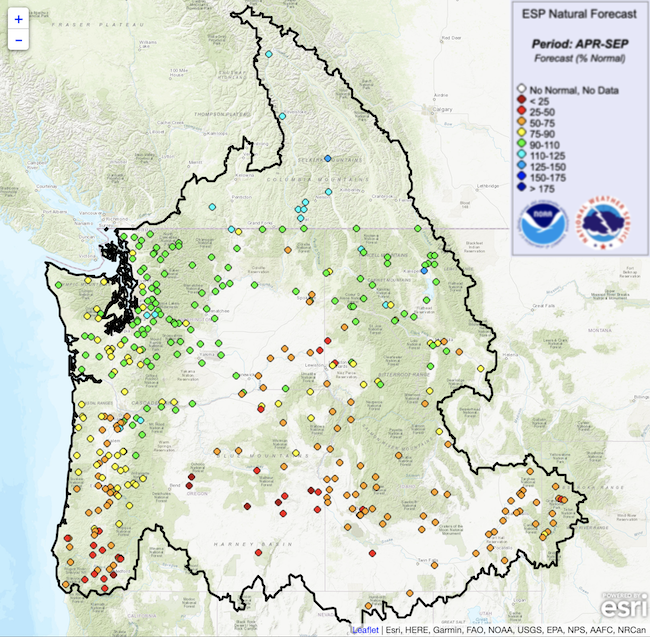
- The Northwest River Forecast Center ESP Natural Forecast for April through September indicates that the water supply will continue to be below normal for the regions in which drought currently is the most severe, including southwestern and central Oregon and southern Idaho. Forecasted April through September runoff in many Washington rivers is near normal, although runoff tends to be greatest in late spring and early summer. Therefore, runoff in the second half of summer may fall below normal (Figure 12).
- The National Significant Wildland Fire Potential Outlook, released on April 1, 2022, indicates above-normal fire potential for central Oregon through June 2022, with above-normal potential expanding to central Washington by July. An updated outlook will be released on May 1.
- Given the current snowpack and reservoir levels across much of Oregon and southern Idaho, it is likely that irrigation will be impacted in terms of late releases, low allotments, and early cut-off dates. Some impacts may be mitigated this year due to planning that was based on last year’s drought. For example, Nampa, Idaho, is establishing a drought task force to plan for and educate the community about drought and best practices for adapting to the resulting low water supply. Irrigation districts are also giving advanced warning to areas where shortages are expected.
Figure 9. April–June Seasonal Drought Outlook
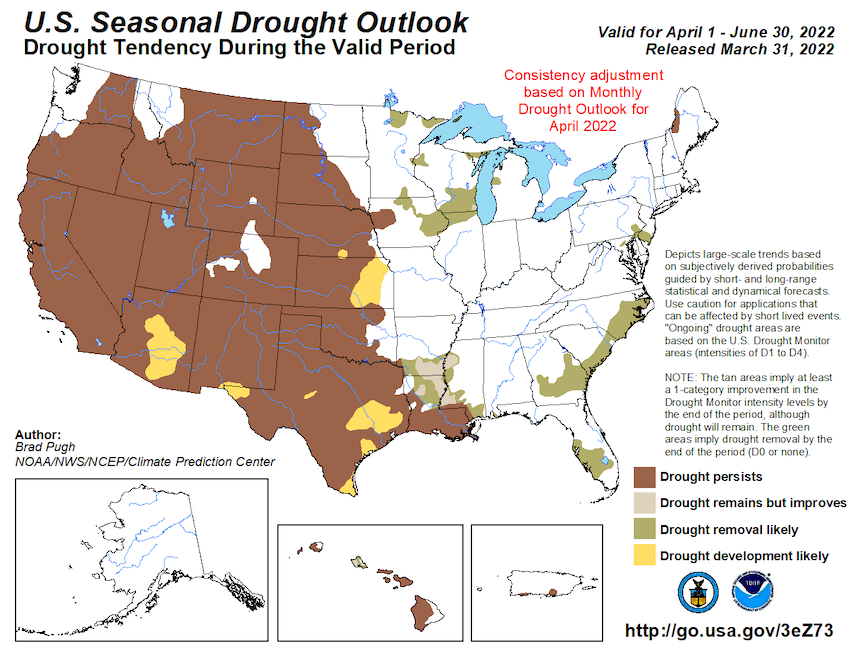
Figure 10. April–June Temperature Outlook
Figure 11. April–June Precipitation Outlook
Figure 12. Northwest River Forecast Center Ensemble Prediction System Natural Forecast
For More Information
- NIDIS and its partners will issue future updates as conditions evolve.
- More local information is available from the following resources:
- For additional regional drought and wildfire resource information, see the 2022 Pacific Northwest Drought Resources.
- Register for the next Pacific Northwest Drought Early Warning System Webinar on April 25 at 11 a.m. PDT.
Prepared By
Britt Parker
NOAA National Integrated Drought Information System, Cooperative Institute for Research in Environmental Sciences (CIRES)
Karin Bumbaco & Nick Bond
Office of the Washington State Climatologist
Jeff Marti
Washington Department of Ecology
David Hoekema
Idaho Department of Water Resources
Ryan Andrews
Oregon Water Resources Department
Larry O’Neill
Oregon Climate Service
Scott Oviatt & Erin Whorton
USDA Natural Resources Conservation Service
Holly Prendeville
USDA Northwest Climate Hub
Joe Casola
NOAA National Centers for Environmental Information
This drought status update is issued in partnership with the states of Oregon, Washington, and Idaho, the USDA Northwest Climate Hub, the USDA Natural Resources Conservation Service, and the Oregon Climate Change Research Institute to communicate a potential area of concern for drought expansion and/or development within the Pacific Northwest based on recent conditions and the upcoming forecast. NIDIS and its partners will issue future drought status updates as conditions evolve.

