The Southeast Faces Significant Drought Impacts from Long-Term Dry Conditions
Key Points
- Moderate to Exceptional Drought (D1-D4) conditions cover 96.83% of the Southeast, and Severe to Exceptional Drought (D2-D4) conditions cover 81.75% of the region. This is the largest area of drought (D1-D4) and of Severe Drought or worse (D2-D4) for the Southeast since the U.S. Drought Monitor started in 2000.
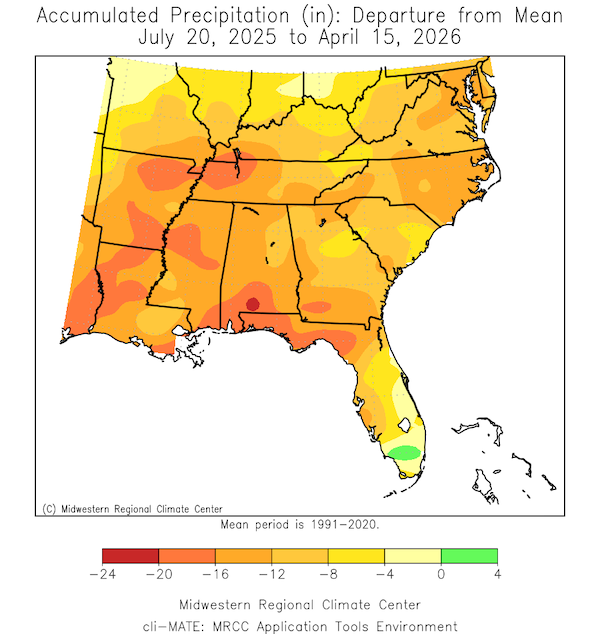
- The entire Southeast has precipitation deficits dating back to July 2025. For most of the region, precipitation deficits range from 8.00 to 16.00 inches over the past nine months.
- Georgia, North Carolina, and South Carolina have experienced record dry conditions for September 2025-March 2026, with records dating back to 1895. September–March was the second driest for Alabama, third driest for Florida, ninth driest for Tennessee, and tenth driest for Virginia.
- Since the beginning of the year, most of the Southeast has received rainfall 4.00 to 8.00 inches below normal. Typically, December–March is when the Southeast “recharges” its water resources (e.g., soils, streamflows, and groundwater). However, the persistent, long-term dryness has not allowed that recharge to happen, so the region is entering its warm season with less stored water than normal. This has implications for agriculture, forestry (fire), and water supplies.
- Southeast agricultural conditions are poor. Soil moisture values are low, making planting and germination difficult or impossible without irrigation. Pasture conditions are in poor condition, causing producers to feed hay to cattle.
- Across the Southeast, fire potential has increased, with some areas experiencing an above-normal occurrence of fires. The dry conditions have allowed for an increase in dry fuels on the ground that elevate the potential for fires to occur.
- Water levels are well below normal across much of the region. The lack of rain has caused decreases in streamflows and groundwater levels, as well as some reservoir levels. This has led to some water restrictions, particularly in parts of Florida. This is alarming as the Southeast enters the time of year where water demands increase and water supplies decrease under normal conditions.
- Dry conditions are forecast for the next week, with above-normal temperatures favored for the next two weeks. These conditions will only enhance the drought conditions. A potentially wetter pattern may arrive later in the month that could bring some short-term relief.
- For the next three months, conditions may improve in some areas if a consistent, wetter pattern sets up. However, current moisture deficits do not put the region in a good situation as temperatures continue to increase and the rainfall pattern switches to summer convection, leading to more localized and inconsistent rainfall.
Current drought coverage, according to the U.S. Drought Monitor (USDM), valid for April 14, 2026. The U.S. Drought Monitor depicts the location and intensity of drought across the country. The map uses 5 classifications: Abnormally Dry (D0), showing areas that may be going into or are coming out of drought, and four levels of drought (D1–D4).
The U.S. Drought Monitor is a joint effort of the National Oceanic and Atmospheric Administration, U.S. Department of Agriculture, National Aeronautics and Space Administration, and National Drought Mitigation Center.
The U.S. Drought Monitor 4-week change map shows where drought has improved, remained the same, or worsened over the past four weeks (March 17–April 14, 2026).
The U.S. Drought Monitor depicts the location and intensity of drought across the country, using 5 classifications (D0–D4). Green hues show where conditions improved, yellow/orange hues show where conditions worsened, and gray areas show where drought remained the same.
A drought index combines multiple drought indicators (e.g., precipitation, temperature, soil moisture) to depict drought conditions. For some products, like the U.S. Drought Monitor, authors combine their analysis of drought indicators with input from local observers. Other drought indices, like the Standardized Precipitation Index (SPI), use an objective calculation to describe the severity, location, timing, and/or duration of drought.
Learn MorePeriods of drought can lead to inadequate water supply, threatening the health, safety, and welfare of communities. Streamflow, groundwater, reservoir, and snowpack data are key to monitoring and forecasting water supply.
Learn MoreDrought can reduce the water availability and water quality necessary for productive farms, ranches, and grazing lands, resulting in significant negative direct and indirect economic impacts to the agricultural sector. Monitoring agricultural drought typically focuses on examining levels of precipitation, evaporative demand, soil moisture, and surface/groundwater quantity and quality.
Learn MoreA drought index combines multiple drought indicators (e.g., precipitation, temperature, soil moisture) to depict drought conditions. For some products, like the U.S. Drought Monitor, authors combine their analysis of drought indicators with input from local observers. Other drought indices, like the Standardized Precipitation Index (SPI), use an objective calculation to describe the severity, location, timing, and/or duration of drought.
Learn MorePeriods of drought can lead to inadequate water supply, threatening the health, safety, and welfare of communities. Streamflow, groundwater, reservoir, and snowpack data are key to monitoring and forecasting water supply.
Learn MoreDrought can reduce the water availability and water quality necessary for productive farms, ranches, and grazing lands, resulting in significant negative direct and indirect economic impacts to the agricultural sector. Monitoring agricultural drought typically focuses on examining levels of precipitation, evaporative demand, soil moisture, and surface/groundwater quantity and quality.
Learn MoreU.S. Drought Monitor Categories
D0 - Abnormally Dry
Abnormally Dry (D0) indicates a region that is going into or coming out of drought, according to the U.S. Drought Monitor.
D1 – Moderate Drought
Moderate Drought (D1) is the first of four drought categories (D1–D4), according to the U.S. Drought Monitor.
D2 – Severe Drought
Severe Drought (D2) is the second of four drought categories (D1–D4), according to the U.S. Drought Monitor.
D3 – Extreme Drought
Extreme Drought (D3) is the third of four drought categories (D1–D4), according to the U.S. Drought Monitor.
D4 – Exceptional Drought
Exceptional Drought (D4) is the most intense drought category, according to the U.S. Drought Monitor.
Total Area in Drought (D1–D4)
Percent area of the Southeast U.S. that is currently in drought (D1–D4), according to the U.S. Drought Monitor.
Drought Change Since Last Month
5-Category Degradation
Drought/dryness has worsened by 5 categories, according to the U.S. Drought Monitor.
4-Category Degradation
Drought/dryness has worsened by 4 categories, according to the U.S. Drought Monitor.
3-Category Degradation
Drought/dryness has worsened by 3 categories, according to the U.S. Drought Monitor.
2-Category Degradation
Drought/dryness has worsened by 2 categories, according to the U.S. Drought Monitor.
1-Category Degradation
Drought/dryness has worsened by 1 category, according to the U.S. Drought Monitor.
No Change
There has been no change in drought conditions at this location.
1-Category Improvement
Drought/dryness has improved by 1 category, according to the U.S. Drought Monitor.
2-Category Improvement
Drought/dryness has improved by 2 categories, according to the U.S. Drought Monitor.
3-Category Improvement
Drought/dryness has improved by 3 categories, according to the U.S. Drought Monitor.
4-Category Improvement
Drought/dryness has improved by 4 categories, according to the U.S. Drought Monitor.
5-Category Improvement
Drought/dryness has improved by 5 categories, according to the U.S. Drought Monitor.
Current drought coverage, according to the U.S. Drought Monitor (USDM), valid for April 14, 2026. The U.S. Drought Monitor depicts the location and intensity of drought across the country. The map uses 5 classifications: Abnormally Dry (D0), showing areas that may be going into or are coming out of drought, and four levels of drought (D1–D4).
The U.S. Drought Monitor is a joint effort of the National Oceanic and Atmospheric Administration, U.S. Department of Agriculture, National Aeronautics and Space Administration, and National Drought Mitigation Center.
The U.S. Drought Monitor 4-week change map shows where drought has improved, remained the same, or worsened over the past four weeks (March 17–April 14, 2026).
The U.S. Drought Monitor depicts the location and intensity of drought across the country, using 5 classifications (D0–D4). Green hues show where conditions improved, yellow/orange hues show where conditions worsened, and gray areas show where drought remained the same.
The U.S. Drought Monitor is released every Thursday morning, with data valid through the previous Tuesday at 8 a.m. EDT.
The U.S. Drought Monitor and change maps are released every Thursday morning, with data valid through the previous Tuesday at 8 a.m. EDT.
A drought index combines multiple drought indicators (e.g., precipitation, temperature, soil moisture) to depict drought conditions. For some products, like the U.S. Drought Monitor, authors combine their analysis of drought indicators with input from local observers. Other drought indices, like the Standardized Precipitation Index (SPI), use an objective calculation to describe the severity, location, timing, and/or duration of drought.
Learn MorePeriods of drought can lead to inadequate water supply, threatening the health, safety, and welfare of communities. Streamflow, groundwater, reservoir, and snowpack data are key to monitoring and forecasting water supply.
Learn MoreDrought can reduce the water availability and water quality necessary for productive farms, ranches, and grazing lands, resulting in significant negative direct and indirect economic impacts to the agricultural sector. Monitoring agricultural drought typically focuses on examining levels of precipitation, evaporative demand, soil moisture, and surface/groundwater quantity and quality.
Learn MoreA drought index combines multiple drought indicators (e.g., precipitation, temperature, soil moisture) to depict drought conditions. For some products, like the U.S. Drought Monitor, authors combine their analysis of drought indicators with input from local observers. Other drought indices, like the Standardized Precipitation Index (SPI), use an objective calculation to describe the severity, location, timing, and/or duration of drought.
Learn MorePeriods of drought can lead to inadequate water supply, threatening the health, safety, and welfare of communities. Streamflow, groundwater, reservoir, and snowpack data are key to monitoring and forecasting water supply.
Learn MoreDrought can reduce the water availability and water quality necessary for productive farms, ranches, and grazing lands, resulting in significant negative direct and indirect economic impacts to the agricultural sector. Monitoring agricultural drought typically focuses on examining levels of precipitation, evaporative demand, soil moisture, and surface/groundwater quantity and quality.
Learn MoreCurrent Conditions in the Southeast
This update is based on data available as of Thursday, April 16 at 8 a.m. ET. We acknowledge that conditions are evolving.
- Regional dry conditions began to build in late summer and early fall 2025. Now, the entire Southeast is experiencing precipitation deficits that date back to July.
- Georgia, North Carolina, and South Carolina have experienced record dry conditions for September 2025–March 2026, with records dating back to 1895. For this same period, it was the second driest September–March for Alabama, third driest for Florida, ninth driest for Tennessee, and tenth driest for Virginia.
- Since the start of the year, most of the region has received rainfall .00 to 8.00 inches below normal.
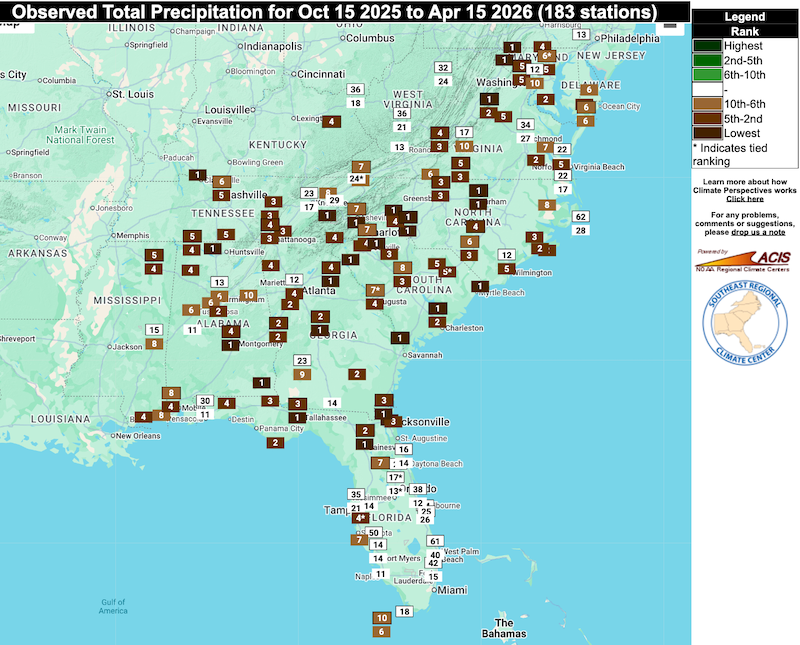
- For the past 6-month period (October 15, 2025–Aprl 15, 2026), fifty monitoring stations with at least 75 years of data experienced conditions that rank among the top five driest on record. Sixteen of these stations experienced record dry conditions for this period.
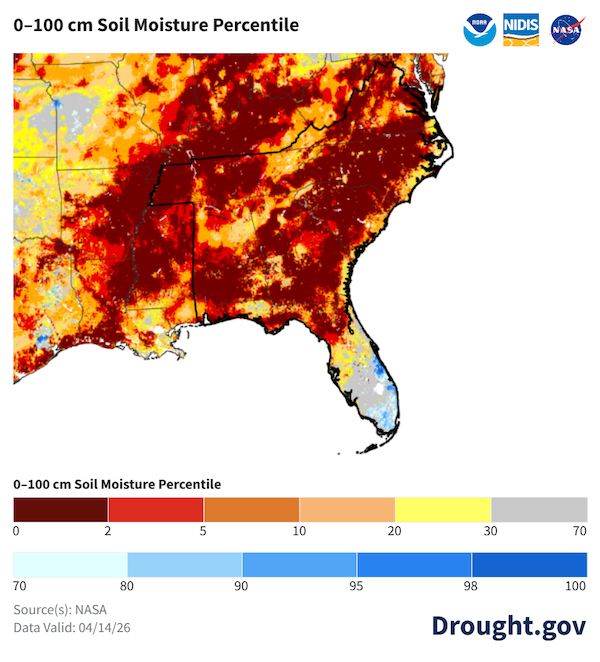
- The persistent dry conditions have allowed soil moisture and streamflow deficits to intensify and expand across the Southeast.
- Drought covers the majority of every state in the Southeast. 100% of North Carolina, 99.95% of Virginia, 99.34% of South Carolina, 98.99% of Florida, 98.13% of Georgia, 93.65% of Tennessee, and 88.66% of Alabama are experiencing drought conditions, according to the U.S. Drought Monitor.
- Over the past 4 weeks, every state in the region has seen drought worsen. Parts of Tennessee saw a 3-category degradation, according to the U.S. Drought Monitor.
Find additional information on national current conditions, or explore conditions in your state.
The Southeast Experienced Below-Normal Precipitation Since July 2025 (9 Months)
Much of the Southeast Experienced Much-Below-Normal Precipitation Over the Past Six Months
Drought Impacts to Agriculture, Forestry and Water Resources
- The dry conditions are having widespread impacts on agriculture, forestry (fire), and water resources across the region.
- Agricultural reports from across the region note that soil moisture is limited or non-existent, impacting production.
- Low soil moisture conditions are making it difficult for seeds to germinate, or the soil is too dry to plant at all.
- Irrigation is needed to keep planted crops alive.
- Stock ponds are low, limiting water supplies for crop irrigation.
- Pasture conditions are poor, meaning producers have to continue to feed hay to livestock, which they have been doing since last fall when this drought began.
- The region is experiencing an increase in fire potential and activity due to persistent long-term dryness that has increased available fuels.
- The National Interagency Coordination Center’s Wildfire Fire Potential Outlooks indicate a greater than usual likelihood that significant wildland fires could occur in much of the region in April. Portions of the region could experience above-normal risk in May and into June.
- Current dry conditions make red flag warnings and burn bans more likely during days with windy conditions and/or low humidity.
- Water resources across the region are low for this time of year.
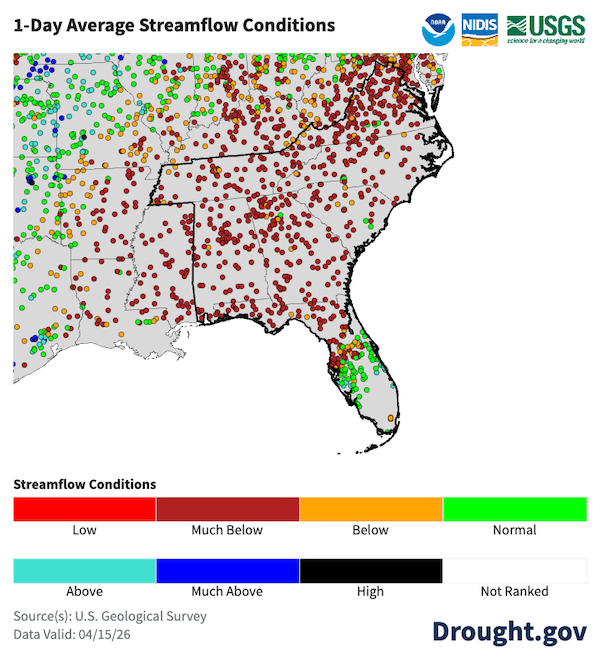
- The entire region, except the Florida Peninsula, is experiencing well-below-normal 1-day average flows.
- Some areas are experiencing below- or well-below-normal groundwater levels.
- All five of Florida’s Water Management Districts have some level of water conservation in place for portions of their service areas.
- Some reservoirs are experiencing below-normal levels for this time of year.
Report conditions and any drought impacts you see or hear via the Condition Monitoring Observer Reports from the National Drought Mitigation Center.
Soil Moisture Conditions Are Below Normal for Much of the Southeast
1-Day Average Streamflows Are Mostly Below Normal
Looking Ahead: Drought Conditions Are Likely to Worsen Before Any Improvement
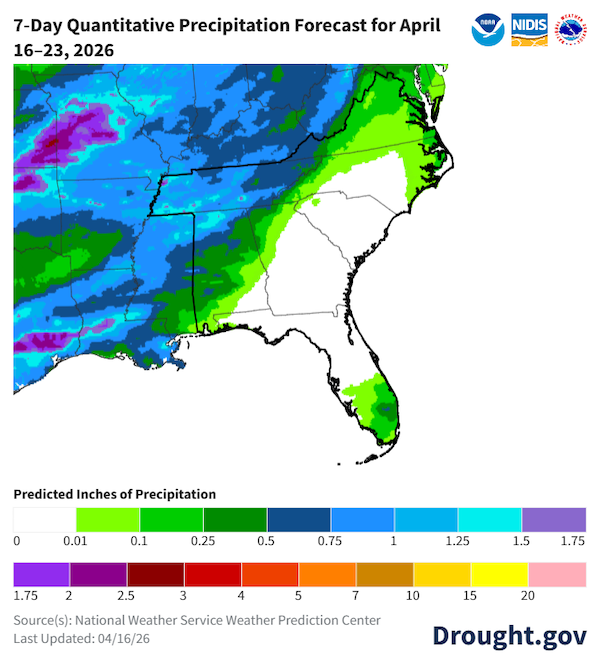
- Over the next 7 days, most of the Southeast will receive limited or no rainfall. Only portions of central and western Tennessee are forecast to receive over 0.50 inches, which is below normal for the time period.
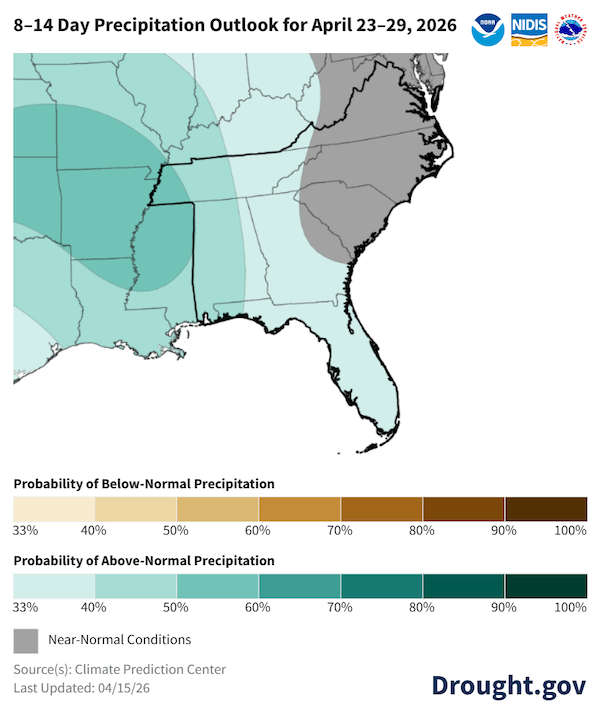
- The April 21–27 outlook slightly favors above-normal precipitation for much of the region, which could provide some much needed rainfall to the region.
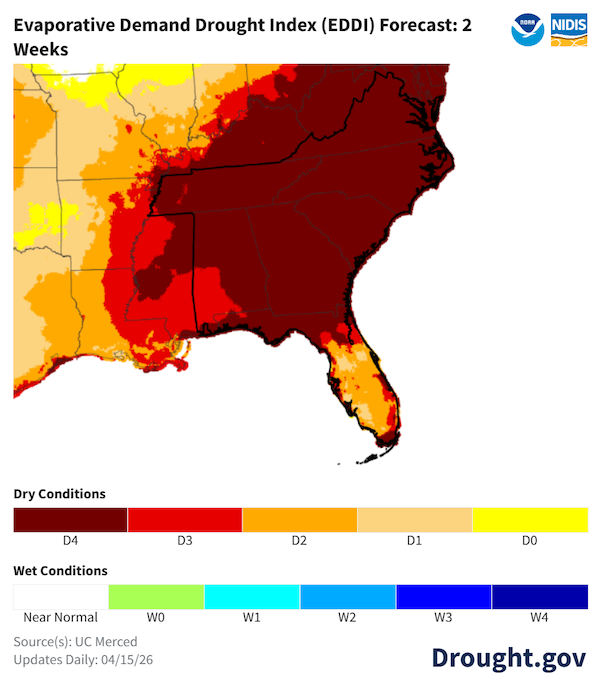
- Over the next two weeks, there are increased chances of above-normal temperatures. Potential evaporative demand (the “thirst of the atmosphere”) is forecast to be extremely high for this time of year. This means that any rain that does fall will be subject to evaporation, which could limit how beneficial this rainfall will be. High evaporative demand also negatively affects the storage in reservoirs, and some reservoirs are already dealing with lower supplies due to low inflow.
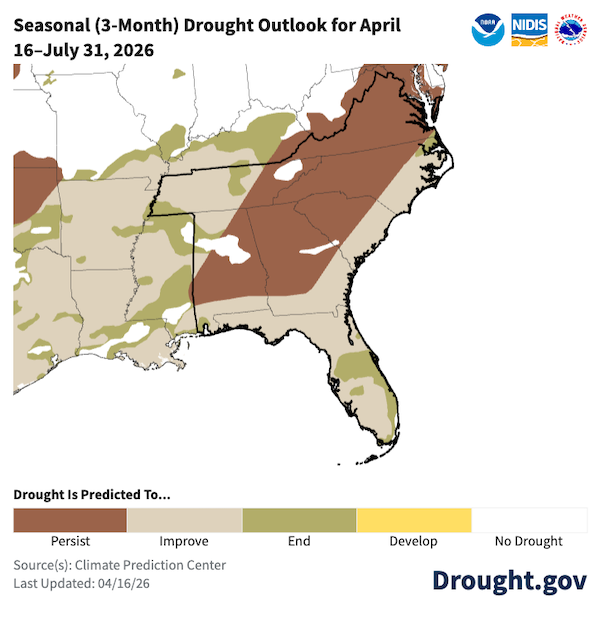
- The National Weather Service Climate Prediction Center’s Seasonal Drought Outlook indicates a mix of conditions for the Southeast, with drought forecast to improve or end across much of Florida, southern Alabama and Georgia, coastal South Carolina, and central/eastern North Carolina and Virginia. Drought is forecast to persist in the rest of the region. However, given the hot and dry conditions in April added to the long-term precipitation, soil moisture, and hydrological deficits, the region needs to return to a consistent, wetter pattern for drought conditions to truly improve across the region.
- The region needs a longer-term wet period of consistent, soaking rains to help recharge soil moisture, streamflows, and groundwater. This may be difficult as late spring and summer precipitation typically comes from convective-type storms, which produce spotty, heavier rainfall that typically do not effectively recharge water resources.
- Additional outlook and forecast information can be found on Drought.gov.
Limited Rainfall Forecast for the Next 7 Days
8-14 Day Precipitation Outlook Favors Above-Normal Precipitation for Most of the Southeast
Evaporative Demand Is Forecast to Be Well Above Normal for the Next Two Weeks
Drought Is Expected to Persist or Improve But Remain for Most of the Southeast
Resources
Drought.gov State Pages
State pages on Drought.gov provide a one-stop shop for tailored state drought information and resources for each state. Find your state here. You can also find county and city-level information on Drought.gov.
National Weather Service Drought Information Statements
View the latest drought information statements from local National Weather Service offices on this interactive map.
- April 10, 2026: Melbourne, Florida (MFL)
- April 9, 2026: Tampa Bay, Florida (TBW)
- April 9, 2026: Miami, Florida (MFL)
- April 9, 2026: Jacksonville, Florida (JAX)
- April 9, 2026: Tallahassee, Florida (TAE)
- April 9, 2026: Mobile, Alabama (MOB)
- April 9, 2026: Morristown, Tennessee (MRX)
- April 9, 2026: Memphis, Tennessee (MEG)
- April 9, 2026: Columbia, South Carolina (CAE)
State Resources
- Alabama: ADECA Drought Planning and Management; Office of the Alabama State Climatologist; Alabama Drought Reach
- Florida: Florida Climate Center; Florida Weekly Drought Summary
- Georgia: Georgia EPD Drought Management; Office of the Georgia State Climatologist
- North Carolina: North Carolina Drought Management Advisory Council; North Carolina State Climate Office
- South Carolina: South Carolina Drought Page; South Carolina State Climatology Office
- Tennessee: Tennessee Weekly Drought Summaries; Tennessee Climate Office
- Virginia: Virginia DEQ Drought Page
Prepared By
Elliot Wickham
Cooperative Institute for Research to Operations in Hydrology (CIROH)/University of Alabama, NOAA’s National Integrated Drought Information System (NIDIS)
William Tollefson
Tennessee Climate Office at East Tennessee State University
Chris Fuhrmann and William Schmitz
Southeast Regional Climate Center
Haley Stuckey and Aaron Meyhew
NOAA’s National Weather Service Southeast River Forecast Center
This Drought Status Update is issued in partnership between the National Oceanic and Atmospheric Administration (NOAA) and partners to communicate a potential area of concern for drought expansion and/or development within the Southeast DEWS region based on recent conditions and the upcoming forecast. NIDIS and its partners will issue future Drought Status Updates as conditions evolve. Special thanks to state partners for their input including the State Climate Offices of Georgia and Tennessee, NWS Weather Forecast Offices in Virginia, University of Georgia, and the North Carolina Department of Environmental Quality. NIDIS is an interagency program within the Climate Program Office, which is part of NOAA's Office of Oceanic and Atmospheric Research.