U.S. flag

An official website of the United States government

Published on

NIDIS-supported researchers from the Pacific Drought Knowledge Exchange developed an improved Standardized Precipitation Index (SPI), which captures how observed rainfall deviates from the climatological average over a given time period. This product uses high-resolution (250 meter) rainfall maps to produce the gridded SPI product in near-real-time on the Hawai'i Climate Data Portal.

Published on

From the catastrophic wildfires in Southern California to record-low streamflow in the Northeast, drought and its impacts touched nearly every corner of the country. The year saw the unusual return of two La Niña events and devastating weather whiplash that brought historic floods to drought-stricken Texas. 2025 showed us that drought is even more devastating when compounded with other climate hazards, such as wildfire and flood. This list breaks down some significant drought-related events of 2025 that made 2025 a year of water extremes across the United States. 

A team of scientists at the NASA Goddard Space Flight Center conducted research to quantify the relative importance—or “drought explainability”—of specific indicators with respect to the U.S. Drought Monitor.

Published on

NOAA's National Integrated Drought Information System (NIDIS), in partnership with the Southern Regional Climate Center (SRCC), conducted a post-drought assessment of the Southern Plains drought of 2020-2025 to understand the drought’s evolution and impacts (including economic costs) and communicate them to decision-makers across the region, the private sector, and the public. 

Published on

Actionable, user-friendly, and reliable information is essential for risk-informed decision-making across the Mississippi River Basin. In response to impacts of drought in the region, NOAA’s National Integrated Drought Information System (NIDIS) built a Mississippi River Basin Drought and Water Dashboard

Published on

This summer, hot and dry conditions are already driving large wildfires in the Western U.S. Check out the 10 maps below to better understand the conditions underlying current large fires and what’s forecast for fire and drought in the coming months.

Published on

Weather whiplash is the abrupt and intense change from one extreme weather condition to another, such as dramatic temperature swings from hot to cold, heavy snowfall to rapid melt, and as is common in Texas, a period of prolonged drought followed by flooding. 

The US Gridded Standardized Precipitation Index (SPI) is derived from the nClimGrid-Daily dataset and and includes timescales of 1, 2, and 3 weeks, as well as 1, 2, 3, 4, 6, 9, and 12 months.

Event Date
June 5, 2025

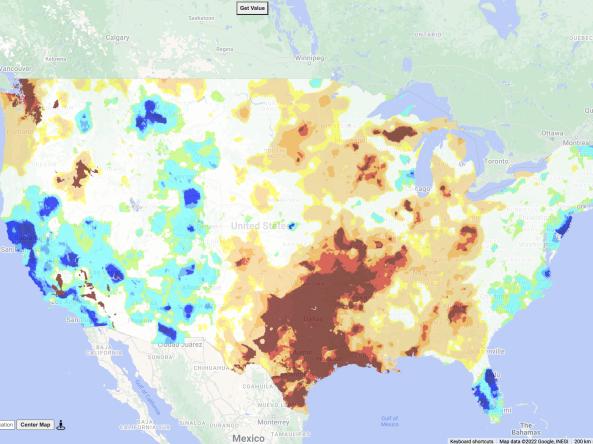
As of June 3, 38.8% of the Missouri River Basin and 25% of the Southern Plains are in drought, according to the U.S. Drought Monitor. NOAA’s Climate Prediction Center predicts that drought will develop this summer from North Dakota through Nebraska and persist across large parts of the Missouri River Basin states. Kansas, Oklahoma, and northern Texas could see short-term drought improvement, but long-term drought impacts may remain.

Event Date
June 3, 2025

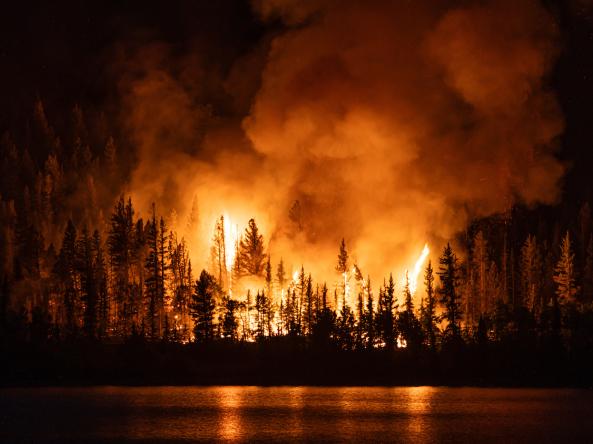
Drought has expanded and intensified in much of the southwestern U.S. since the start of the water year (October 1, 2024). This summer’s outlook for warmer-than-normal conditions could intensify drought and wildfire conditions, but the monsoon may provide some potential for relief. Join the Southwest Drought and Wildfire Summer Outlook Webinar to get an update on the drought and outlook, as well as a look at the upcoming monsoon and wildland fire season.

Subscribe to Precipitation