U.S. flag

An official website of the United States government

The U.S. government is closed. This site will not be updated; however, NOAA websites and social media channels necessary to protect lives and property will be maintained. To learn more, visit commerce.gov.

For the latest forecasts and critical weather information, visit weather.gov.

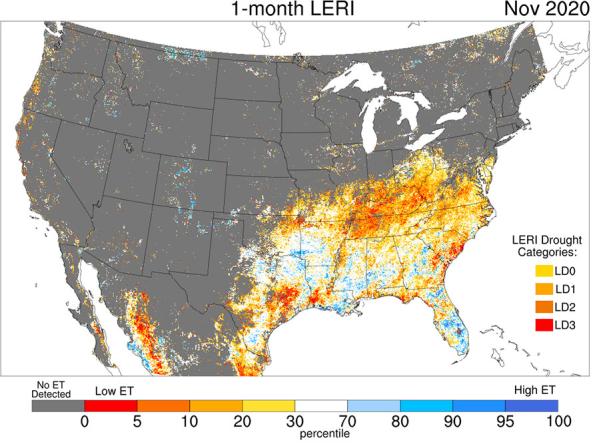
The Landscape Evaporative Response Index (LERI) is an experimental drought monitoring and early warning guidance tool that measures the anomaly in the actual evapotranspiration (ETa) from the land surface. This web page provides LERI plots based on accumulated 8-day, monthly, seasonal, growing season, and annual ETa for the contiguous United States and northern Mexico at a 1-km spatial resolution. 

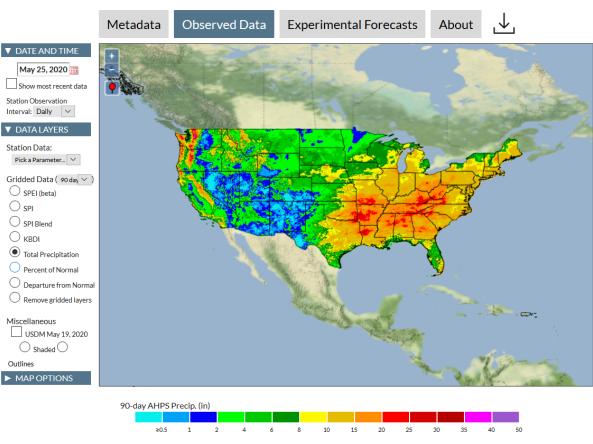
The Global Gridded Standardized Precipitation Index (SPI) is derived from the CMORPH daily dataset and includes timescales of 1, 3, 6 and 9 months.  The NOAA CMORPH precipitation dataset is a gridded dataset derived from combining numerous microwave-based estimates from low orbiter satellites. 

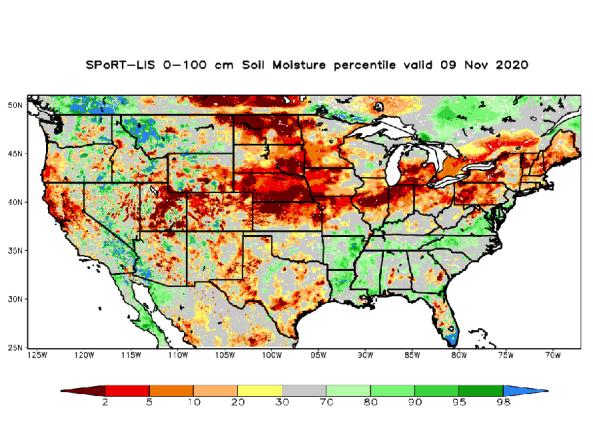
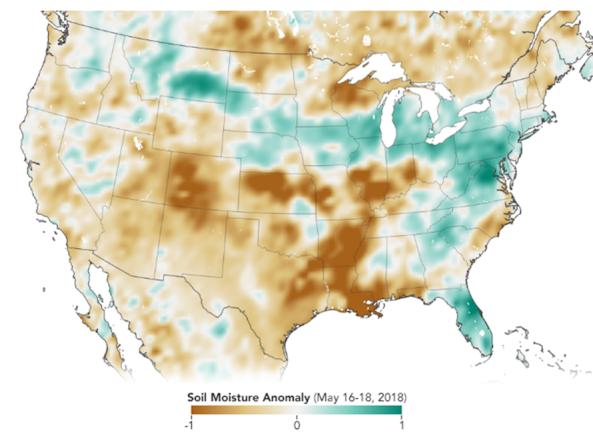
NASA’s Short-term Prediction and Transition Center – Land Information System (SPoRT-LIS) provides high-resolution (about 3-km) gridded soil moisture products in real-time to support regional and local modeling and improve situational awareness.

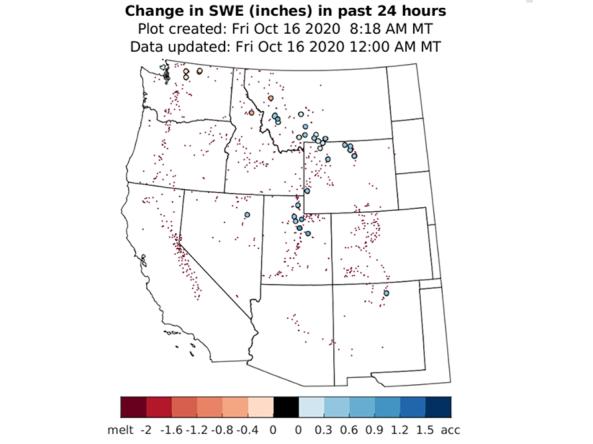
Snow Today updates daily images on snow conditions and relevant data, and also provides monthly scientific analyses from January to May, or more frequently as conditions warrant. The National Snow and Ice Data Center is part of CIRES at the University of Colorado Boulder. 

The Soil Moisture Active Passive (SMAP) mission is an orbiting observatory that measures the amount of water in the top 5 cm of soil everywhere on the Earth’s surface every 3 days.

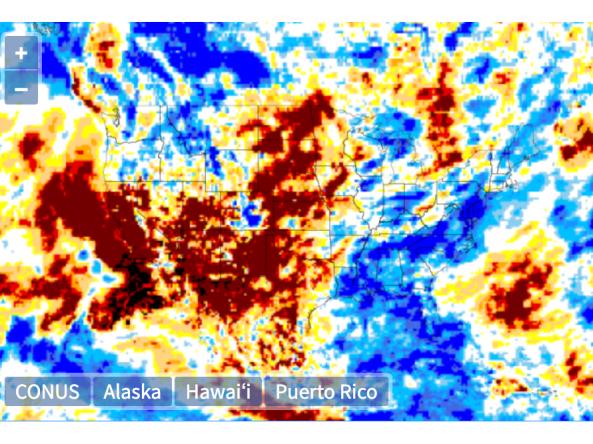
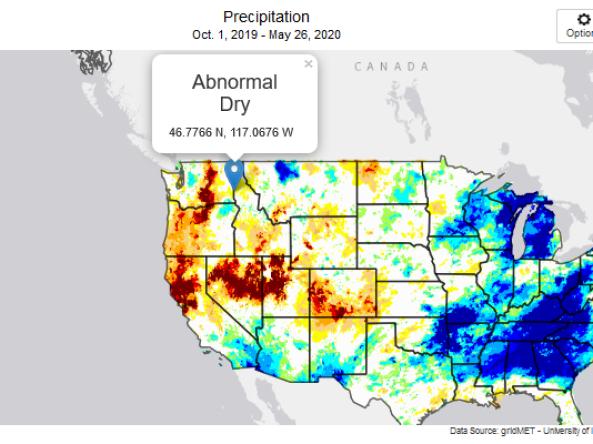
This tool, available as part of The Climate Toolbox, provides maps and summary tables of different drought types, such as agricultural and meteorological drought, for a location in the contiguous United States and enables easy comparison to a display of the current map of the U.S. Drought Monitor.

The Integrated Water Portal is a map-driven data exploration and visualization tool that brings together water data from several agencies and allows users to quickly explore regional and local water conditions, focused mostly on surface and near surface supplies.

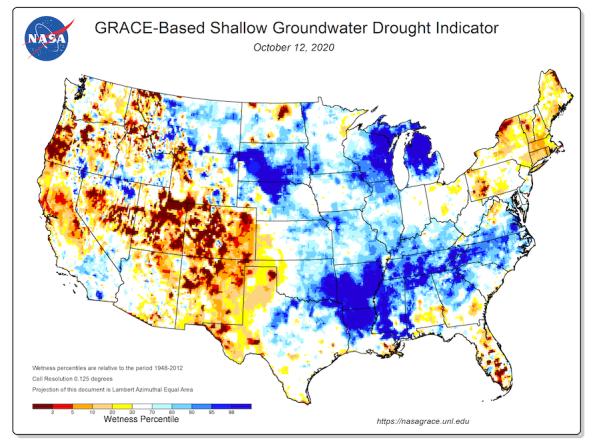
Groundwater and soil moisture drought indicators based on terrestrial water storage observations derived from GRACE satellite data and integrated with other observations, produced each week by NASA.

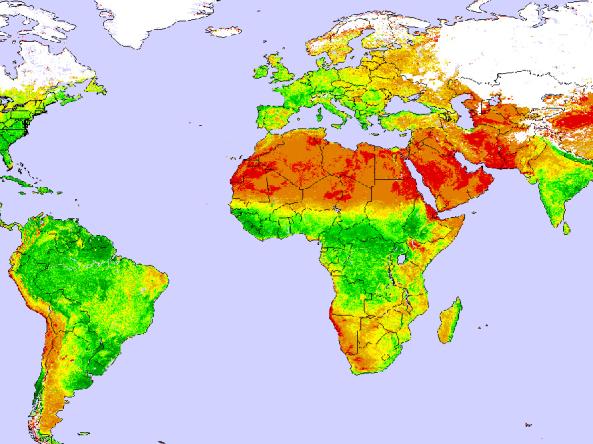
Global and Regional Vegetation Health (VH) is a NOAA/NESDIS system estimating vegetation health, moisture condition, thermal condition and their products.

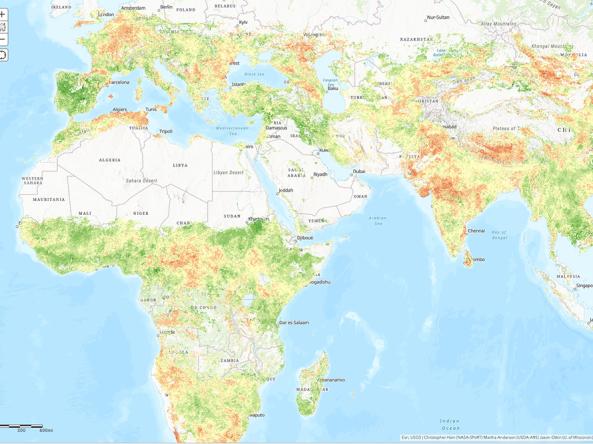
NASA/USDA provides access to Evaporative Stress Index (ESI) data products - a drought index based on remotely sensed evapotranspiration (ET).

Subscribe to Satellite