Recent storms bring much-needed snow and rain, but drought continues.
- Moderate-to-Extreme Drought remains across California and Nevada, which typically receive about half of their precipitation in December through February.
- Recent storms have brought some relief to the region, increasing snow pack and moistening soils. The storms were not enough to remove long-term drought conditions and impacts.
- Preparation for continued drought impacts (e.g., pasture conditions, water supply, fire risk) should be considered, especially in the driest areas. Recent improvements may be temporary as dryness returns and long-term water deficits in the region continue.
The U.S. Drought Monitor (USDM) is updated each Thursday to show the location and intensity of drought across the country. Drought categories show experts’ assessments of conditions related to dryness and drought including observations of how much water is available in streams, lakes, and soils compared to usual for the same time of year.
California/Nevada conditions as of February 2, 2021:
- 86% of California is experiencing Moderate to Exceptional Drought (D1-D4), with 28% in Extreme Drought (D3) and 3.75% in Exceptional Drought (D4)
- California population in drought: 27,022,164
- 99.7% of Nevada is experiencing Moderate to Exceptional Drought (D1-D4), with 29% in Exceptional Drought (D4)
- Nevada population in drought: 2,700,553
U.S. Drought Monitor Categories
The U.S. Drought Monitor (USDM) is updated each Thursday to show the location and intensity of drought across the country. Drought categories show experts’ assessments of conditions related to dryness and drought including observations of how much water is available in streams, lakes, and soils compared to usual for the same time of year.
California/Nevada conditions as of February 2, 2021:
- 86% of California is experiencing Moderate to Exceptional Drought (D1-D4), with 28% in Extreme Drought (D3) and 3.75% in Exceptional Drought (D4)
- California population in drought: 27,022,164
- 99.7% of Nevada is experiencing Moderate to Exceptional Drought (D1-D4), with 29% in Exceptional Drought (D4)
- Nevada population in drought: 2,700,553
Current Conditions
- According to the U.S. Drought Monitor, drought conditions over the last 2 weeks intensified in Nevada and improved over coastal, central, and northern California. Long-term precipitation deficits from Water Year 2020 remain throughout the region.
Learn More About Short- vs. Long-Term Drought
- The La Niña pattern that developed in the tropical Pacific in Autumn 2020 remains firmly in place. Over the historical record, La Niña tilts odds toward wetter water years in the Pacific Northwest and drier water years in the Southwest U.S. There is large uncertainty in the northern parts of California and Nevada.
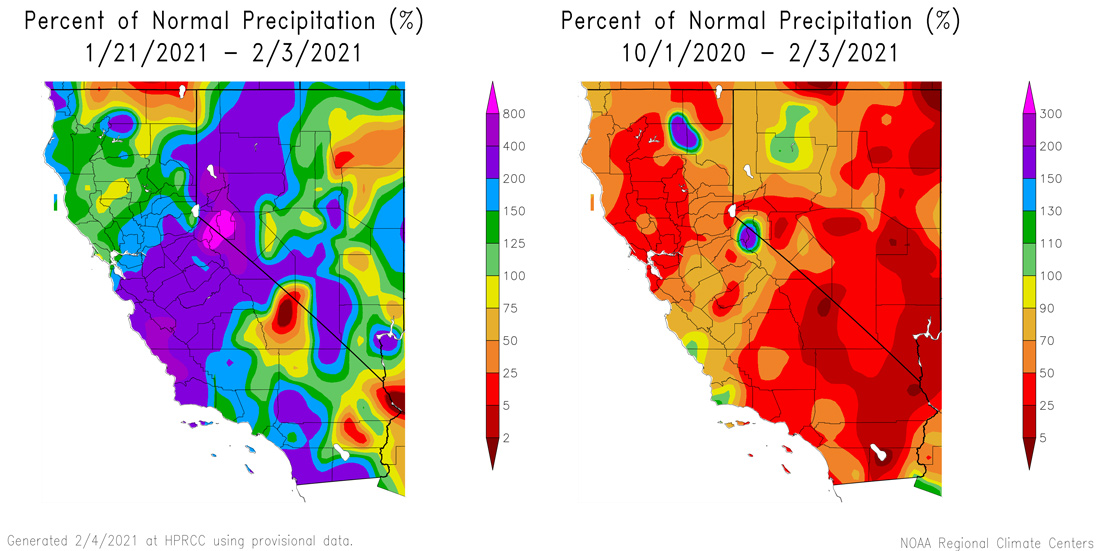
- An atmospheric river that made landfall in central California and stalled before moving south brought widespread precipitation to the region, with central California and western, northern Nevada receiving the most precipitation from the storm.
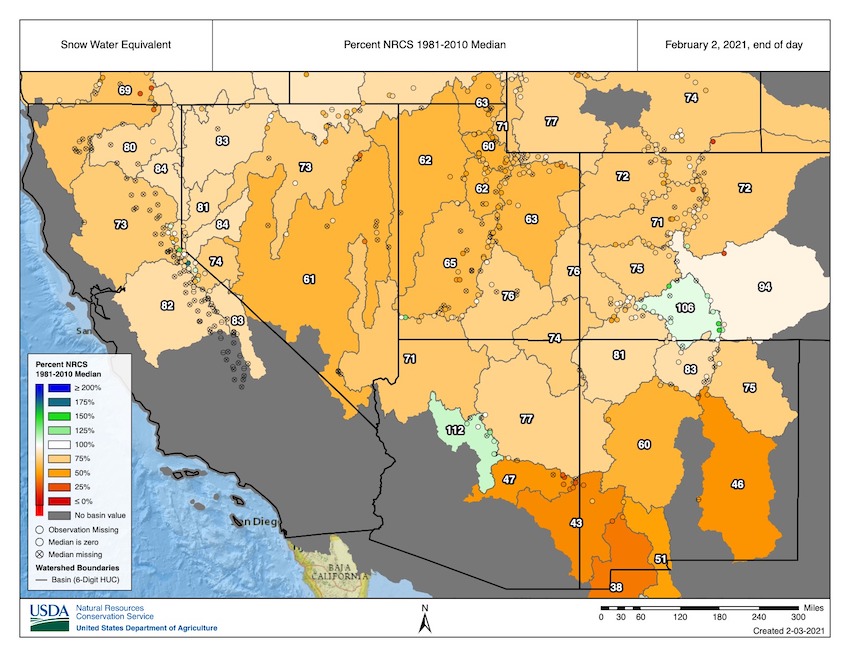
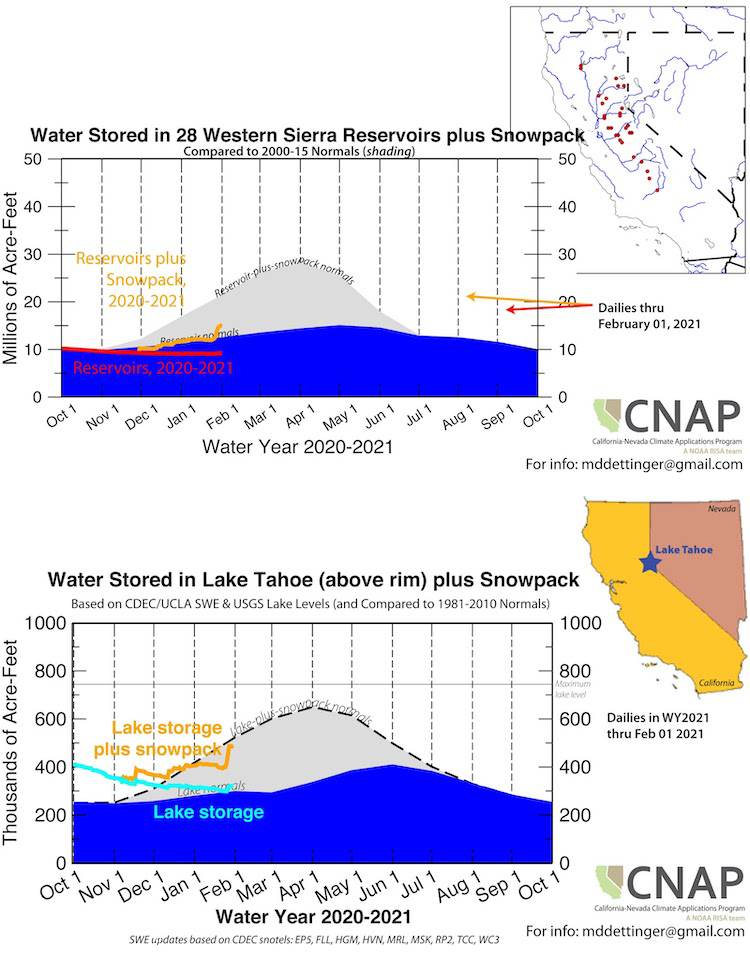
- According to the California Department of Water Resources, the statewide average snow water equivalent (SWE) of the Sierra Nevada snowpack climbed to 12.5 inches (70% of normal) by February 2, up from about 6 inches (less than 40%) just 10 days earlier. The Feb. 3rd Phillips Station manual snow survey recorded SWE of 93% of average for that location. SWE values remain below normal across the Sierras and the Colorado River Basin.
- Most reservoir levels are below normal in the northern, central, and southern Sierras, and Lake Tahoe is approaching normal levels for this time of year.
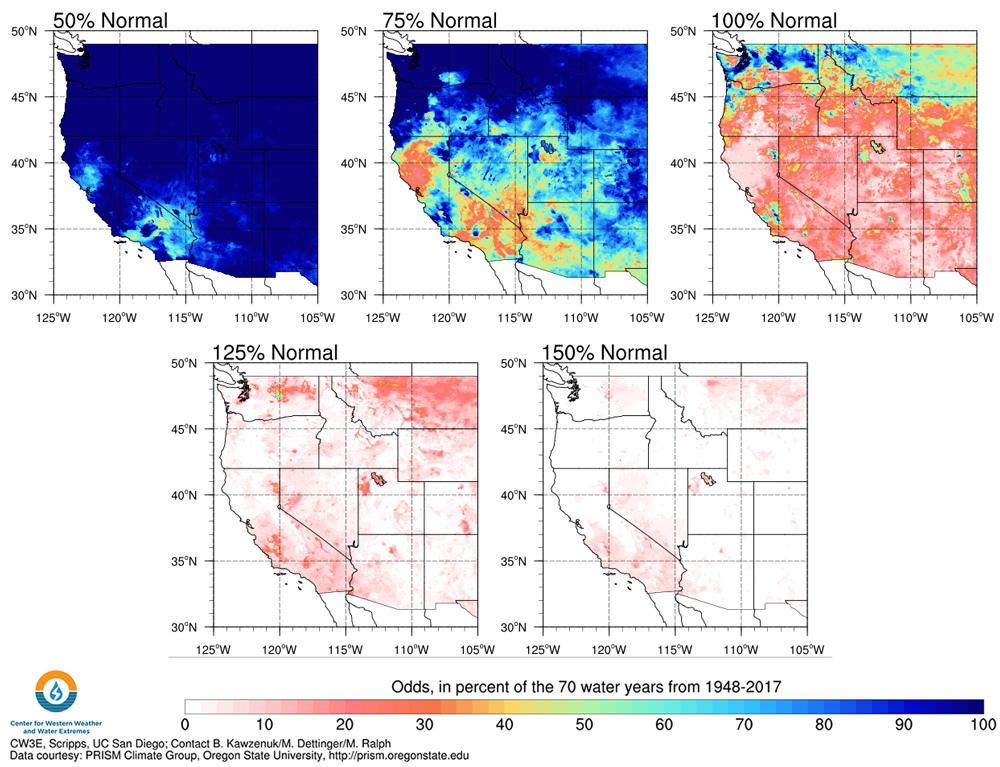
- The odds of reaching normal precipitation for the water year are now less than 10% in parts of California-Nevada, with almost the entire region having odds of less than 30%.
Percent of Normal Precipitation
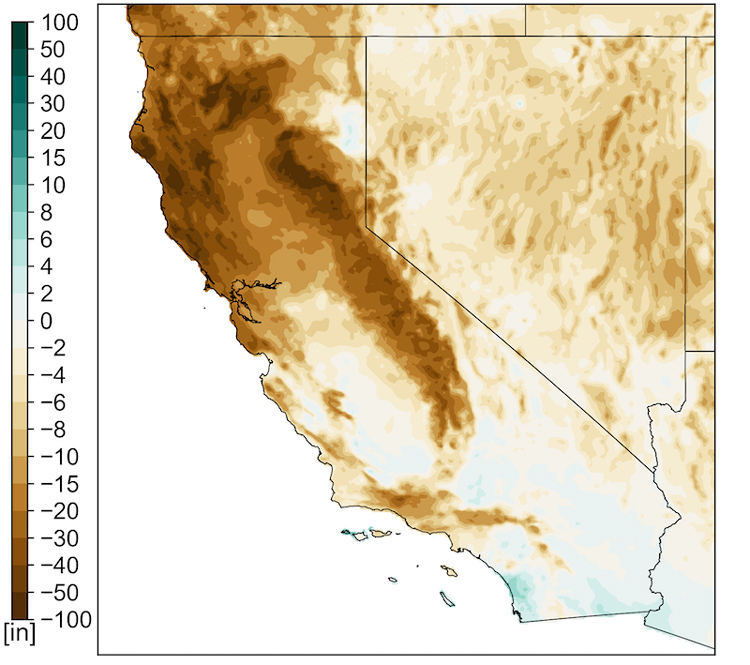
Total Precipitation Excess/Deficit Since October 1, 2019
Snow Water Equivalent Percent of Median
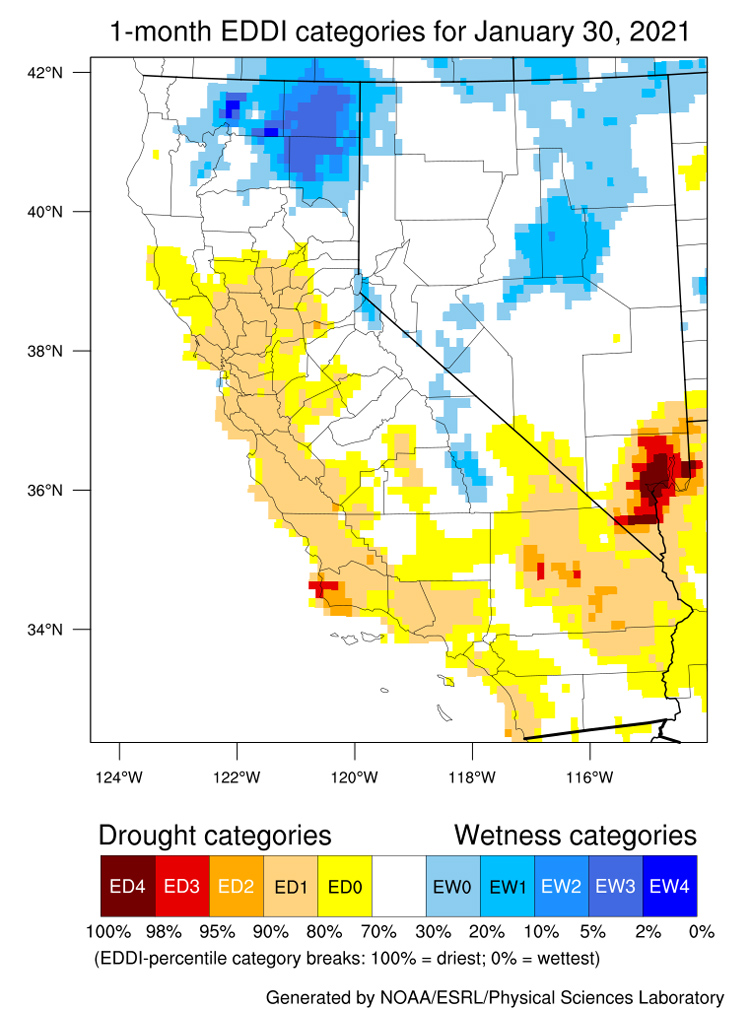
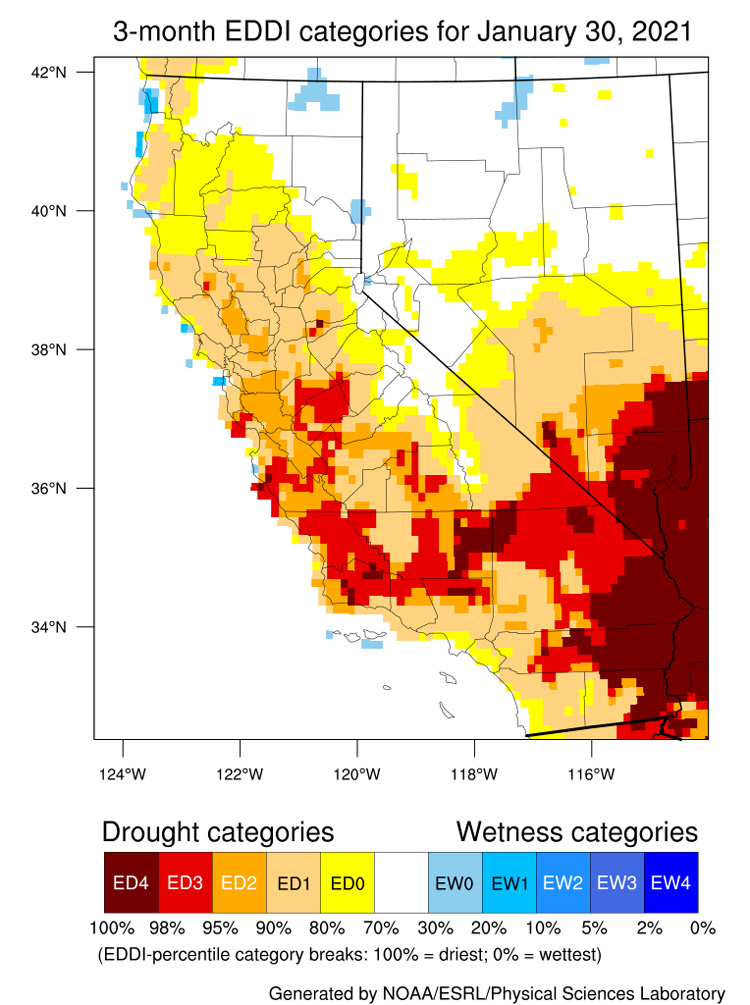
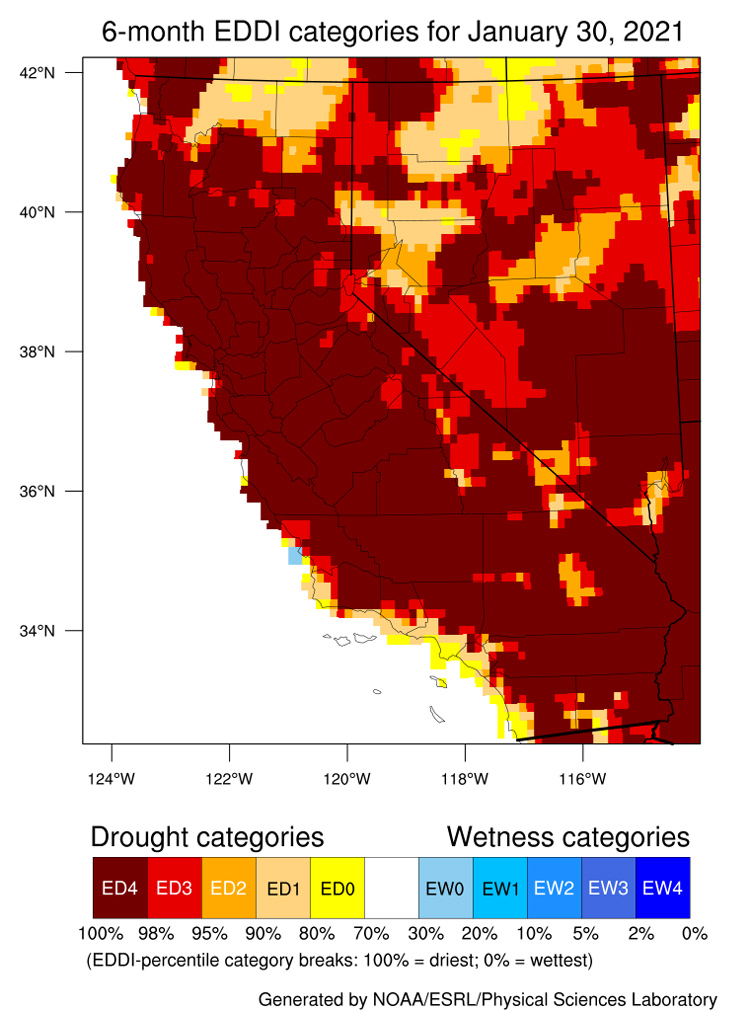
Evaporative Demand Drought Index (EDDI): 1 Month, 3 Month, 6 Month
California/Nevada Soil Moisture Drought Intensity: February 2, 2021
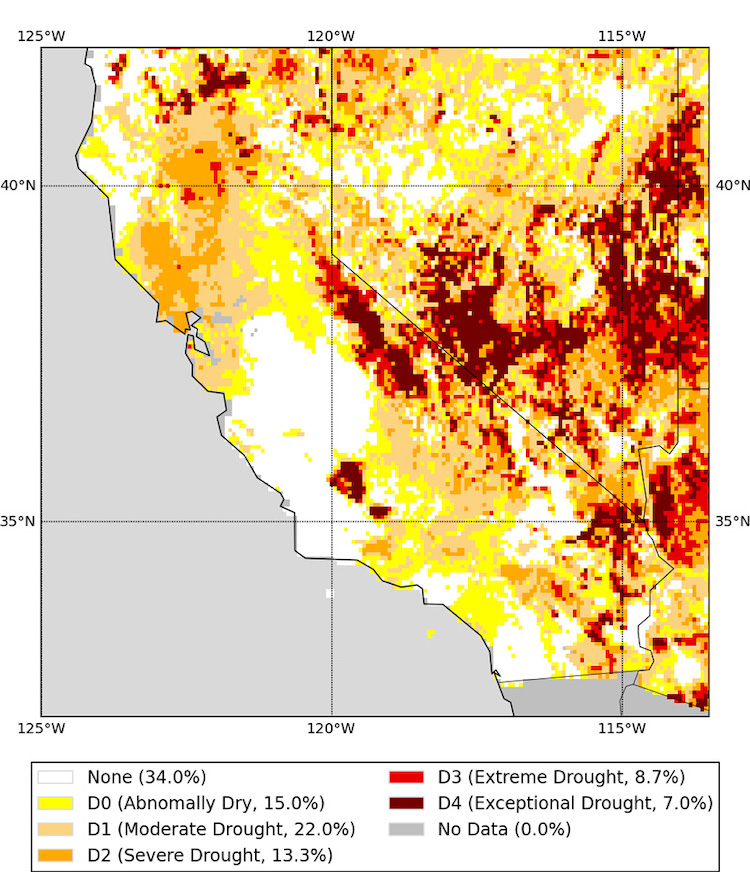
Soil moisture drought intensity for California and Nevada. Valid February 2, 2021. Source: UCLA Drought Monitor.
Water Storage in the Western Sierra Nevada and Lake Tahoe
Odds of Water Year 2021 Reaching Various Fractions of Water Year Normal Precipitation Totals
Drought Impacts
Recent news and articles from the California Department of Water Resources:
- Water Year 2021: How Are We Doing?
- How Does DWR Manage Water Allocations to the State’s Public Water Agencies?
- Dry Conditions Continue Even as Recent Winter Storms Bring Much-Needed Snow
Drought & Climate Outlook
ENSO
NOAA’s ENSO alert system status is currently a La Niña advisory and is likely to continue through the Northern Hemisphere winter 2020-21 (~95% chance during January-March), with a potential transition to ENSO-neutral during the spring of 2021 (55% chance during April-June). For more information, please check out the NOAA ENSO blog and the Western Regional Climate Center handout about the La Niña impacts for the West.
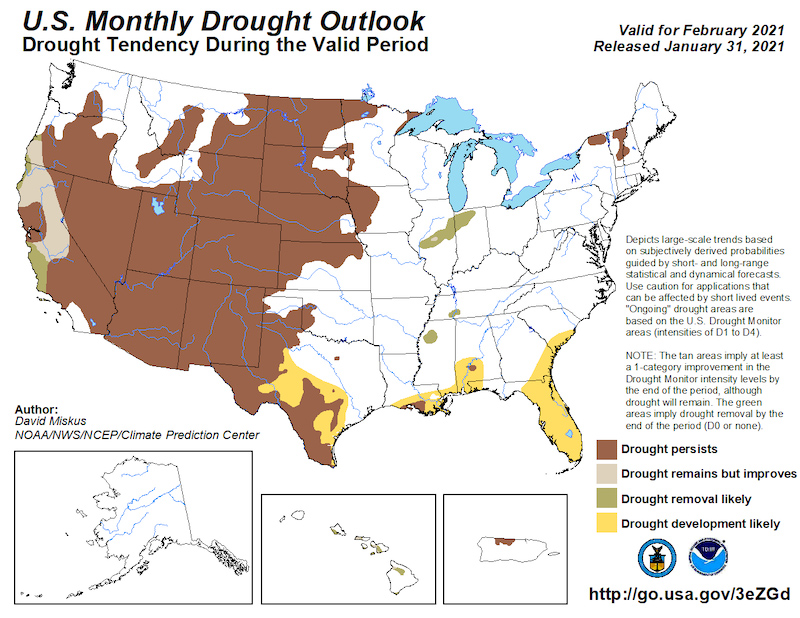
Monthly Drought Outlook
The monthly drought outlook (released Jan. 31) takes into account the late January to early February storminess. The outlook shows drought persistence over Nevada. In California, as a result of these storms, potential short-term improvement is depicted but may be fleeting as dry conditions return.
Temperature & Precipitation
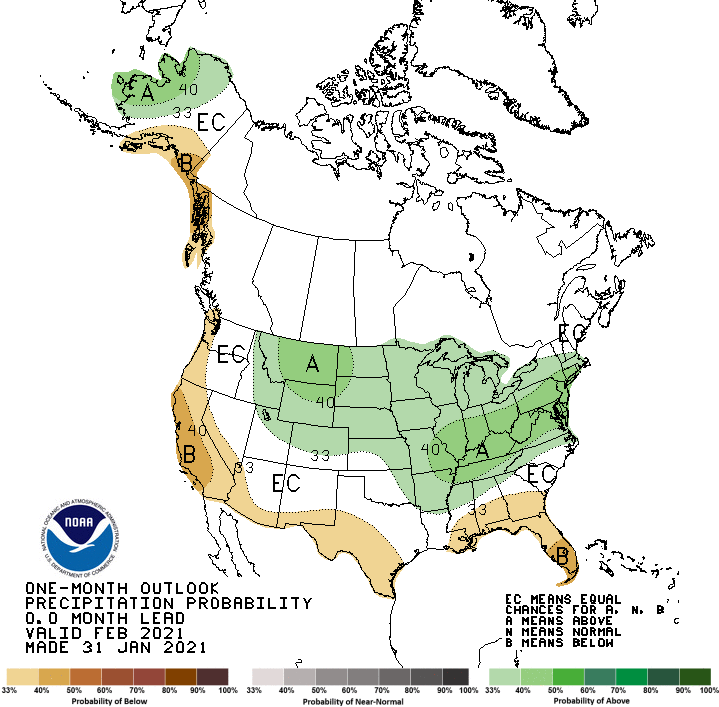
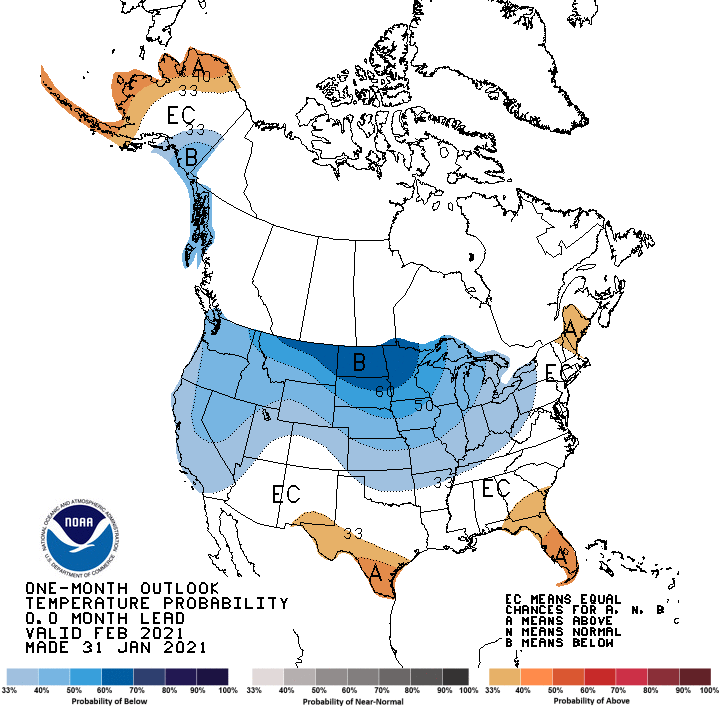
The NOAA Climate Prediction Center's short-term to seasonal forecasts favor a return of dry conditions with a return of a “typical” La Niña pattern and a dry southwest. A return to dryness would continue to build drought impacts in February, climatologically one of the wettest months for the region.
Climate Prediction Center 1-Month Outlooks
Drought Early Warning Resources
California Nevada California-Nevada DEWS
Prepared By
Amanda Sheffield
NOAA/NIDIS California-Nevada DEWS Regional Drought Information Coordinator
Email: amanda.sheffield@noaa.gov
Julie Kalansky
Program Manager, California-Nevada Applications Program (NOAA RISA team)
Email: jkalansky@ucsd.edu
This Drought Status Update is issued in partnership between the National Oceanic and Atmospheric Administration (NOAA) and the California-Nevada Applications Program, a NOAA RISA team, to communicate the current state of drought conditions in California-Nevada based on recent conditions and the upcoming forecast. NIDIS and its partners will issue future drought updates as conditions evolve.
Register here for the next California-Nevada Drought & Climate Outlook webinar on March 22, 2021 at 11 am PDT.
