Snow Drought Develops in Dry January, Widespread Precipitation on the Way
Key Points
- After a wet start to Water Year 2026 (October 1, 2025), all of California was drought free since mid-January, and currently ~20% of Nevada is in drought.
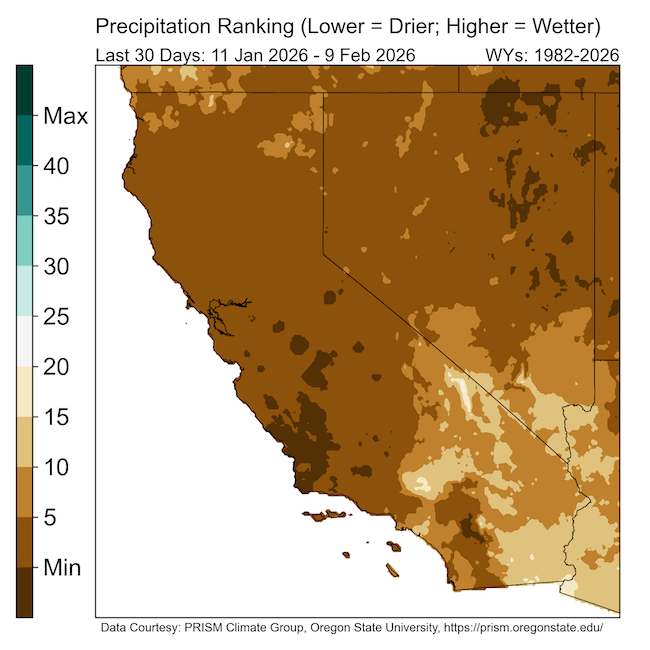
- However, the region was mostly dry from mid-January through the first week of February. These mid-winter dry conditions, along with above-normal temperatures and generally clear skies, led to mid-winter snowmelt and sublimation (when snow turns directly into water vapor, bypassing the melting stage).
- Decreased snowpack led to snow drought conditions across both states, with conditions most severe in Nevada.
- In the Upper Colorado River Basin, an important water supply for California and Nevada, snow water equivalent is the lowest it has been since water year 1986.
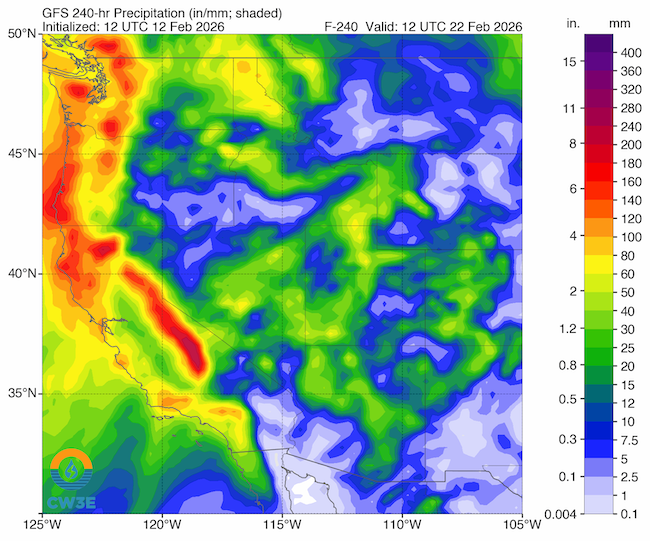
- The region is expected to shift to a wetter pattern over the next 10 days, with widespread precipitation expected throughout the region. Outlooks beyond this timeframe are less certain.
This update is based on data available as of Thursday, February 12, 2026 at 7:00 a.m. PT. We acknowledge that conditions are evolving.
The U.S. Drought Monitor depicts the location and intensity of drought across the country. The map uses 5 classifications: Abnormally Dry (D0), showing areas that may be going into or are coming out of drought, and four levels of drought (D1–D4).
The U.S. Drought Monitor is a joint effort of the National Oceanic and Atmospheric Administration, U.S. Department of Agriculture, National Aeronautics and Space Administration, and National Drought Mitigation Center.
This water year to date U.S. Drought Monitor change map shows where drought has improved, degraded, or remained the same from September 30, 2025–February 10, 2026. Yellow shades indicate drought degradation, while green shades indicate drought improvement, according to the U.S. Drought Monitor.
A time series of the U.S. Drought Monitor showing 2024-2026 drought conditions over California-Nevada. The vertical axis shows the total percent land area in drought, while the horizontal axis shows the date.
A drought index combines multiple drought indicators (e.g., precipitation, temperature, soil moisture) to depict drought conditions. For some products, like the U.S. Drought Monitor, authors combine their analysis of drought indicators with input from local observers. Other drought indices, like the Standardized Precipitation Index (SPI), use an objective calculation to describe the severity, location, timing, and/or duration of drought.
Learn MorePeriods of drought can lead to inadequate water supply, threatening the health, safety, and welfare of communities. Streamflow, groundwater, reservoir, and snowpack data are key to monitoring and forecasting water supply.
Learn MoreDrought can reduce the water availability and water quality necessary for productive farms, ranches, and grazing lands, resulting in significant negative direct and indirect economic impacts to the agricultural sector. Monitoring agricultural drought typically focuses on examining levels of precipitation, evaporative demand, soil moisture, and surface/groundwater quantity and quality.
Learn MoreA drought index combines multiple drought indicators (e.g., precipitation, temperature, soil moisture) to depict drought conditions. For some products, like the U.S. Drought Monitor, authors combine their analysis of drought indicators with input from local observers. Other drought indices, like the Standardized Precipitation Index (SPI), use an objective calculation to describe the severity, location, timing, and/or duration of drought.
Learn MorePeriods of drought can lead to inadequate water supply, threatening the health, safety, and welfare of communities. Streamflow, groundwater, reservoir, and snowpack data are key to monitoring and forecasting water supply.
Learn MoreDrought can reduce the water availability and water quality necessary for productive farms, ranches, and grazing lands, resulting in significant negative direct and indirect economic impacts to the agricultural sector. Monitoring agricultural drought typically focuses on examining levels of precipitation, evaporative demand, soil moisture, and surface/groundwater quantity and quality.
Learn MoreDrought & Dryness Categories
% AreaD0 – Abnormally Dry
Abnormally Dry (D0) indicates a region that is going into or coming out of drought.
D1 – Moderate Drought
Moderate Drought (D1) is the first of four drought categories (D1–D4), according to the U.S. Drought Monitor.
D2 – Severe Drought
Severe Drought (D2) is the second of four drought categories (D1–D4), according to the U.S. Drought Monitor.
D3 – Extreme Drought
Extreme Drought (D3) is the third of four drought categories (D1–D4), according to the U.S. Drought Monitor.
D4 – Exceptional Drought
Exceptional Drought (D4) is the most intense drought category, according to the U.S. Drought Monitor.
Total Area in Drought (D1–D4)
Percent area of the California–Nevada region that is currently in drought (D1–D4), according to the U.S. Drought Monitor.
Drought Degradation
5-Category Degradation
Drought/dryness has worsened by 5 categories, according to the U.S. Drought Monitor.
4-Category Degradation
Drought/dryness has worsened by 4 categories, according to the U.S. Drought Monitor.
3-Category Degradation
Drought/dryness has worsened by 3 categories, according to the U.S. Drought Monitor.
2-Category Degradation
Drought/dryness has worsened by 2 categories, according to the U.S. Drought Monitor.
1-Category Degradation
Drought/dryness has worsened by 1 category, according to the U.S. Drought Monitor.
Drought Improvement
1-Category Improvement
Drought/dryness has improved by 1 category, according to the U.S. Drought Monitor.
2-Category Improvement
Drought/dryness has improved by 2 categories, according to the U.S. Drought Monitor.
3-Category Improvement
Drought/dryness has improved by 3 categories, according to the U.S. Drought Monitor.
4-Category Improvement
Drought/dryness has improved by 4 categories, according to the U.S. Drought Monitor.
5-Category Improvement
Drought/dryness has improved by 5 categories, according to the U.S. Drought Monitor.
U.S. Drought Monitor
D0 - Abnormally Dry
Abnormally Dry (D0) indicates a region that is going into or coming out of drought, according to the U.S. Drought Monitor. View typical impacts by state.
D1 – Moderate Drought
Moderate Drought (D1) is the first of four drought categories (D1–D4), according to the U.S. Drought Monitor. View typical impacts by state.
D2 – Severe Drought
Severe Drought (D2) is the second of four drought categories (D1–D4), according to the U.S. Drought Monitor. View typical impacts by state.
D3 – Extreme Drought
Extreme Drought (D3) is the third of four drought categories (D1–D4), according to the U.S. Drought Monitor. View typical impacts by state.
D4 – Exceptional Drought
Exceptional Drought (D4) is the most intense drought category, according to the U.S. Drought Monitor. View typical impacts by state.
The U.S. Drought Monitor depicts the location and intensity of drought across the country. The map uses 5 classifications: Abnormally Dry (D0), showing areas that may be going into or are coming out of drought, and four levels of drought (D1–D4).
The U.S. Drought Monitor is a joint effort of the National Oceanic and Atmospheric Administration, U.S. Department of Agriculture, National Aeronautics and Space Administration, and National Drought Mitigation Center.
This water year to date U.S. Drought Monitor change map shows where drought has improved, degraded, or remained the same from September 30, 2025–February 10, 2026. Yellow shades indicate drought degradation, while green shades indicate drought improvement, according to the U.S. Drought Monitor.
A time series of the U.S. Drought Monitor showing 2024-2026 drought conditions over California-Nevada. The vertical axis shows the total percent land area in drought, while the horizontal axis shows the date.
This U.S. Drought Monitor is released every Thursday morning, with data valid through Tuesday at 7 a.m. ET.
This U.S. Drought Monitor (USDM) and USDM change maps are released every Thursday morning, with data valid through Tuesday at 7 a.m. ET.
This U.S. Drought Monitor (USDM) is released every Thursday morning, with data valid through Tuesday at 7 a.m. ET.
A drought index combines multiple drought indicators (e.g., precipitation, temperature, soil moisture) to depict drought conditions. For some products, like the U.S. Drought Monitor, authors combine their analysis of drought indicators with input from local observers. Other drought indices, like the Standardized Precipitation Index (SPI), use an objective calculation to describe the severity, location, timing, and/or duration of drought.
Learn MorePeriods of drought can lead to inadequate water supply, threatening the health, safety, and welfare of communities. Streamflow, groundwater, reservoir, and snowpack data are key to monitoring and forecasting water supply.
Learn MoreDrought can reduce the water availability and water quality necessary for productive farms, ranches, and grazing lands, resulting in significant negative direct and indirect economic impacts to the agricultural sector. Monitoring agricultural drought typically focuses on examining levels of precipitation, evaporative demand, soil moisture, and surface/groundwater quantity and quality.
Learn MoreA drought index combines multiple drought indicators (e.g., precipitation, temperature, soil moisture) to depict drought conditions. For some products, like the U.S. Drought Monitor, authors combine their analysis of drought indicators with input from local observers. Other drought indices, like the Standardized Precipitation Index (SPI), use an objective calculation to describe the severity, location, timing, and/or duration of drought.
Learn MorePeriods of drought can lead to inadequate water supply, threatening the health, safety, and welfare of communities. Streamflow, groundwater, reservoir, and snowpack data are key to monitoring and forecasting water supply.
Learn MoreDrought can reduce the water availability and water quality necessary for productive farms, ranches, and grazing lands, resulting in significant negative direct and indirect economic impacts to the agricultural sector. Monitoring agricultural drought typically focuses on examining levels of precipitation, evaporative demand, soil moisture, and surface/groundwater quantity and quality.
Learn MoreA drought index combines multiple drought indicators (e.g., precipitation, temperature, soil moisture) to depict drought conditions. For some products, like the U.S. Drought Monitor, authors combine their analysis of drought indicators with input from local observers. Other drought indices, like the Standardized Precipitation Index (SPI), use an objective calculation to describe the severity, location, timing, and/or duration of drought.
Learn MorePeriods of drought can lead to inadequate water supply, threatening the health, safety, and welfare of communities. Streamflow, groundwater, reservoir, and snowpack data are key to monitoring and forecasting water supply.
Learn MoreDrought can reduce the water availability and water quality necessary for productive farms, ranches, and grazing lands, resulting in significant negative direct and indirect economic impacts to the agricultural sector. Monitoring agricultural drought typically focuses on examining levels of precipitation, evaporative demand, soil moisture, and surface/groundwater quantity and quality.
Learn MoreCalifornia-Nevada Current Drought Conditions and Impacts
Drought and Water Supply
- Currently, drought only remains in Nevada, according to the U.S. Drought Monitor. This is a significant change from February 2025, when almost 60% of California-Nevada was in drought.
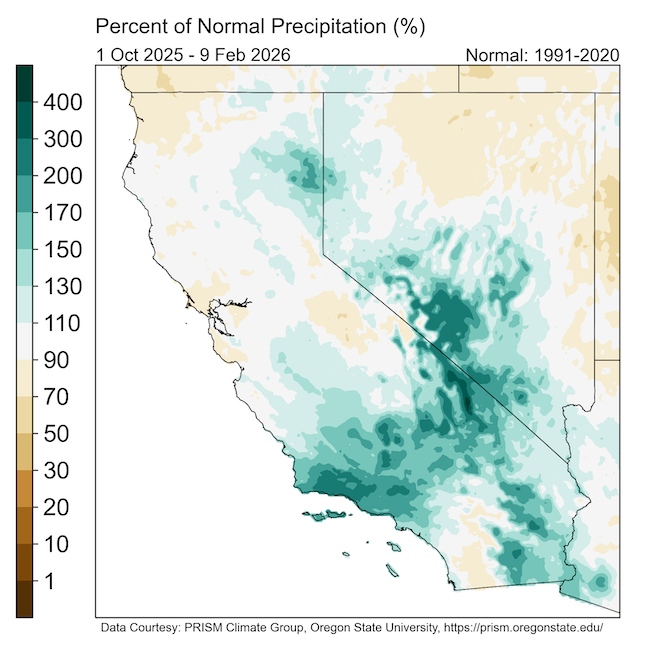
- Much of the region received 70–130% of normal precipitation since the beginning of the water year. Parts of central California and western Nevada received more than 150% of normal.
- On January 29, 2026, the California Department of Water Resources increased the State Water Project allocation to 30% of requested supplies.
- Major California water supply reservoirs remain near or above their historical averages. Reservoirs in almost all regions of Nevada are generally below where they were this time last year (except Walker Lake). However, many are still near- or above-median for this date.
- Both Lake Powell and Lake Mead are at 25% and 34% of storage capacity, respectively, and the Upper Colorado River snow water equivalent is only 36% of median peak, the lowest in a record dating back to 1986.
Snow Drought
- A dry January cut into early-season snowpack and soil moisture gains since summer 2025. For example, snow water equivalent (SWE) decreased over the past 30 days by between 1-8 inches at some of the Sierra Nevada stations (resulting in a 20% decrease in California statewide SWE normal by date since the start of the new year) and up to 2 inches in other areas of Nevada.
- Snow drought conditions are more severe in central and northern Nevada compared to California, with many locations reporting record low SWE. Warm temperatures along with dry mid winter conditions were contributing factors. The Humboldt Basin, which provides surface water for major agricultural areas, is currently reporting record low SWE at 32% of median.
- This week, a weak atmospheric river (AR) brought low-elevation rainfall and high-terrain snowfall to California. Multiple storms are forecast to bring additional precipitation to the region this weekend into next week.
Water Year Precipitation Is Near Normal for Much of California and Nevada
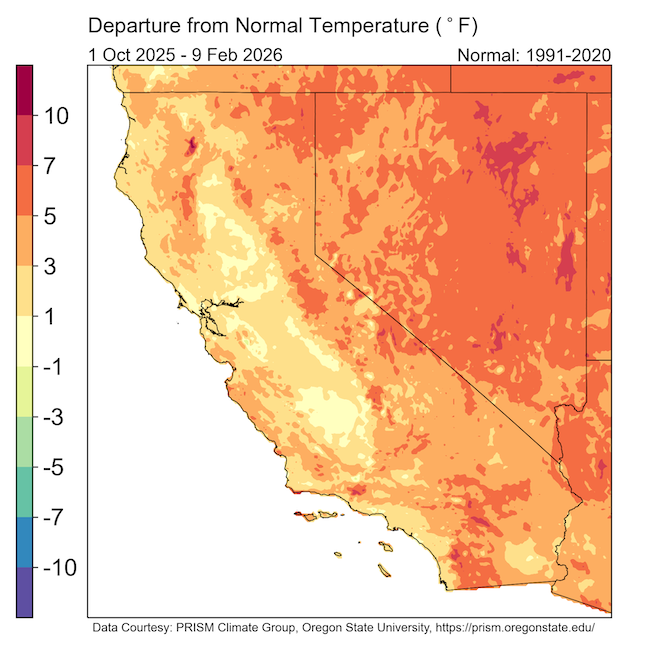
Warm Temperatures Since October Contributed to Snow Drought
Dry Mid-Winter Conditions Also Contributed to Snow Drought
Outlooks and Potential Impacts for California-Nevada
- National Weather Service Climate Prediction Center’s (CPC’s) extended range forecasts over the next two weeks favor above-normal precipitation with cooler than normal temperatures, before shifting to equal chances of above, below, and normal conditions through early March.
- There is potential inches of rain over the next 10 days across the region as well as feet of snow in the Sierra Nevada. Snow is also forecasted for Nevada. Visit your local National Weather Service office for more detail.
- A transition from La Niña to El Niño–Southern Oscillation (ENSO) neutral conditions is expected in February-April 2026 (60% chance), with ENSO-neutral likely persisting through the Northern Hemisphere summer. NOAA’s Climate Prediction Center (CPC) recently shifted to use the Relative Oceanic Niño Index (RONI) to better designate past events and predict future ENSO.
- Lingering drought in Nevada is forecast to persist over the next one to three months. Significant wildland fire potential remains normal through Spring.
Forecasts Over the Next 10 Days Show Widespread Coastal Precipitation
Resources
- Explore regional and state drought information:
- NIDIS and partners are piloting a series of Southern California Sector-Specific Drought Early Warning Outlooks in Water Year 2025–2026. Learn more and get involved by contacting Amanda Sheffield (amanda.sheffield@noaa.gov).
- Don't forget to save the date for the next bi-monthly webinar on March 23, 2026 at 11 a.m. PT, which will provide an overview of climate and drought conditions, impacts, and outlooks.
Prepared By
Amanda Sheffield
California-Nevada DEWS Regional Drought Information Coordinator
Cooperative Institute for Research in Environmental Sciences (CIRES), University of Colorado Boulder
NOAA’s National Integrated Drought Information System
Julie Kalansky
Principal Investigator
California-Nevada Adaptation Program (a NOAA CAP/RISA team)
This Drought Status Update is issued in partnership between the National Oceanic and Atmospheric Administration (NOAA), the California-Nevada Adaptation Program (a NOAA CAP team), and the Western Regional Climate Center at the Desert Research Institute to communicate a potential area of concern for drought expansion and/or development within the California-Nevada DEWS region based on recent conditions and the upcoming forecast. NIDIS and its partners will issue future Drought Status Updates as conditions evolve. NIDIS is an interagency program within the Climate Program Office, which is part of NOAA's Office of Oceanic and Atmospheric Research.


