Dry Wells in Western New York; Groundwater Deficits on the Vineyard and Nantucket
Key Points:
- Lake effect snow and other precipitation events in the last week have taken the edge off the drought in western New York, with some relief to streamflows in the counties adjacent to Lake Erie. The hardest hit counties did not get enough precipitation to make up their months-long deficits.
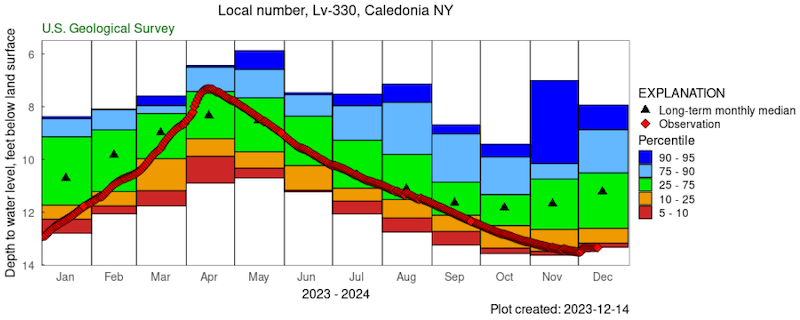
- Groundwater levels have been trending down in much of western New York since this spring. With short term forecasts predicting daytime highs in the 40s, unfrozen ground may allow for some recharge over the next week or so.
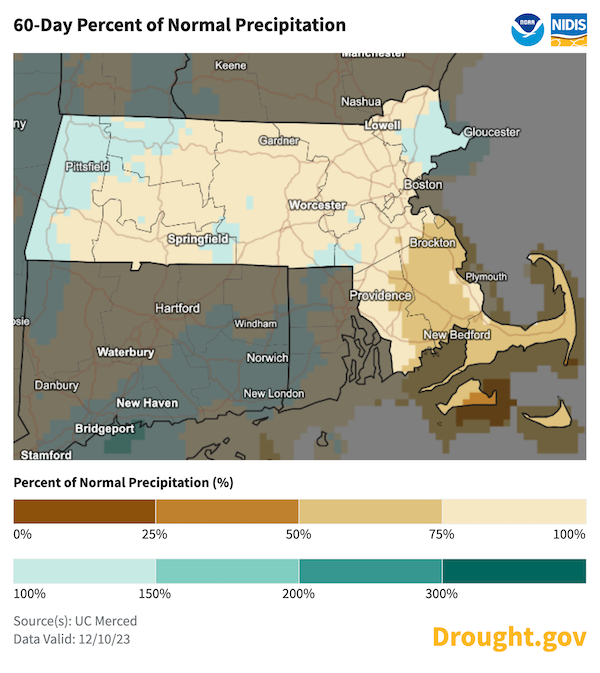
- Prior to this week’s precipitation, the Massachusetts Cape and Islands—as well as the South Fork of Long Island—were experiencing 60-day rainfall departures in the 3 to 6 inch range. Groundwater levels have become a concern and dryness is expected to continue if these locations are missed by a coastal storm approaching for the later part of this weekend.
- Abnormally Dry (D0) conditions in northern New York state shrank in coverage this week but were not completely eliminated. Some Abnormal Dryness (D0) remains along the shores of the St. Lawrence River in Jefferson and St. Lawrence counties.
Current U.S. Drought Monitor map for the Northeast Drought Early Warning System (DEWS) with data valid for December 12, 2023. The U.S. Drought Monitor is updated each Thursday to show the location and intensity of drought across the country.
According to the latest U.S. Drought Monitor:
- 7.8% of the Northeast DEWS is experiencing Abnormally Dry (D0) conditions
- 2.4% of the Northeast is in drought (D1–D2).
U.S. Drought Monitor Categories
Abnormally Dry (D0)
Abnormally Dry (D0) indicates a region that is going into or coming out of drought. View typical impacts by state.
Moderate Drought (D1)
Moderate Drought (D1) is the first of four drought categories (D1–D4), according to the U.S. Drought Monitor. View typical impacts by state.
Severe Drought (D2)
Severe Drought (D2) is the second of four drought categories (D1–D4), according to the U.S. Drought Monitor. View typical impacts by state.
Extreme Drought (D3)
Extreme Drought (D3) is the third of four drought categories (D1–D4), according to the U.S. Drought Monitor. View typical impacts by state.
Exceptional Drought (D4)
Exceptional Drought (D4) is the most intense drought category, according to the U.S. Drought Monitor. View typical impacts by state.
Current U.S. Drought Monitor map for the Northeast Drought Early Warning System (DEWS) with data valid for December 12, 2023. The U.S. Drought Monitor is updated each Thursday to show the location and intensity of drought across the country.
According to the latest U.S. Drought Monitor:
- 7.8% of the Northeast DEWS is experiencing Abnormally Dry (D0) conditions
- 2.4% of the Northeast is in drought (D1–D2).
The U.S. Drought Monitor is released weekly on Thursday mornings, with data valid through 7 a.m. ET the previous Tuesday.
Current Conditions for the Northeast
U.S. Drought Monitor: A Look Back at 2023
This full-year animation of Northeast U.S. Drought Monitor conditions illustrates dryness and drought (including some isolated Severe Drought) impacting almost all areas in the region at some time during 2023. The most extensive geographic coverage of dryness occurred during the summer months. Rainfall deficits building since the spring in western New York exacerbated the water crisis experienced by several counties west of the Finger Lakes this fall. Significant rain events over the summer generally kept dryness in check throughout New England, but some areas did miss out on significant replenishment of surface and groundwater. Recent impacts, including dry wells in western New York and low groundwater levels for the Massachusetts Islands, came as a result of these missed precipitation opportunities.
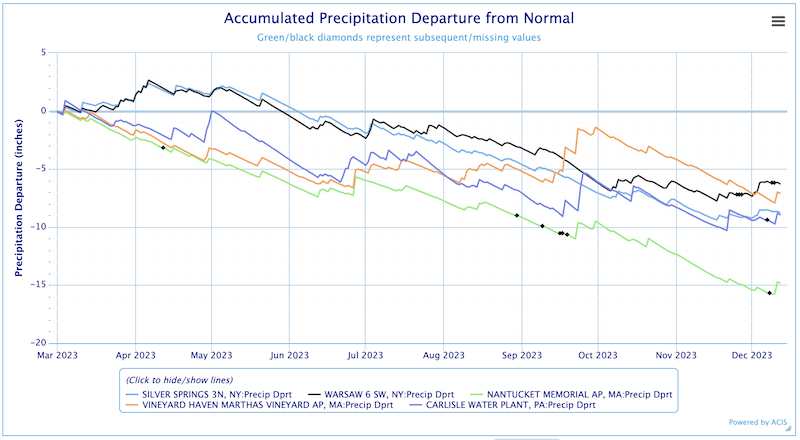
Accumulated Precipitation Departure from Normal
Deficits tracked at 5 locations in or near western New York State (3) and the Massachusetts Islands (2) reflect the progression of dryness and drought in these areas. (Black dots indicate missing data.)
The National Weather Service's Buffalo Weather Forecast Office issued a Drought Information Statement on the November 30 and will update that statement on December 15 or as needed. View all active Drought Information Statements.
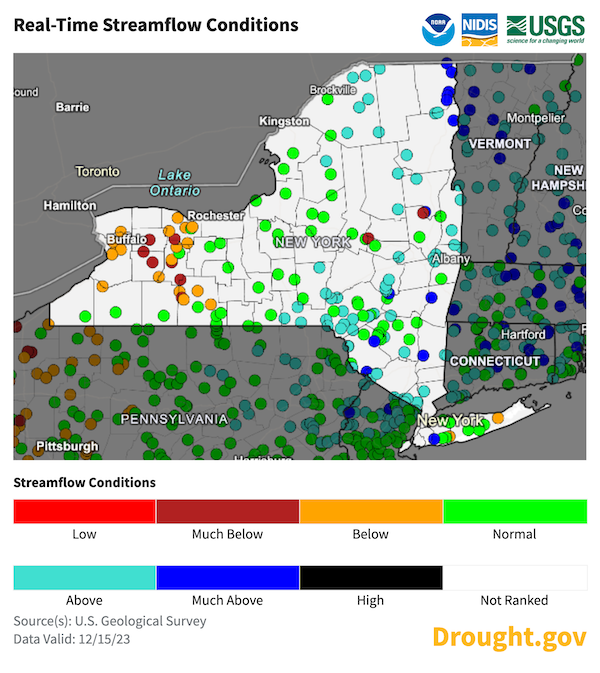
Real-Time Streamflow Conditions for New York
According to the U.S. Geological Survey, some real-time streamflows in western New York are still below normal.
Groundwater Levels in Western New York
60-Day Percent of Normal Precipitation for Massachusetts
This map highlights precipitation deficits experienced across the Massachusetts Islands over the last 60 days.
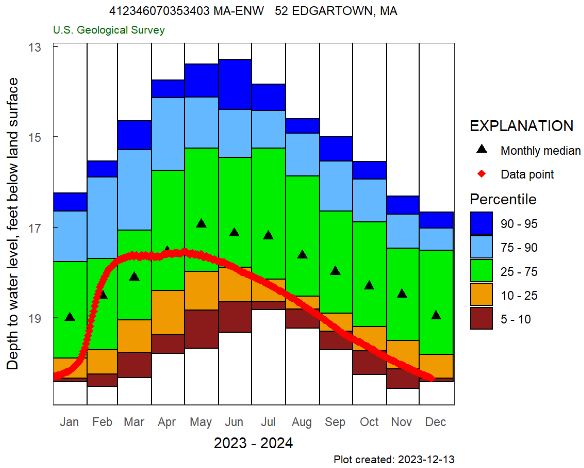
Groundwater Levels in the Massachusetts Islands
According to the U.S. Geological Survey (USGS), groundwater levels are much below normal on the Massachusetts Islands, including USGS sites at Edgartown (below) and Nantucket.
Drought Impacts in the Northeast
- 100 out of 665 homes in Bethany, New York did not have water during the Thanksgiving holiday. In mid- to late November, Genesee County authorities worked hard to schedule water truck deliveries for families whose wells went dry. Dairy farms and local businesses were trucking in water as well.
- A December 10 Condition Monitoring Observer Report (CMOR) from Erie County, New York reported, “With recent precipitation, Lake Erie tributaries are finally at near normal to normal levels, with angler reports of appreciable runs of Steelhead.”
- Recent Community Collaborative Rain, Hail, and Snow Network (CoCoRaHS) observations note ongoing drought impacts in Wyoming and Livingston Counties. (Thanks to Kirk Apffel, NWS Buffalo Weather Forecast Office, and Samantha Borisoff, Northeast Regional Climate Center.)
- From Wyoming County, New York: "Area ponds [are] still nearly empty however soil [is] starting to soften with recent rain.. my pond is very low 10 + feet down...some lower elevation ponds are starting to show recovery .. area fire [departments] use dry hydrants to access pond water...some area farmers are having to haul water for their cows...my garden did very poorly this year due to episodes of heat and lack of water...humidity has been low. My well is holding water quality seems OK."
- From Mount Morris, New York: "We are renovating our well this upcoming week. We lost water three weeks ago and then it came back. We have been very conservative with our water. A farmer near us had his well go dry and has been getting water from other sources for his livestock."
Consider reporting and sharing your local drought impacts to help inform the U.S. Drought Monitor authors, our neighbors, and drought mitigation response agencies.
View an interactive map of CMOR reports. See what your county is reporting and add to the impact dataset.
Looking Ahead: Outlooks for the Northeast
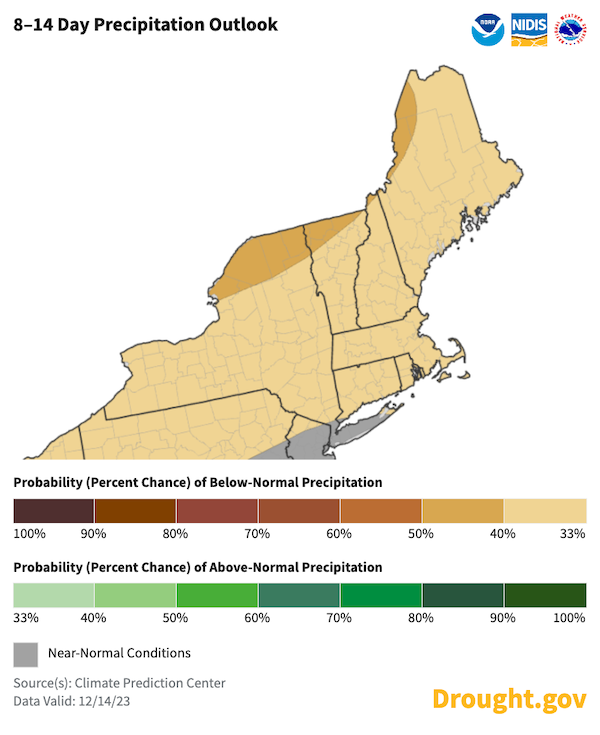
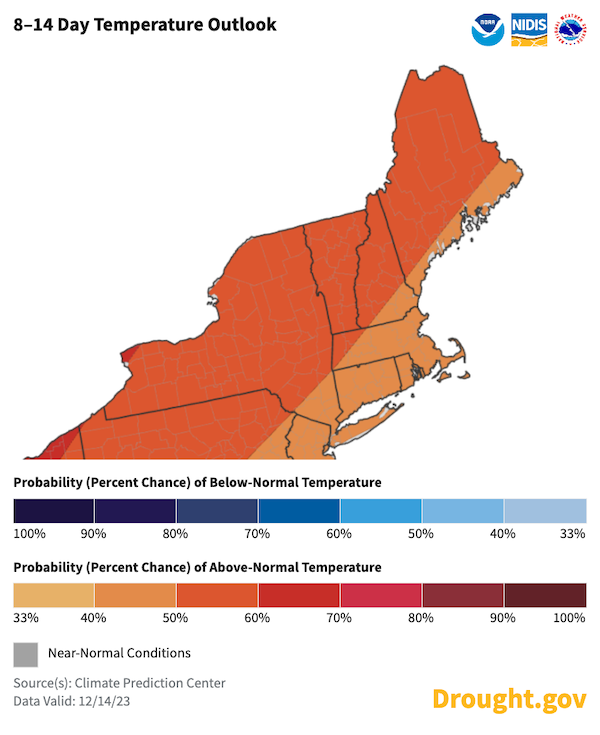
8–14 Day Precipitation & Temperature Outlooks
In the next two weeks, the National Weather Service Climate Prediction Center's outlooks suggest greater chances for below-normal precipitation across the Northeast.
All of the Northeast region will see increased chances for above-normal temperatures from December 22–28.
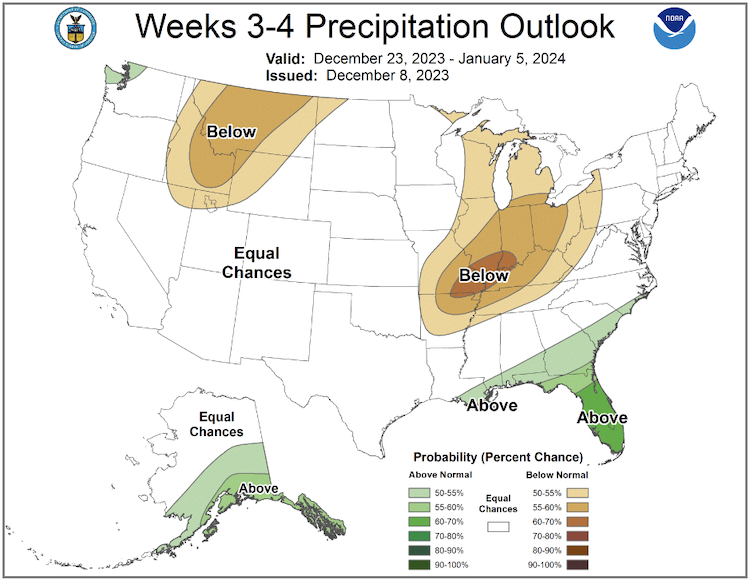
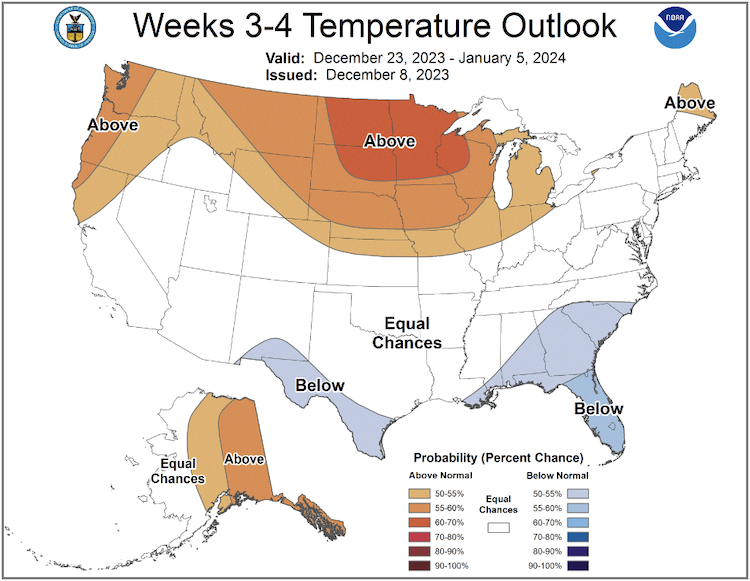
Week 3–4 Precipitation & Temperature Outlooks
Through the first week of 2024, there are equal chances for above- below-, or near-normal precipitation, except in the westernmost counties of New York, where slightly increased chances for below-normal precipitation exist.
Through the first week of 2024, above-normal temperatures are favored for the northern third of Maine. The rest of the region should see equal chances for above-, below-, or near-normal temperatures.
What We Are Watching
The Susquehanna River Basin Commission is tracking low streamflow conditions in Bradford and Tioga counties. Shale drilling operations were impacted by restrictions to water access.
- The New York State Department of Environmental Conservation announced regional workgroups to facilitate implementation of New York's 2023 Great Lakes Action Agenda.
Featured Resources
- Drought Assessment in a Changing Climate: Priority Actions and Research Needs
- Fifth National Climate Assessment (NCA5)
- NCA5: Drought and Climate Change in 10 Maps
- A recording is now available for the University of Nebraska Medical Center’s Drought and Public Health Roadmap Webinar.
- Dry Times: View the December 13 edition of NIDIS's bi-weekly drought newsletter, featuring articles on ENSO and the USGS Flow Photo Explorer.
- The National Weather Service's Buffalo Weather Forecast Office issued a Drought Information Statement on the November 30 and will update that statement on December 15 or as needed. View all active Drought Information Statements.
- From the National Drought Mitigation Center, view the latest Dry Horizons newsletter, as well as the November drought impact and climate summaries.
In the News: State-Reported Impacts
Massachusetts
November 26, 2023: The Berkshire Eagle – Christmas Trees Hit Harder by Excess Water Than Drought This Year
New York
December 12, 2023: The Daily News – Construction on New Drinking Water Supply System May Begin in August
December 12, 2023: The Daily News – Governor Announces Funding for New Water Infrastructure in Drought Impacted Counties
December 11, 2023: FingerLakes1.com – Western New York Drought
December 9, 2023: The Batavian – Genesee County Drought Conditions (Dr. Shaw’s Dry Well Survey was supported by NIDIS.)
December 2, 2023: The Daily News – Town of Pembroke Filling Approved Water Containers
December 1, 2023: WKBW ABC7 – Dairy Farm Drought Impacts Felt Since May 2023
December 1, 2023: The Daily News – Donations of Bottled Water For Bethany
November 28, 2023: WIVB.com – Local Solutions for Drought Impacts in Bethany
November 27, 2023: ABC7 WKBW – State Emergency Management Sends Potable Water Truck to Bethany
November 25, 2023: NBC2 WGRZ – Water Trucked in for Residents of Genesee County
November 22, 2023: The Batavian – Water Trucked in for Bethany Residents
November 21, 2023: NYS DEC – Prescribed Burns and Wildfire Activity In Allegany, Cattaraugus, Dutchess, and Albany Counties
November 18, 2023: The Daily News - Wells Run Dry in Western New York State
Vermont
December 5, 2023: WCAX 3 – Lawmakers Focus on Flood Resilience but Acknowledge Drought and Wildfire
Northeast U.S.
December 5, 2023: CNN – Where’s the Snow?
Additional Resources
- Look back at previous Northeast DEWS Drought Status Updates.
- Northeast Drought Early Warning System Dashboard.
- Sign up for NIDIS emails on our email sign up form.
- Your local National Weather Service office.
- NOAA Regional Climate Services Monthly Webinar Series (next webinar is January 30).
- USDA Northeast Climate Hub.
- USGS New England and New York Water Science Centers.
- Explore drought information for your state:
- Connecticut Drought Information Center
- Maine Drought Task Force
- Massachusetts Drought Management Task Force
- New Hampshire Department of Environmental Services: Drought
- New York State Department of Environmental Conservation (DEC): Drought
- Rhode Island Water Resources Board: Drought Management Program
- Vermont Agency of Natural Resources, Department of Environmental Conservation: Drought and Other Hazards
Prepared By
Sylvia Reeves
NOAA/National Integrated Drought Information System (NIDIS), CU Boulder/Cooperative Institute for Research in Environmental Sciences (CIRES)
Samantha Borisoff, Jessica Spaccio, Keith Eggleston, Art DeGaetano
Northeast Regional Climate Center
Ellen L. Mecray
Regional Climate Services Director, Eastern Region, NOAA
Gardner Bent
USGS New England Water Science Center
In partnership with National Weather Service Offices of the Northeast and State Climate Offices of the Northeast.
This drought status update is issued in partnership between the National Oceanic and Atmospheric Administration (NOAA), U.S. Geological Survey, and the U.S. Department of Agriculture (USDA) to communicate concern for drought expansion and intensification within the Northeast U.S. based on recent conditions and the forecasts and outlooks. NIDIS and its partners will issue future drought status updates as conditions evolve.
