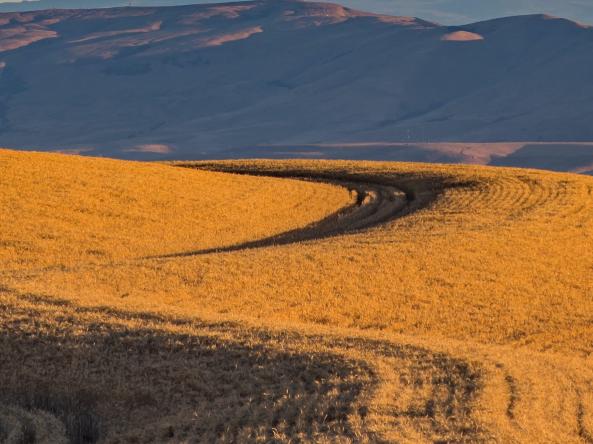
Rains Provide Temporary Relief, but Drought Persists into the Fall Across the Region
Key Points
- 93.4% of the Pacific Northwest Drought Early Warning System (DEWS) region is in drought, with 57.5% experiencing Extreme (D3) or Exceptional (D4) Drought conditions. This represents small improvements in portions of the Northwest across each of the drought categories, focused mostly west of the Cascade Mountains and not in some of the hardest hit areas.
- As of September 23, 2021 there are 33 large fires burning across the Northwest (Idaho, 20; Washington, 7; Oregon, 6) totaling 850,900 acres of active fire, though most of the large fires and complexes in the Northwest have displayed minimal fire activity due to recent rain throughout the areas (NIFC).
- The official October-November-December outlook (Figure 7) from the Climate Prediction Center shows an equal chance of above-normal, below-normal, or near-normal temperatures for the region, except for southeast Oregon and southern Idaho, which have higher chances of above-normal temperatures.
- Southeast Oregon and southern Idaho also have equal chances of above-normal, below-normal, or near-normal precipitation, while the rest of the Northwest has increased chances of above-normal precipitation (Figure 8).
- Short of a robust snowpack, the Northwest is likely to experience lingering moisture deficits into next summer.
Current U.S. Drought Monitor map for the Pacific Northwest, as of September 21, 2021. The U.S. Drought Monitor (USDM) is updated each Thursday to show the location and intensity of drought across the country. Drought categories show experts’ assessments of conditions related to dryness and drought including observations of how much water is available in streams, lakes, and soils compared to usual for the same time of year
U.S. Drought Monitor Categories
Current U.S. Drought Monitor map for the Pacific Northwest, as of September 21, 2021. The U.S. Drought Monitor (USDM) is updated each Thursday to show the location and intensity of drought across the country. Drought categories show experts’ assessments of conditions related to dryness and drought including observations of how much water is available in streams, lakes, and soils compared to usual for the same time of year
Current Conditions
- 93.4% of the Pacific Northwest DEWS region is in drought, with 57.5% experiencing Extreme (D3) or Exceptional (D4) Drought conditions. This represents small improvements in portions of the Northwest across each of the drought categories focused mostly west of the Cascade Mountains and not in some of the hardest hit areas. The 4-week class change map (Figure 1) from the U.S. Drought Monitor indicates where improvements are happening (west of the Cascades in northwest Washington, along the Oregon-Washington border, and just south and in northeast Washington and the northern Idaho panhandle), but that there has also been further degradation (especially in southern Idaho).
- Recent rains across the region have brought some temporary relief with some improvement to surface soil moisture and streamflow in western Oregon and Washington. The precipitation was especially helpful where it fell on active wildfires. While the northern and central Cascade Mountains saw some benefit, the southern Cascades and areas east did not see much relief.
- March through August precipitation for the majority of the region ranked as the record driest, with areas of “much below” or “below normal” precipitation rankings compared to the period from 1979–2015 (Figure 2; Climate Toolbox).
- The summer of 2021 in the Pacific Northwest featured much-above-normal temperatures across nearly the entire region. Northwest Washington and parts of southern and southeastern Idaho were slightly cooler relative to normal, but still had above-normal temperatures compared to the period of1979–2015 (Figure 3; Climate Toolbox). Oregon and Idaho recorded their warmest June–August on record (since 1895) while Washington recorded its second warmest June–August on record.
- Storage volumes in the U.S. Bureau of Reclamation (including the Klamath Basin) and U.S. Army Corps of Engineers reservoir systems continue to measure well below average throughout Oregon. According to the U.S. Department of Agriculture’s National Water and Climate Center, reservoir storage in Montana and Washington is at or above average. However, as of the end of August 2021, reservoir storage in Oregon measured 17% of capacity, less than half its historical average capacity of 47%. Idaho reported reservoir storage at 34% of capacity, lower than its historical average capacity of 51%. In March and April of 2021, hydropower generation in both Washington and Oregon was 10% below the 10-year (2011–2020) range. Over the summer, hydropower generation in these states moved back within the 10-year range (U.S. Energy Information Administration).
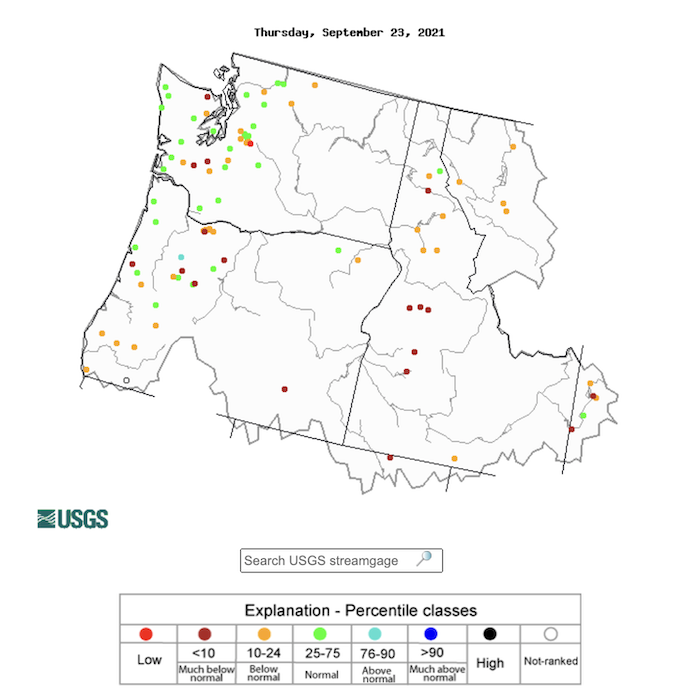
- Many streamflow gages across the region are still showing below, much below, or record low levels with a few exceptions in western Washington and Oregon that are showing normal flows due to recent rains. (Figure 4).
Figure 1. U.S. Drought Monitor 4-Week Change Map
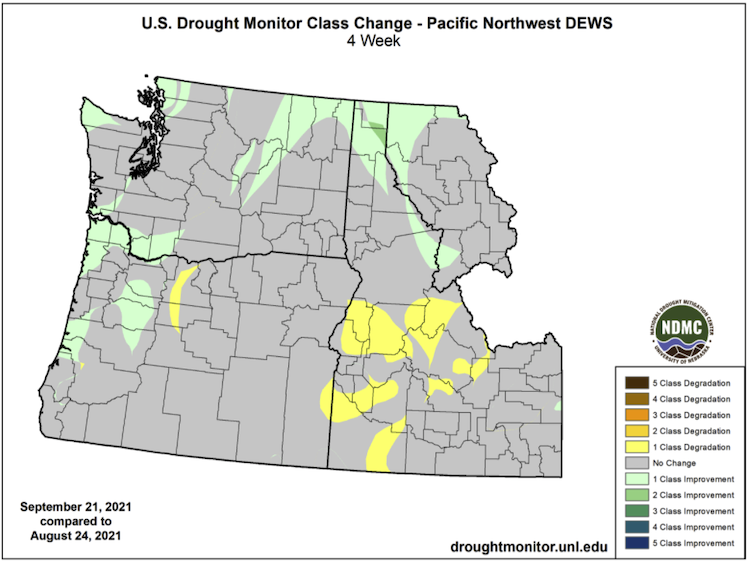
Figure 2. March–August Precipitation Percentile Rankings
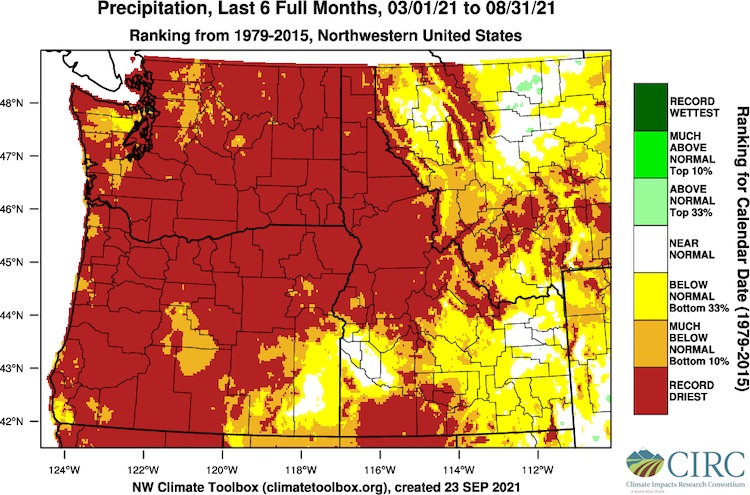
Figure 3. March–August Temperature Percentile Rankings
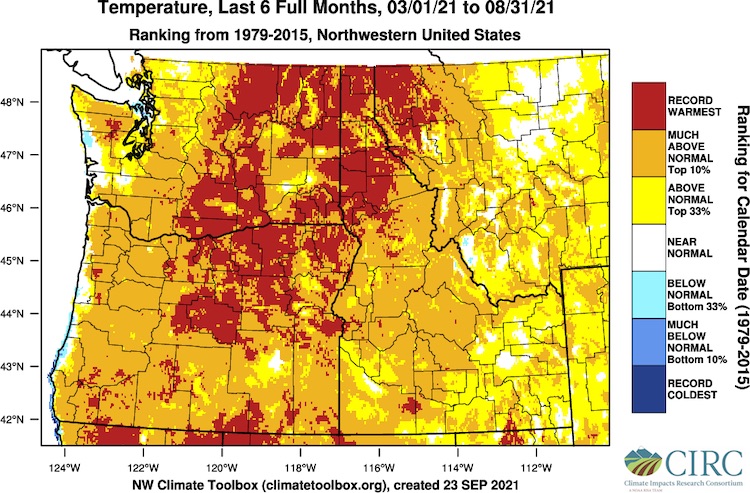
Figure 4. 28-Day Average Streamflow for HCDN Sites
Drought Impacts
- Thus far in 2021, 25 Oregon counties have received Executive Orders issuing drought declarations. Twenty counties in Idaho have drought declarations as of September 24, 2021. The Washington Department of Ecology issued a drought declaration (July 14, 2021) nearly statewide except for portions of Snohomish, King, and Pierce counties that include Everett, Seattle, and Tacoma.
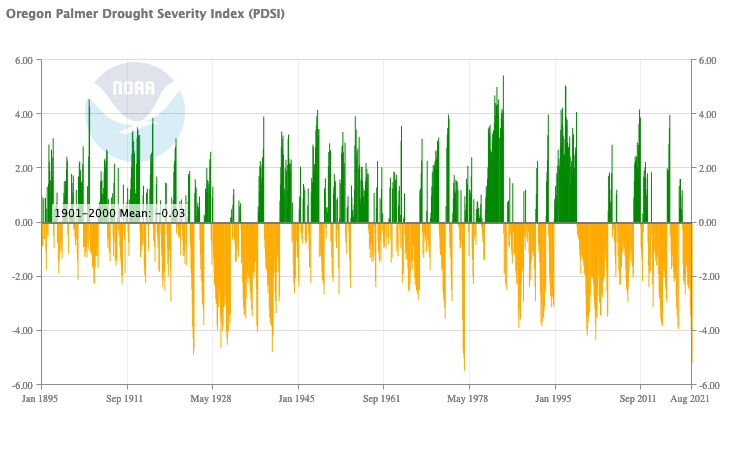
- Recent rains have resulted in some improvements to surface soil moisture, but shallow groundwater is still in the driest 10th percentile or lower across most of the region (Figure 5), and the Palmer Drought Severity Index (PDSI) is also showing very dry conditions (Figure 6; for Oregon). For Oregon, PDSI was -5.19 for August 2021, which is the second lowest monthly value on record, just behind April 1977, out of 1,520 months and consistent with the exceptional drought category. Washington state was -3.95, which is the 30th lowest monthly value on record, consistent with the severe drought category, and for Idaho the PDSI was -4.64 for August 2021, which is the 14th lowest monthly value on record, consistent with the extreme drought category.
- The National Interagency Fire Center has dropped the National Preparedness Level to PL4 (on a scale of PL1 to PL5, with PL5 representing maximum stress on national wildfire fighting assets). 2021 brought the longest period at PL5 since 1990 (July 14–September 20, 2021) and the longest period at PL4+ (95 days as of September 23, 2021). As of September 23, 2021 there are 33 large fires burning across the Northwest (Idaho, 20; Washington, 7; Oregon, 6) totaling 850,900 acres of active fire, though most of the large fires and complexes in the Northwest have displayed minimal fire activity due to recent rain throughout the areas (NIFC).
- Rangeland and pasture conditions have improved across Idaho and in well-managed pastures in Oregon, but overall large percentages of pasture and rangeland across the regions still are in “poor” to “very poor” conditions—91% for Washington, 86% for Oregon, and 55% for Idaho as of September 19, 2021. Harvest continues across the region. In Oregon, potatoes were impacted moderately to severely by dry weather, and onions were smaller than average (USDA National Agricultural Statistics Service). Other crops that have been impacted include lentils, chickpeas, and hops as well as grass, alfalfa, and carrot crops for seed.
- Impacts continue to be felt on water supply from wells, especially in Oregon, where the Oregon Water Resources Department is asking landowners and residents who are dependent on wells for water to report their dry wells or significant reduction in well output.
- Wildlife impacts include an increase in the number of white-tailed deer across the three states that are dying of viruses, including bluetongue and epizootic hemorrhagic disease (EHD), that become more prevalent during hot summers and droughts (Washington and Oregon Departments of Fish and Wildlife). The mortality has resulted in hunting closures in some areas.
- Drying ponds and streams impact endangered western pond turtles, and low streamflows and increased water temperatures have impacted fish spawning and fishing regulations. On September 1, 2021, the Oregon Department of Fish and Wildlife closed steelhead fishing in the lower Umatilla and in additional areas of the Deschutes and John Day Rivers after extremely low returns of the Columbia Basin upriver summer steelhead. Passage counts of summer steelhead at Bonneville Dam from July 1 through August 26 were the lowest since counts started in 1938. This followed earlier closures on the Snake River in Washington. Washington, Oregon, and Idaho fishery managers are coordinating to ensure regulations are concurrent in areas of shared jurisdiction.
- The combination of drought and warmer-than-normal temperatures, especially heat waves early in the growing season, has likely impacted forests, although the extent of mortality (versus, for example, limited growth) is unclear. The Oregon Department of Forestry is looking for the public’s help in understanding those impacts. Access the survey here to submit your observations. Observations from Washington and Idaho are also welcome.
Figure 5. NASA GRACE-Based Shallow Groundwater Drought Indicator
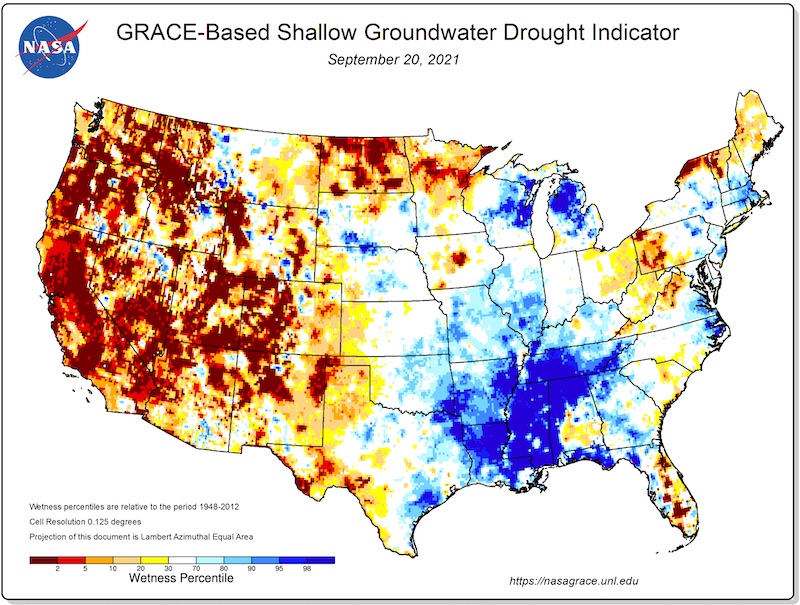
Figure 6. Oregon Palmer Drought Severity Index
If you are seeing additional impacts or different impacts of the drought where you live, please let us know!
Outlook and Potential Impacts
- The official October-November-December outlook (Figure 7) from the Climate Prediction Center shows an equal chance of above-normal, below-normal, or near-normal temperatures for the region, except for southeast Oregon and southern Idaho, which have higher chances of above-normal temperatures. Southeast Oregon and southern Idaho also have equal chances of above-normal, below-normal, or near-normal precipitation, while the rest of the Northwest has increased chances of above-normal precipitation (Figure 8).
- The Significant Wildland Fire Potential Outlook shows normal wildfire potential from October through December for the region, though there is still above-normal potential for southwest Idaho and a band stretching diagonally from southwest Oregon to central Washington for the remainder of September.
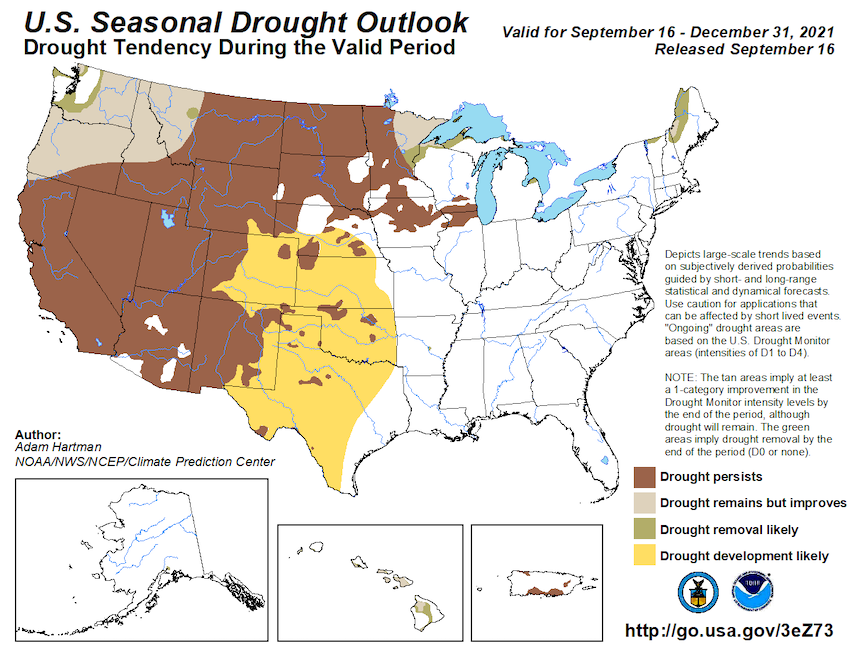
- The Climate Prediction Center's Seasonal Drought Outlook (Figure 9) follows a pattern similar to the seasonal temperature and precipitation outlooks, with drought persisting in southeast Oregon and southern Idaho and drought remaining but improving across the rest of the region.
- The Climate Prediction Center's El Niño Southern Oscillation (ENSO) Alert System indicates that a transition from ENSO-neutral to La Niña is favored in the next couple of months, with a 70%–80% chance of La Niña during the Northern Hemisphere winter 2021–22. Currently, this is projected to be categorized as a weak La Niña. The emergence of La Niña in the Fall has, on average, historically led to a wetter-than-normal winter, although there are regional differences in this pattern that may not benefit some of the areas most impacted by drought. Short of a robust snowpack, the Northwest is likely to experience lingering moisture deficits into next summer.
- Carryover in many systems is expected to be low heading into the next water year (October 1, 2021–September 30, 2022). Overall water supply conditions are very low across Idaho, with reservoirs still being rapidly depleted of storage water. Carryover will be average in all reservoirs, with little or no carryover in the Boise River, Mountain Home, Owyhee River, Big Wood, Little Wood, Big Lost, Oakley, and Salmon Falls reservoir systems. Only Bear Lake is likely to have close to a full allocation in storage for next year at the end of the season, because Bear Lake has storage capacity for multiple years. Conditions are similar in many reservoir systems throughout Oregon, with little to no carryover expected in the Rogue, Deschutes, and southeastern Oregon systems. Continued impacts to hydropower production are expected into next year.
- For long-lived plants in forests, tree farms, and ornamental plants, the full impacts of the prolonged drought have yet to be realized. Reports of impacts will continue to come in, and we can expect increases in tree diseases and mortality due to this prolonged and extreme drought.
- The National Weather Service has noted that current deficits would require 6 to 9 inches of new rainfall for western Oregon and Washington to cut away at the drought, and 12 to 15 inches of new rain for northern central Oregon. The Washington Department of Ecology noted that according to NOAA's National Centers for Environmental Information, the lower Columbia River area would need approximately 11 inches of rain by next April. The odds of that kind of rebound for full recovery are low given the climatology of the region—the odds for significantly ameliorating current conditions are about one in five across eastern Washington and about 1 in 20 for full recovery in eastern Washington.
- Winter wheat harvest next year may be impacted as planting is behind schedule in Oregon, and germination across the region will be dependent on precipitation during the early Fall.
- Ranchers continued to be impacted by a lack of feed and water, with cattle being brought in off rangeland in August and September versus November. With reduced herds, beef prices could also be affected in the longer term.
Figure 7. October–December Temperature Outlook
Figure 8. October–December Precipitation Outlook
Figure 9. Seasonal Drought Outlook
Upcoming Events
Oregon-Washington Water Year Meeting: The 16th annual Oregon-Washington Water Year Meeting: 2021 Recap and 2022 Outlook will be held as two virtual morning meetings on November 16 and 17, 2021. The goal of this meeting is to share and gather information regarding climate impacts of the 2021 water year, with a focus on the exceptional drought that was so widespread across the region. This meeting will also offer the opportunity to learn from others about mitigation actions that were taken. Both days will include time for discussion and peer-to-peer learning, in addition to hearing from the forecast experts. Please register here.
Annual Idaho Fall Water Supply Meeting: The Idaho Fall Water Supply Outlook is an annual meeting held each year to recap the water supply from the previous water year and provide climate and water supply outlook information for the coming water year. This year the event will be held on a virtual platform on November 19, 2021 from 9 a.m.–1:30 p.m. MT due to the current pandemic. Please register here.
There will also be an opportunity to take part in a year-end survey of drought impacts that will be presented at the Water Year Meeting. Both the survey and the workshops will help inform an annual Pacific Northwest Water Year Impacts Assessment.
For More Information
- NIDIS and its partners will issue future updates as conditions evolve.
- More local information is available from the following resources:
- For additional regional drought and wildfire resource information, see the 2021 Pacific Northwest Drought Resources.
- Register for the next Pacific Northwest Drought Early Warning System Webinar on October 25 at 11 a.m. PDT.
- Federal drought declarations are available from the U.S. Department of Agriculture's Farm Service Agency.
Prepared By
Britt Parker
NOAA National Integrated Drought Information System, CIRES
Karin Bumbaco
Office of the Washington State Climatologist
David Hoekema
Idaho Department of Water Resources
Ryan Andrews
Oregon Department of Water Resources
Larry O’Neill
Oregon Climate Service
Scott Oviatt
USDA Natural Resources Conservation Service
Holly Prendeville
USDA Northwest Climate Hub
This drought status update is issued in partnership with the states of Oregon, Washington, and Idaho, the USDA Northwest Climate Hub, the USDA Natural Resources Conservation Service, and the Oregon Climate Change Research Institute to communicate a potential area of concern for drought expansion and/or development within the Pacific Northwest based on recent conditions and the upcoming forecast. NIDIS and its partners will issue future drought status updates as conditions evolve.