Drought Improved for Most of the Southeast, But Long-Term Drought Impacts Persist in North Carolina and South Florida
Key Points
- Abnormal Dryness (D0) and drought (D1–D4) conditions remain across much of the Southeast, according to the U.S. Drought Monitor. Severe Drought conditions or worse (D2-D4) persist mostly in the Carolinas and Florida.
- North-central North Carolina is the only area experiencing Exceptional Drought (D4) conditions, which hasn’t occurred in this part of North Carolina since March 2008.
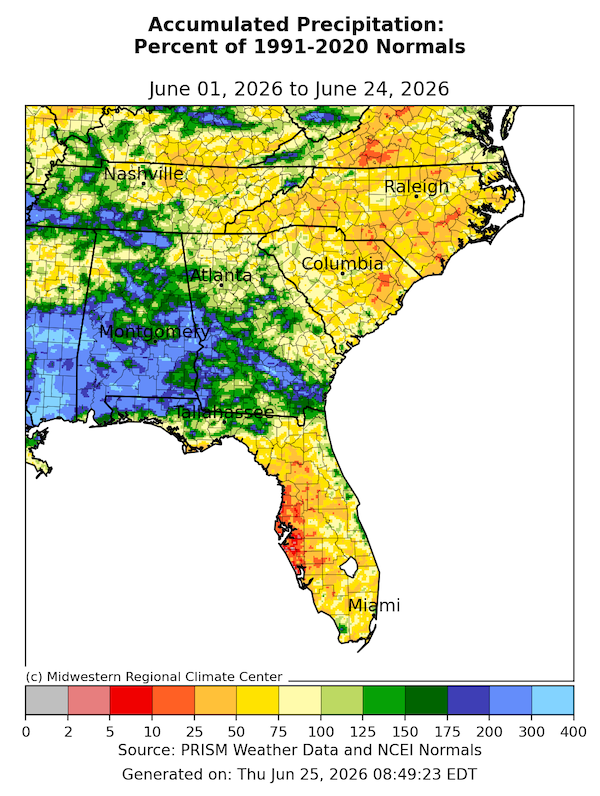
- A wetter pattern arrived in May, providing much of the region well-above-normal rainfall. This improved soil moisture and streamflows and reduced fire potential for most of the region. Portions of Alabama, Florida, Georgia, and South Carolina received over 175% of normal precipitation for the month of May.
- Since June 1, precipitation has been mixed for the region. Alabama, Georgia, and portions of north Florida have received above-normal rainfall, while most of Florida, the Carolinas, and Tennessee have received below-normal rainfall.
- While some areas have seen reduced drought impacts (Alabama, Georgia, and north Florida), areas with short- and long-term precipitation deficits are experiencing an increase in drought impacts. The most intense impacts are located in north-central North Carolina, where water resources are declining, and in South Florida, where hydrologic conditions are well below normal and fire potential and occurrence are elevated.
- Late June and early July are forecast to bring near-normal to below-normal precipitation and above-normal temperatures. This may cause drought expansion or intensification in areas that received below-normal rainfall over the past 30 days (i.e., the Carolinas, the Florida Peninsula, and portions of Tennessee).
- El Niño conditions have developed and are forecast to persist through winter. This is likely to produce below-normal tropical storm activity in the Atlantic Ocean, which could result in below-normal rainfall in the Southeast this fall. If this occurs, drought conditions could develop or worsen in the region.
Current drought coverage, according to the U.S. Drought Monitor (USDM), valid for June 25, 2026. The U.S. Drought Monitor depicts the location and intensity of drought across the country. The map uses 5 classifications: Abnormally Dry (D0), showing areas that may be going into or are coming out of drought, and four levels of drought (D1–D4).
The U.S. Drought Monitor is a joint effort of the National Oceanic and Atmospheric Administration, U.S. Department of Agriculture, National Aeronautics and Space Administration, and National Drought Mitigation Center.
A drought index combines multiple drought indicators (e.g., precipitation, temperature, soil moisture) to depict drought conditions. For some products, like the U.S. Drought Monitor, authors combine their analysis of drought indicators with input from local observers. Other drought indices, like the Standardized Precipitation Index (SPI), use an objective calculation to describe the severity, location, timing, and/or duration of drought.
Learn MorePeriods of drought can lead to inadequate water supply, threatening the health, safety, and welfare of communities. Streamflow, groundwater, reservoir, and snowpack data are key to monitoring and forecasting water supply.
Learn MoreDrought can reduce the water availability and water quality necessary for productive farms, ranches, and grazing lands, resulting in significant negative direct and indirect economic impacts to the agricultural sector. Monitoring agricultural drought typically focuses on examining levels of precipitation, evaporative demand, soil moisture, and surface/groundwater quantity and quality.
Learn MoreU.S. Drought Monitor Categories
D0 - Abnormally Dry
Abnormally Dry (D0) indicates a region that is going into or coming out of drought, according to the U.S. Drought Monitor.
D1 – Moderate Drought
Moderate Drought (D1) is the first of four drought categories (D1–D4), according to the U.S. Drought Monitor.
D2 – Severe Drought
Severe Drought (D2) is the second of four drought categories (D1–D4), according to the U.S. Drought Monitor.
D3 – Extreme Drought
Extreme Drought (D3) is the third of four drought categories (D1–D4), according to the U.S. Drought Monitor.
D4 – Exceptional Drought
Exceptional Drought (D4) is the most intense drought category, according to the U.S. Drought Monitor.
Total Area in Drought (D1–D4)
Percent area of the Southeast U.S. that is currently in drought (D1–D4), according to the U.S. Drought Monitor.
Current drought coverage, according to the U.S. Drought Monitor (USDM), valid for June 25, 2026. The U.S. Drought Monitor depicts the location and intensity of drought across the country. The map uses 5 classifications: Abnormally Dry (D0), showing areas that may be going into or are coming out of drought, and four levels of drought (D1–D4).
The U.S. Drought Monitor is a joint effort of the National Oceanic and Atmospheric Administration, U.S. Department of Agriculture, National Aeronautics and Space Administration, and National Drought Mitigation Center.
The U.S. Drought Monitor is released every Thursday morning, with data valid through the previous Tuesday at 8 a.m. EDT.
A drought index combines multiple drought indicators (e.g., precipitation, temperature, soil moisture) to depict drought conditions. For some products, like the U.S. Drought Monitor, authors combine their analysis of drought indicators with input from local observers. Other drought indices, like the Standardized Precipitation Index (SPI), use an objective calculation to describe the severity, location, timing, and/or duration of drought.
Learn MorePeriods of drought can lead to inadequate water supply, threatening the health, safety, and welfare of communities. Streamflow, groundwater, reservoir, and snowpack data are key to monitoring and forecasting water supply.
Learn MoreDrought can reduce the water availability and water quality necessary for productive farms, ranches, and grazing lands, resulting in significant negative direct and indirect economic impacts to the agricultural sector. Monitoring agricultural drought typically focuses on examining levels of precipitation, evaporative demand, soil moisture, and surface/groundwater quantity and quality.
Learn MoreCurrent Conditions in the Southeast
This update is based on data available as of Thursday, June 25 at 8 a.m. ET. We acknowledge that conditions are evolving.
- Drought (D1–D4) conditions still cover 59% of the Southeast, with 37% of the region in Severe to Exceptional Drought (D2-D4) conditions.
- May precipitation was above normal for much of the Southeast, improving soil moisture and streamflows and reducing wildfire potential. Portions of Alabama, Florida, Georgia, and South Carolina received over 175% of normal precipitation for the month of May.
- Since June 1, some areas of the region have experienced continual rainfall, allowing for significant drought improvement, particularly Alabama, Georgia, the Florida Panhandle, and portions of Tennessee. Unfortunately, other portions of the region (i.e. North Carolina and the Florida Peninsula) have experienced drier conditions this month, allowing for further drought impacts to occur.
- North Carolina experienced its second driest January-May on record (since 1895), and June to date precipitation is below normal. As a result, the state is experiencing impacts to agriculture and water resources.
- Agricultural impacts: Extension agents report areas that did not receive adequate rainfall in late May are experiencing crop stress, particularly for soybeans. Pastures and hayfields have struggled since fall 2025 due to long-term dryness. With 53% of pastures rated in poor or very poor condition in the June 21 USDA Crop Progress Report, concerns about forage shortages have increased statewide.
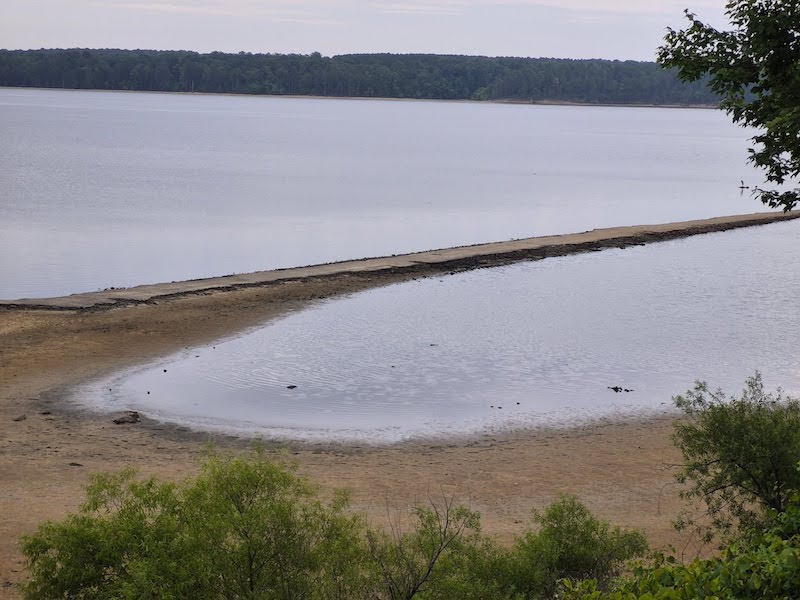
- Water resource impacts: In the Triangle Region of North Carolina, water levels are low. Falls Lake and Jordan Lake are both below target storage. Water systems in the Catawba, Neuse, and Cape Fear basins have all enacted mandatory water conservation. The low levels at Little River Reservoir and Lake Michie have caused the City of Durham to move to Stage 2 water restrictions. Some groundwater systems have begun experiencing much higher than normal pumping times.
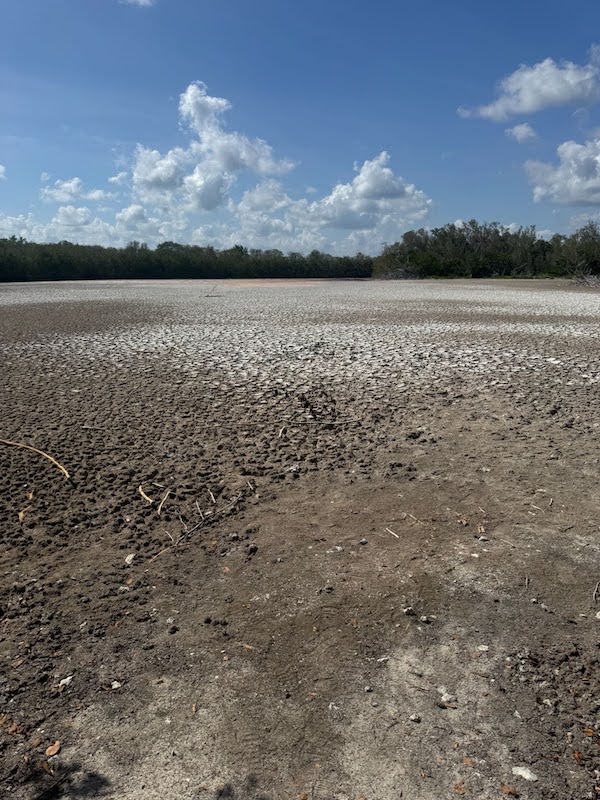
- Most of the Florida Peninsula has experienced below-normal rainfall since the beginning of 2026. The longer-term deficits are exacerbated by a dry start to the wet season (starting May 15). June is the wettest month of the year for the Florida Peninsula, but much of the area has received below-normal rainfall, leading to drought impacts.
- Fire impacts: Florida has several county-level burn bans in place as the fire potential is high in some areas of the state. There are currently active fires in portions of the Florida Peninsula. Some of these fires have caused road closures, impacting transportation.
- Water resource impacts: According to the U.S. Army Corps of Engineers, Lake Okeechobee water levels are below normal at 10.97 feet, with levels near the water shortage management threshold (10.9 feet). Water levels in the Everglades are excessively low.
Find additional information on national current conditions, or explore conditions in your state.
June Provides Mixed Rainfall Conditions for the Southeast
Low Water Levels in Jordan Lake, North Carolina
Portions of South Florida Are Still Experiencing Severely Dry Conditions
Looking Ahead: Drought Conditions and Outlooks for the Southeast
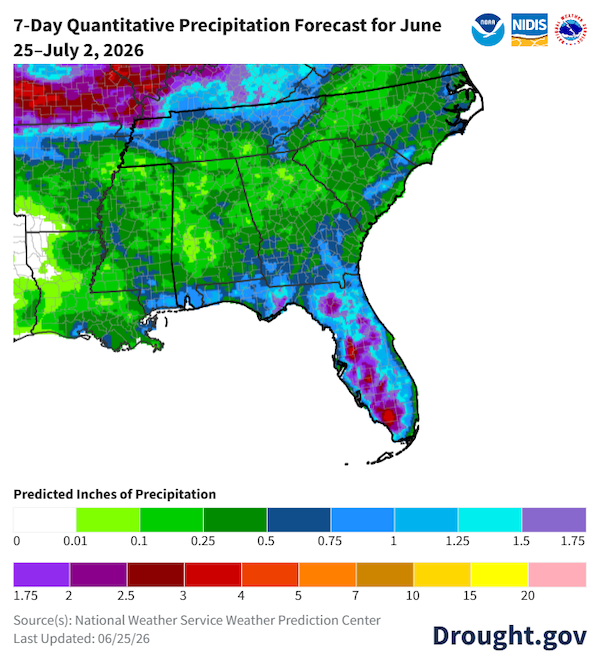
- The next seven days (through July 2) are forecast to bring some rainfall to the region, generally less than 0.50 inches. Unfortunately, these totals are below normal for the period. Florida is forecast to receive totals ranging from 1 to more than 2 inches, which will be near- to below normal for many parts of the state (dependent on local accumulations).
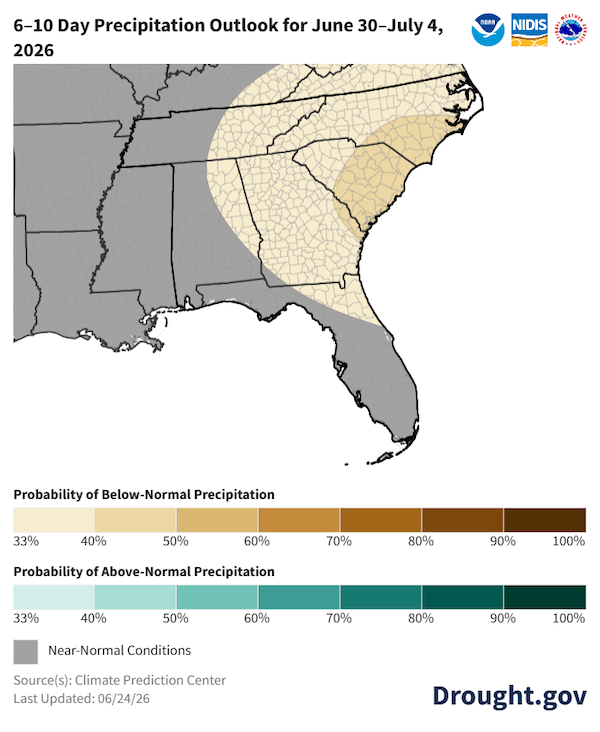
- A warm pattern is expected for June 30–July 4 across the Southeast. During this period, precipitation is forecast to be below normal for much of the region, especially the Carolinas. These conditions will likely cause drought to worsen in areas.
- El Niño conditions have developed in the tropical Pacific Ocean, and NOAA has issued an El Niño Advisory. El Niño, the warm phase of the El Niño–Southern Oscillation (ENSO), is currently gaining strength and predicted to intensify to a moderate or strong level this fall. There is a 99% chance of El Niño persisting into the winter, which is when El Niño impacts are typically strongest in the Southeast, often leading to wetter and cooler conditions. During strong El Niño events, the typical wetter winter pattern can start a bit earlier, during mid-to late fall. However, the impacts of El Niño on weather patterns are nuanced, change by season and location, and are not guaranteed.
- An El Niño summer could suppress tropical storm development in the Atlantic Ocean, influencing NOAA’s below-normal hurricane season prediction. Much of the Southeast receives its rainfall from tropical storms in the fall, meaning drought conditions could redevelop or intensify. A lack of tropical storm rainfall last fall (2025) led to drought in the Southeast.
- The Florida Peninsula has had a dry start to its wet season (beginning May 15). A below-normal hurricane season this summer could lead to drought intensification in the Florida Peninsula.
Rainfall Over the next 7 Days Will Vary Across the Region
Below-Normal Rainfall Is Expected for Most of the Southeast in Late June into Early July
Resources
Drought.gov State Pages
State pages on Drought.gov provide a one-stop shop for tailored state drought information and resources for each state. Find your state here. You can also find county and city-level information on Drought.gov.
National Weather Service Drought Information Statements
View the latest drought information statements from local National Weather Service offices on this interactive map.
- June 19, 2026: Tampa Bay, Florida (TBW)
- June 18, 2026: Miami, Florida (MFL)
- June 11, 2026: Melbourne, Florida (MFL)
- June 11, 2026: Morristown, Tennessee (MRX)
- June 9, 2026: Memphis, Tennessee (MEG)
- June 9, 2026: Raleigh, North Carolina (RAH)
- June 5, 2026: Charleston, South Carolina (CHS)
State Resources
- Alabama: ADECA Drought Planning and Management; Office of the Alabama State Climatologist; Alabama Drought Reach
- Florida: Florida Climate Center; Florida Weekly Drought Summary
- Georgia: Georgia EPD Drought Management; Office of the Georgia State Climatologist
- North Carolina: North Carolina Drought Management Advisory Council; North Carolina State Climate Office
- South Carolina: South Carolina Drought Page; South Carolina State Climatology Office
- Tennessee: Tennessee Weekly Drought Summaries; Tennessee Climate Office
Prepared By
Elliot Wickham
Cooperative Institute for Research to Operations in Hydrology (CIROH)/University of Alabama, NOAA’s National Integrated Drought Information System (NIDIS)
Corey Davis
North Carolina State Climate Office at NC State University
Chris Fuhrmann and William Schmitz
Southeast Regional Climate Center
Barry Baxter
National Weather Service Miami-South Florida
This Drought Status Update is issued in partnership between the National Oceanic and Atmospheric Administration (NOAA) and partners to communicate a potential area of concern for drought expansion and/or development within the Southeast DEWS region based on recent conditions and the upcoming forecast. NIDIS and its partners will issue future Drought Status Updates as conditions evolve. NIDIS is an interagency program within the Climate Program Office, which is part of NOAA's Office of Oceanic and Atmospheric Research.