Intermountain West Drought Persists Due to Heat and Lackluster Monsoon; Despite Short-Term Relief, Long-Term Water Crisis Continues
Key Points
- Record-breaking July temperatures and widespread severe conditions have left nearly 95% of the Intermountain West in drought, per the U.S. Drought Monitor.
- Isolated monsoon rains failed to provide meaningful, region-wide relief for water supply challenges.
- Major reservoirs across the Colorado River and Rio Grande Basins are reaching historic lows, triggering mandatory water restrictions and threatening water supplies, hydropower generation, and recreation across the region. Key examples include:
- The nation’s two largest reservoirs are at critical lows. Lake Mead has hit record lows since its 1937 filling. Lake Powell is critically low at 22% capacity.
- New Mexico's Elephant Butte Reservoir is at 1.4% capacity, leaving an 82-mile section of the Middle Rio Grande Valley in New Mexico dry.
- Colorado's Blue Mesa Reservoir, the largest reservoir in Colorado and a source of emergency water supply to Lake Powell, is at 26% capacity.
- While the remaining monsoon rains may provide some relief for local supply and storage, rainfall is unlikely to resolve the Intermountain West's long-term water supply challenges.
This update is based on data available as of Thursday, August 20, 2026 at 8:00 a.m. MT. We acknowledge that conditions are evolving.
U.S. Drought Monitor map for the Intermountain West Drought Early Warning System (Arizona, Colorado, New Mexico, Utah, and Wyoming), as of August 18, 2026. The U.S. Drought Monitor is updated each Thursday to show the location and intensity of drought across the country.
The map uses 5 classifications: Abnormally Dry (D0), showing areas that may be going into or are coming out of drought, and four levels of drought (D1–D4).
A drought index combines multiple drought indicators (e.g., precipitation, temperature, soil moisture) to depict drought conditions. For some products, like the U.S. Drought Monitor, authors combine their analysis of drought indicators with input from local observers. Other drought indices, like the Standardized Precipitation Index (SPI), use an objective calculation to describe the severity, location, timing, and/or duration of drought.
Learn MorePeriods of drought can lead to inadequate water supply, threatening the health, safety, and welfare of communities. Streamflow, groundwater, reservoir, and snowpack data are key to monitoring and forecasting water supply.
Learn MoreDrought can reduce the water availability and water quality necessary for productive farms, ranches, and grazing lands, resulting in significant negative direct and indirect economic impacts to the agricultural sector. Monitoring agricultural drought typically focuses on examining levels of precipitation, evaporative demand, soil moisture, and surface/groundwater quantity and quality.
Learn MoreU.S. Drought Monitor Categories
D0 - Abnormally Dry
Abnormally Dry (D0) indicates a region that is going into or coming out of drought, according to the U.S. Drought Monitor.
D1 – Moderate Drought
Moderate Drought (D1) is the first of four drought categories (D1–D4), according to the U.S. Drought Monitor.
D2 – Severe Drought
Severe Drought (D2) is the second of four drought categories (D1–D4), according to the U.S. Drought Monitor.
D3 – Extreme Drought
Extreme Drought (D3) is the third of four drought categories (D1–D4), according to the U.S. Drought Monitor.
D4 – Exceptional Drought
Exceptional Drought (D4) is the most intense drought category, according to the U.S. Drought Monitor.
Total Area in Drought (D1–D4)
Percent area of the Intermountain West that is currently in drought (D1–D4), according to the U.S. Drought Monitor.
U.S. Drought Monitor map for the Intermountain West Drought Early Warning System (Arizona, Colorado, New Mexico, Utah, and Wyoming), as of August 18, 2026. The U.S. Drought Monitor is updated each Thursday to show the location and intensity of drought across the country.
The map uses 5 classifications: Abnormally Dry (D0), showing areas that may be going into or are coming out of drought, and four levels of drought (D1–D4).
The U.S. Drought Monitor is released every Thursday morning, with data valid through the previous Tuesday at 8 a.m. EDT.
A drought index combines multiple drought indicators (e.g., precipitation, temperature, soil moisture) to depict drought conditions. For some products, like the U.S. Drought Monitor, authors combine their analysis of drought indicators with input from local observers. Other drought indices, like the Standardized Precipitation Index (SPI), use an objective calculation to describe the severity, location, timing, and/or duration of drought.
Learn MorePeriods of drought can lead to inadequate water supply, threatening the health, safety, and welfare of communities. Streamflow, groundwater, reservoir, and snowpack data are key to monitoring and forecasting water supply.
Learn MoreDrought can reduce the water availability and water quality necessary for productive farms, ranches, and grazing lands, resulting in significant negative direct and indirect economic impacts to the agricultural sector. Monitoring agricultural drought typically focuses on examining levels of precipitation, evaporative demand, soil moisture, and surface/groundwater quantity and quality.
Learn MoreHow Bad Is Drought in the Intermountain West Right Now?
Drought conditions continue to be widespread and severe across much of the Intermountain West. According to the U.S. Drought Monitor, nearly 95% of the region (Arizona, Colorado, New Mexico, Utah, and Wyoming) is experiencing some type of drought, with around 30% of the region in either Extreme Drought (D3) or Exceptional Drought (D4).
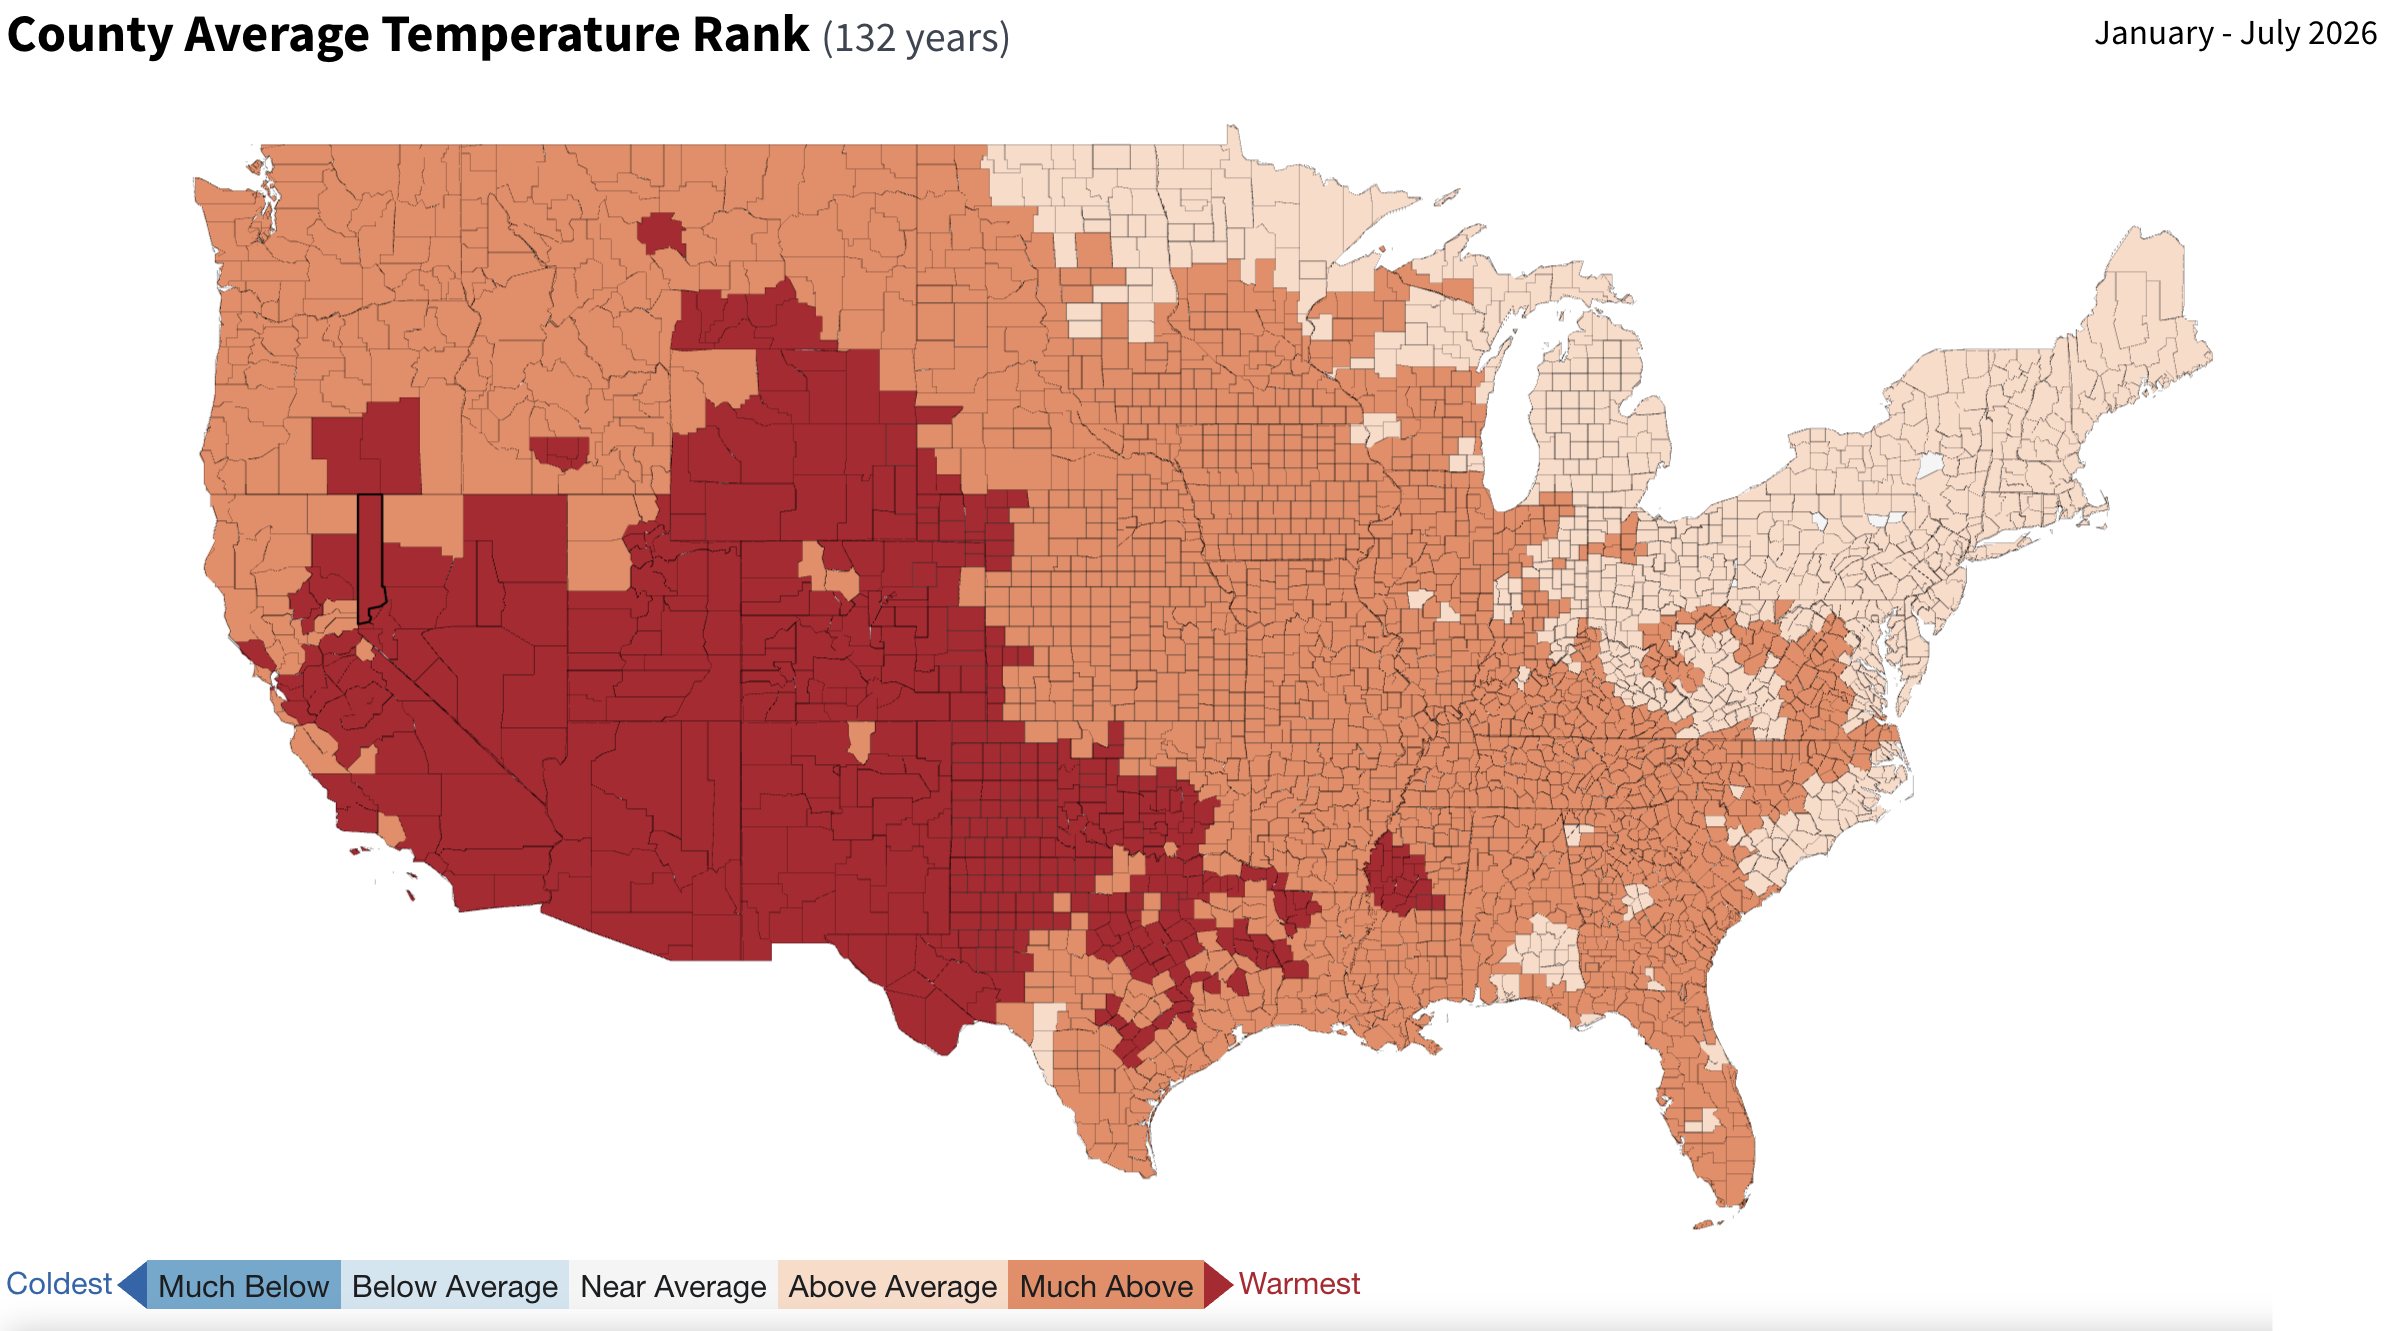
Recent heat contributed to continued rapid drying of the landscape. Nearly every county in the Intermountain West has experienced their warmest year on record. Based on records dating back to 1901, July saw the following:
- warmest on record for Wyoming;
- second warmest for Colorado, New Mexico, and Utah; and
- 4th warmest on record for Arizona.
Local records were set as well, such as an all-time record warm minimum temperature of 99°F in Laughlin, Nevada. Phoenix, Arizona (97°F) and Nellis Air Force Base, Nevada (96°F) also tied records for warm minimum temperatures.
Monsoon rains arrived in July and brought some drought relief, primarily in Arizona, Utah, and western parts of Colorado and New Mexico. But those rainstorms were isolated, some have contributed to flash flooding, and they have not led to any widespread or meaningful improvements to overall water supply in the region. Those areas not receiving monsoonal rainfall, such as eastern Colorado and New Mexico, continue to dry out. Streamflow continues to be well below normal in many areas.
Year-to-Date Temperatures Were Record Warm Across the Intermountain West
How Are Communities Impacted?
Multiple years of low reservoir conditions already stressed surface water storage across the Colorado River and Rio Grande Basins. The regional drought, record-low snowpack, above-average temperatures, and a lackluster monsoon season continue to severely impact storage. As of August 13, major reservoir storage levels remain at or near historic low levels. Several municipalities in Arizona, Colorado, and New Mexico enacted mandatory water restrictions or declared local emergencies. Colorado, Utah, and New Mexico issued statewide drought declarations or emergencies.
Federal officials recently announced a 10-year framework for Colorado River Operations, including future management of Lake Powell and Lake Mead. Water levels are projected to decline further throughout the summer, further impacting agriculture, residential users, energy production, and public lands. Some key examples of water supply impacts:
- Lake Mead, the largest reservoir in the United States, dropped to its lowest water level on record since it was filled in 1937, threatening water supplies, hydropower generation and recreation across the region. Lake Powell, the second largest reservoir in the U.S., is also critically low at 22% full (33% average).
- The Blue Mesa Reservoir, the largest reservoir in Colorado, is only around 24% full. This reservoir was built to store water for the Upper Colorado Basin states, manage floods, and generate hydroelectric power. However, the reservoir is unable to send significant water to Lake Powell now due to the critically low water levels. Concern is rising that levels may drop below its minimum power pool by the end of 2026, and the Reservoir will be unable to generate hydropower.
- Elephant Butte Reservoir, located on the Rio Grande and the largest reservoir in New Mexico, fell to historically low water levels and is currently around 1.4% capacity. An 82-mile section of the Middle Rio Grande in New Mexico has dried up.
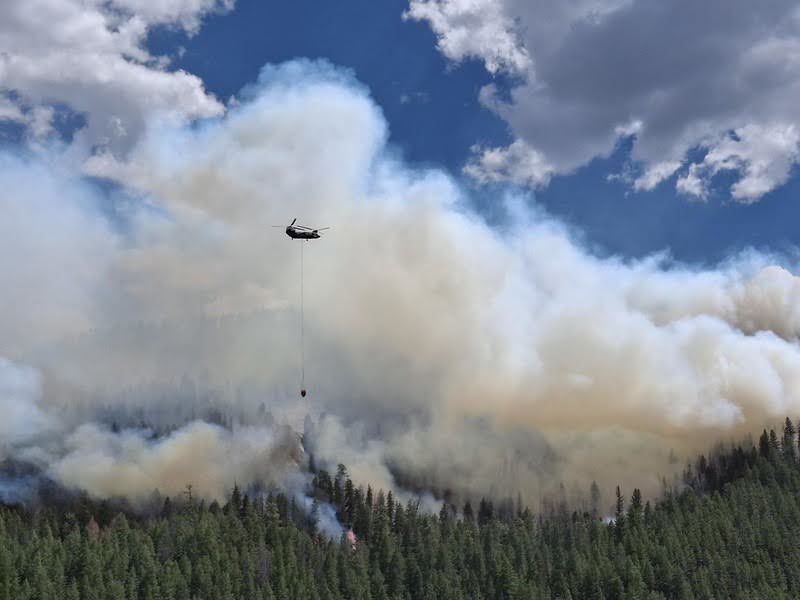
Elevated fire danger and wildfire activity continue to remain significant concerns across the region. Dry vegetation increased fuel loads, contributing to a surge in large wildfires. In response, many communities have implemented fire restrictions. Significant fire potential falls to average seasonal risk for significant fires as we approach the fall.
Agriculture continues to be particularly hard hit in many regions. Producers report that, due to poor conditions of pastures and limited water in reservoirs, little to no feed is available for livestock. The reduced hay production is leading to the purchase of supplemental hay that is increasingly harder to find, and increased cost to haul hay from more distant locations. There are also reports that cattle and livestock producers are culling animals. Further, low water levels and rising temperatures in lakes, reservoirs, and streams are creating increasingly stressful conditions for fish and low water for river recreation.
Wildfire Activity and Elevated Fire Danger Remain a Concern
Looking Ahead
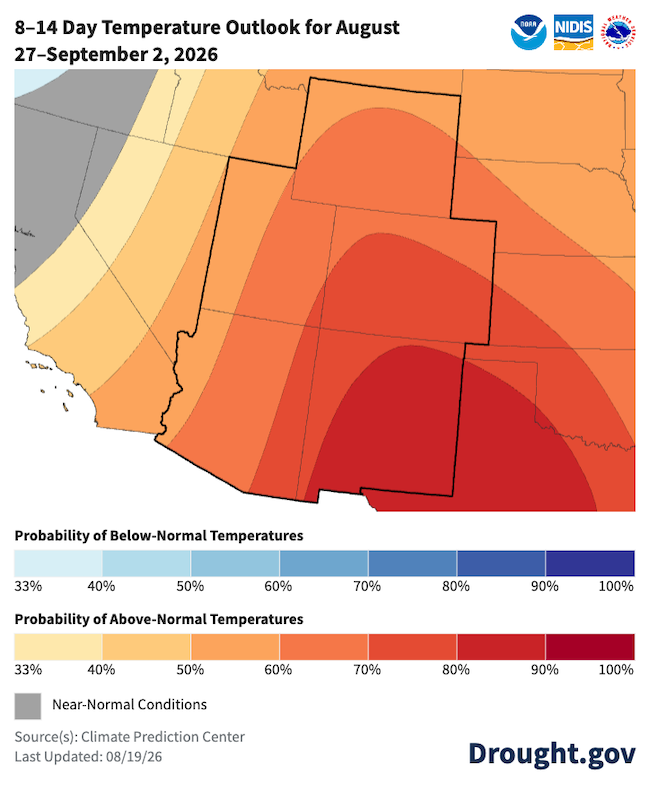
NOAA outlooks suggest that above- normal temperatures will persist across the region over the next two weeks, which will exacerbate the existing dryness. The monsoon season is still active. However, there is no current strong predictive signal in the precise timing, intensity, and location of these rains.
Drought conditions are anticipated to remain, but improve through November. Although the remaining monsoon rains may provide some relief for local supply and storage, it is unlikely to fully eliminate drought and its impacts, nor will it improve the region's long-term water supply challenges in any meaningful way.
El Niño is strengthening, with a greater than 90% chance of a very strong event during the Northern Hemisphere fall and winter 2026-27. While the specific influence of El Niño on the monsoon season remains uncertain, historical patterns suggest wetter conditions across the Intermountain West during the autumn.
Above-Normal Temperatures Expected Over the Next Two Weeks
Additional Resources
- More local information is available from the following resources:
- More state information is available from the following resources:
- Arizona: Interactive Drought Dashboard; State Climate Office
- Colorado: Water Conditions Monitoring Committee; Colorado Climate Center Drought Dashboard
- New Mexico: Office of the State Engineer, Drought page; New Mexico Climate Center
- Utah: Department of Natural Resources, Drought page; Utah Climate Center
- Wyoming: Drought page; State Climate Office
- Regional: Intermountain West Dashboard – weather, drought, and water resources for Colorado, Utah, and Wyoming
- To report or view local drought impact information:
Prepared By
Meredith Muth
NOAA National Integrated Drought Information System (NIDIS)
Elise Osenga
University of Colorado Boulder/Cooperative Institute for Research in Environmental Sciences (CIRES), NOAA/National Integrated Drought Information System (NIDIS)
NIDIS and its partners will issue future Drought Status Updates as conditions evolve. NIDIS is an interagency program within the Climate Program Office, which is part of NOAA’s Office of Oceanic and Atmospheric Research.