Long- and Short-Term Drought Persists Despite Late-Season Moisture Across the Intermountain West
Key Points
- Widespread drought impacts: Water Year 2026 produced widespread and consequential drought impacts across the Intermountain West, including large wildfires and fire restrictions, statewide drought declarations or emergencies, municipal water restrictions, and agricultural impacts including reduced hay production, livestock feed shortages, and livestock culling.
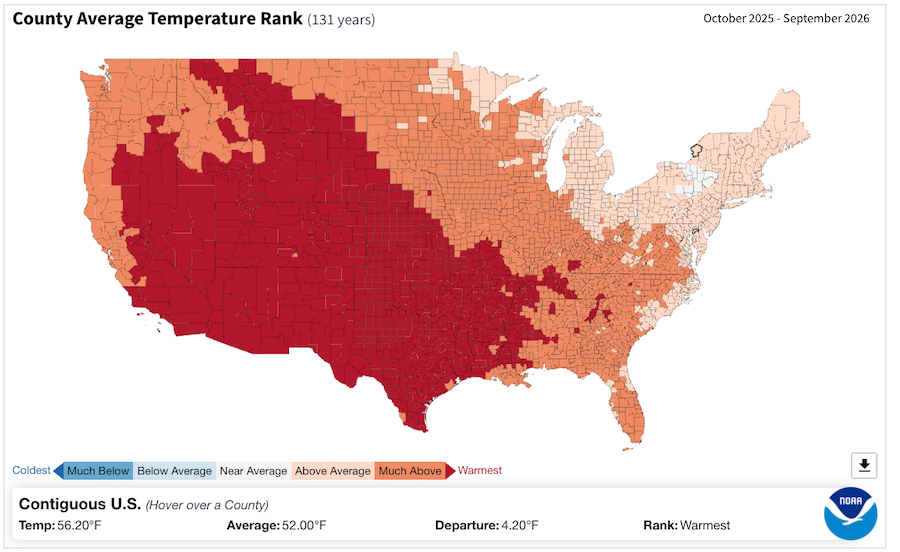
- Record warm and dry conditions: Water Year 2026 combined record-setting winter warmth and record-low snowpack with an exceptionally hot and dry summer. Record-low April 1 snowpack was widespread across the region, and all states experienced their warmest year on record.
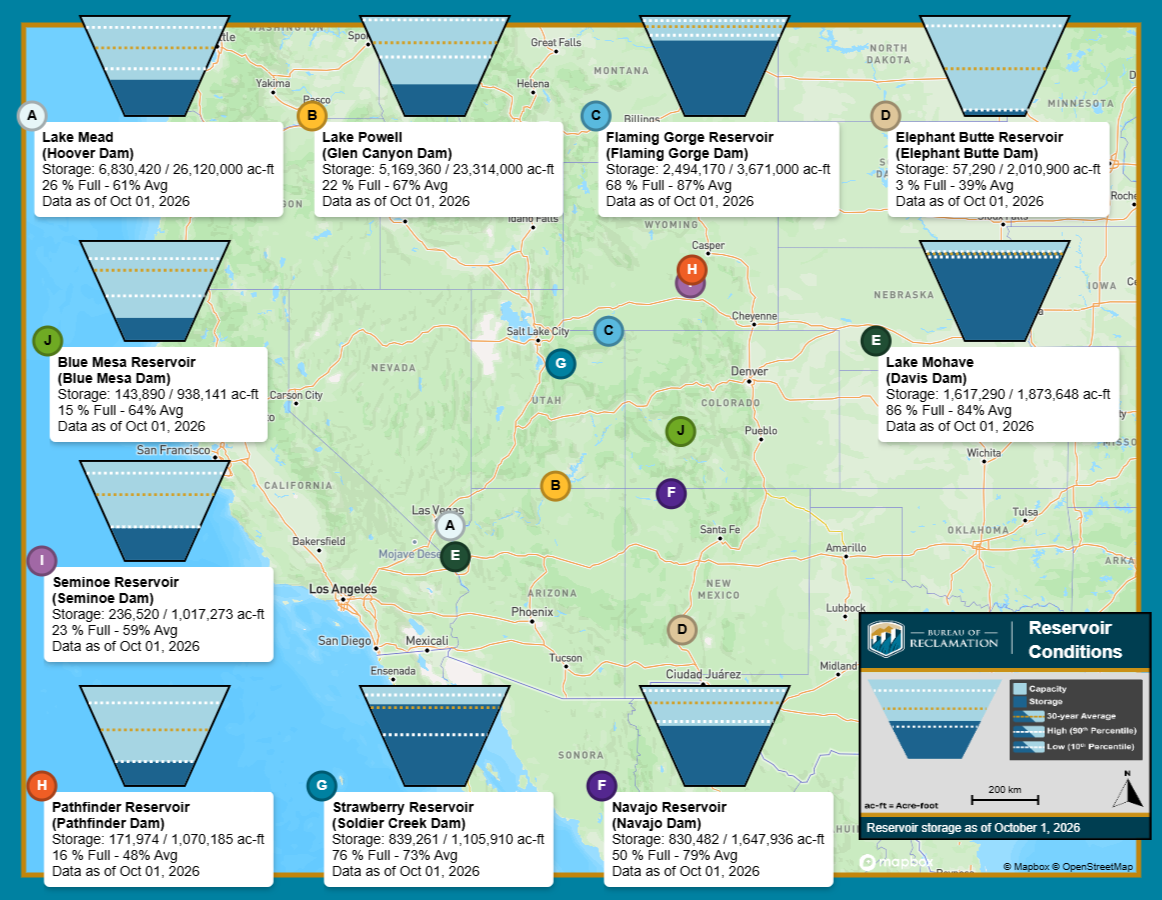
- Deficits outlast fall precipitation:Monsoon and late-season precipitation brought localized drought relief but did not erase the region's longer-term water supply deficits. Streamflows remained well below normal in many areas, and major reservoirs across the Colorado River and Rio Grande basins entered Water Year 2027 at historically low levels.
- Water supply is low, but winter precipitation could help: Water Year 2027 begins with depleted water supplies but improved odds for winter precipitation. A strengthening El Niño is expected to influence fall and winter conditions, and current forecasts favor periods of above-normal precipitation across parts of the region. Meaningful hydrologic recovery will require sufficient 2027 spring runoff from snowpack. Even a robust snow and precipitation year will not, however, fully alleviate critically low water supplies in major reservoirs.
This update is based on data available as of Thursday, October 15, 2026 at 8:00 a.m. MT. We acknowledge that conditions are evolving.
Recent Drought Conditions and Impacts: Looking Back on Water Year 2026
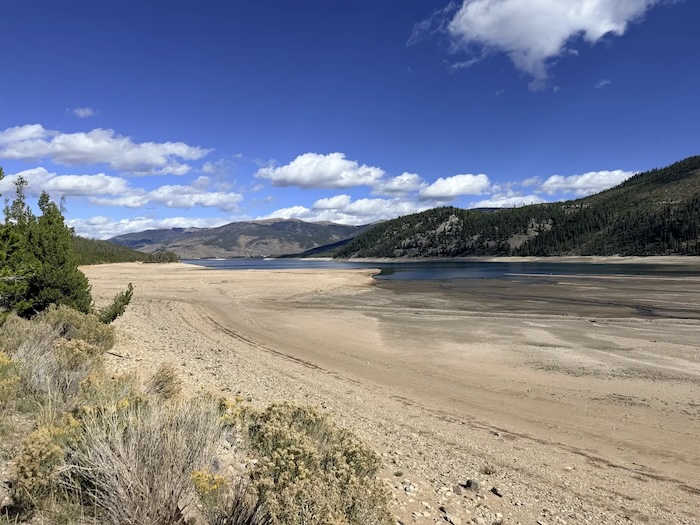
Low water levels on Lake Dillon in Colorado. Long-term water supply deficits persist across the Intermountain West. Photo credit: Britt Parker, NOAA/NIDIS. A hotter-than-normal winter: Exceptional warmth dominated Water Year 2026. Winter temperatures were much above average across the West and record-breaking at many locations, and March 2026 was the warmest March on record in all five Intermountain West states. Colorado experienced its hottest summer on record.
- Record low snowpack and early snow melt: Despite near-normal rainfall in many areas, the 2026 snow season culminated in record-low snowpack and unusually early melt. Across the western United States, 65% of April 1 snow water equivalent measurements set or tied record lows. In Utah, statewide snowpack peaked more than three weeks earlier than normal, and April 1 snowpack was the lowest in the state's recorded history.
- Poor spring runoff: Record-low snowpack and early melt translated into exceptionally poor spring runoff. Observed April–July natural inflow to Lake Powell was only 18% of average, and Reclamation's analysis placed total Water Year 2026 natural inflow at 3.52 million acre-feet, just 37% of the 1991–2020 average.
- Widespread drought: Drought became nearly ubiquitous across the Intermountain West by late spring and remained widespread through the summer. According to the U.S. Drought Monitor, about 95% of the region was in Moderate to Exceptional Drought (D1–D4) in mid-May, and more than 90% remained in drought through August and September, before widespread late-September slight rainfall brought improvement to parts of the region.
- Record-breaking summer heat: Summer 2026 was exceptionally hot and dry across the region. Colorado, New Mexico, and Utah experienced their warmest summers on record, while Arizona tied its warmest; precipitation was slightly below normal across much of the Intermountain West.
- Mixed monsoon: Monsoon precipitation provided uneven and localized relief but did not erase the region's longer-term water supply deficits. Monsoon precipitation varied substantially across the region, and while rainfall improved some short-term drought conditions, low streamflows and depleted reservoirs persisted. This means longer-term recovery depends on future cool-season precipitation, mountain snowpack, and spring runoff.
Where We’ve Been: Record Warm 2026 Water Year
Where We Are: Large Reservoir Storage Remains Significantly Low at the Start of the 2027 Water Year
Looking Forward to Water Year 2027: Forecasts and Potential Impacts
- Starting from deficits: Water Year 2027 begins with significant hydrologic deficits across the region. Major reservoirs and water-supply systems entered the water year below normal following exceptionally low snowpack, poor runoff, and heavy summer drawdowns. Elephant Butte Reservoir remains at only 4.7% of capacity, a slight uptick from a low of 1.4% earlier in the year.
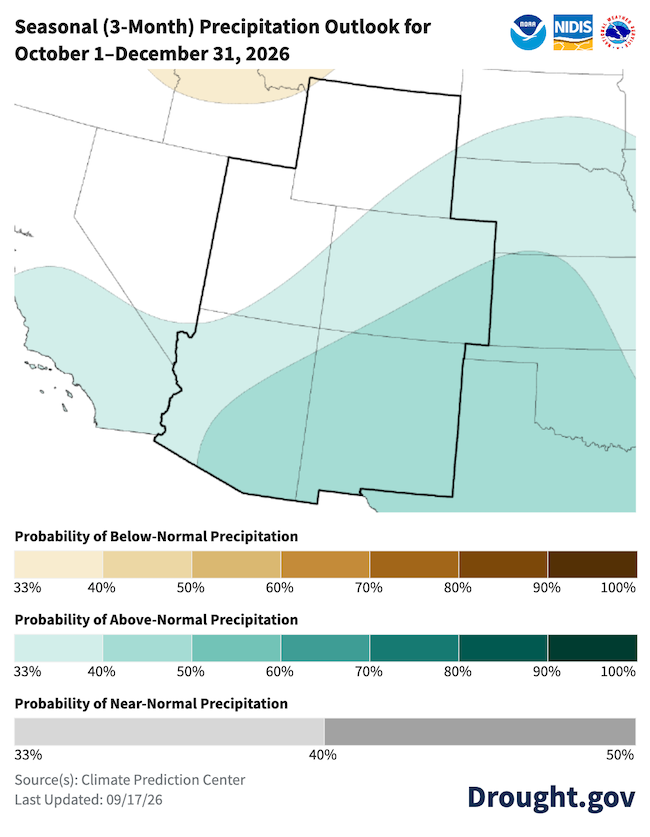
- El Niño will influence winter weather: The region entered El Niño conditions in June 2026, and forecasters estimate “a greater than 90% chance of a very strong event.” Though every El Niño is different and many factors affect winter conditions, a strengthening El Niño often increases the odds of a wetter fall and winter across the southern Intermountain West.
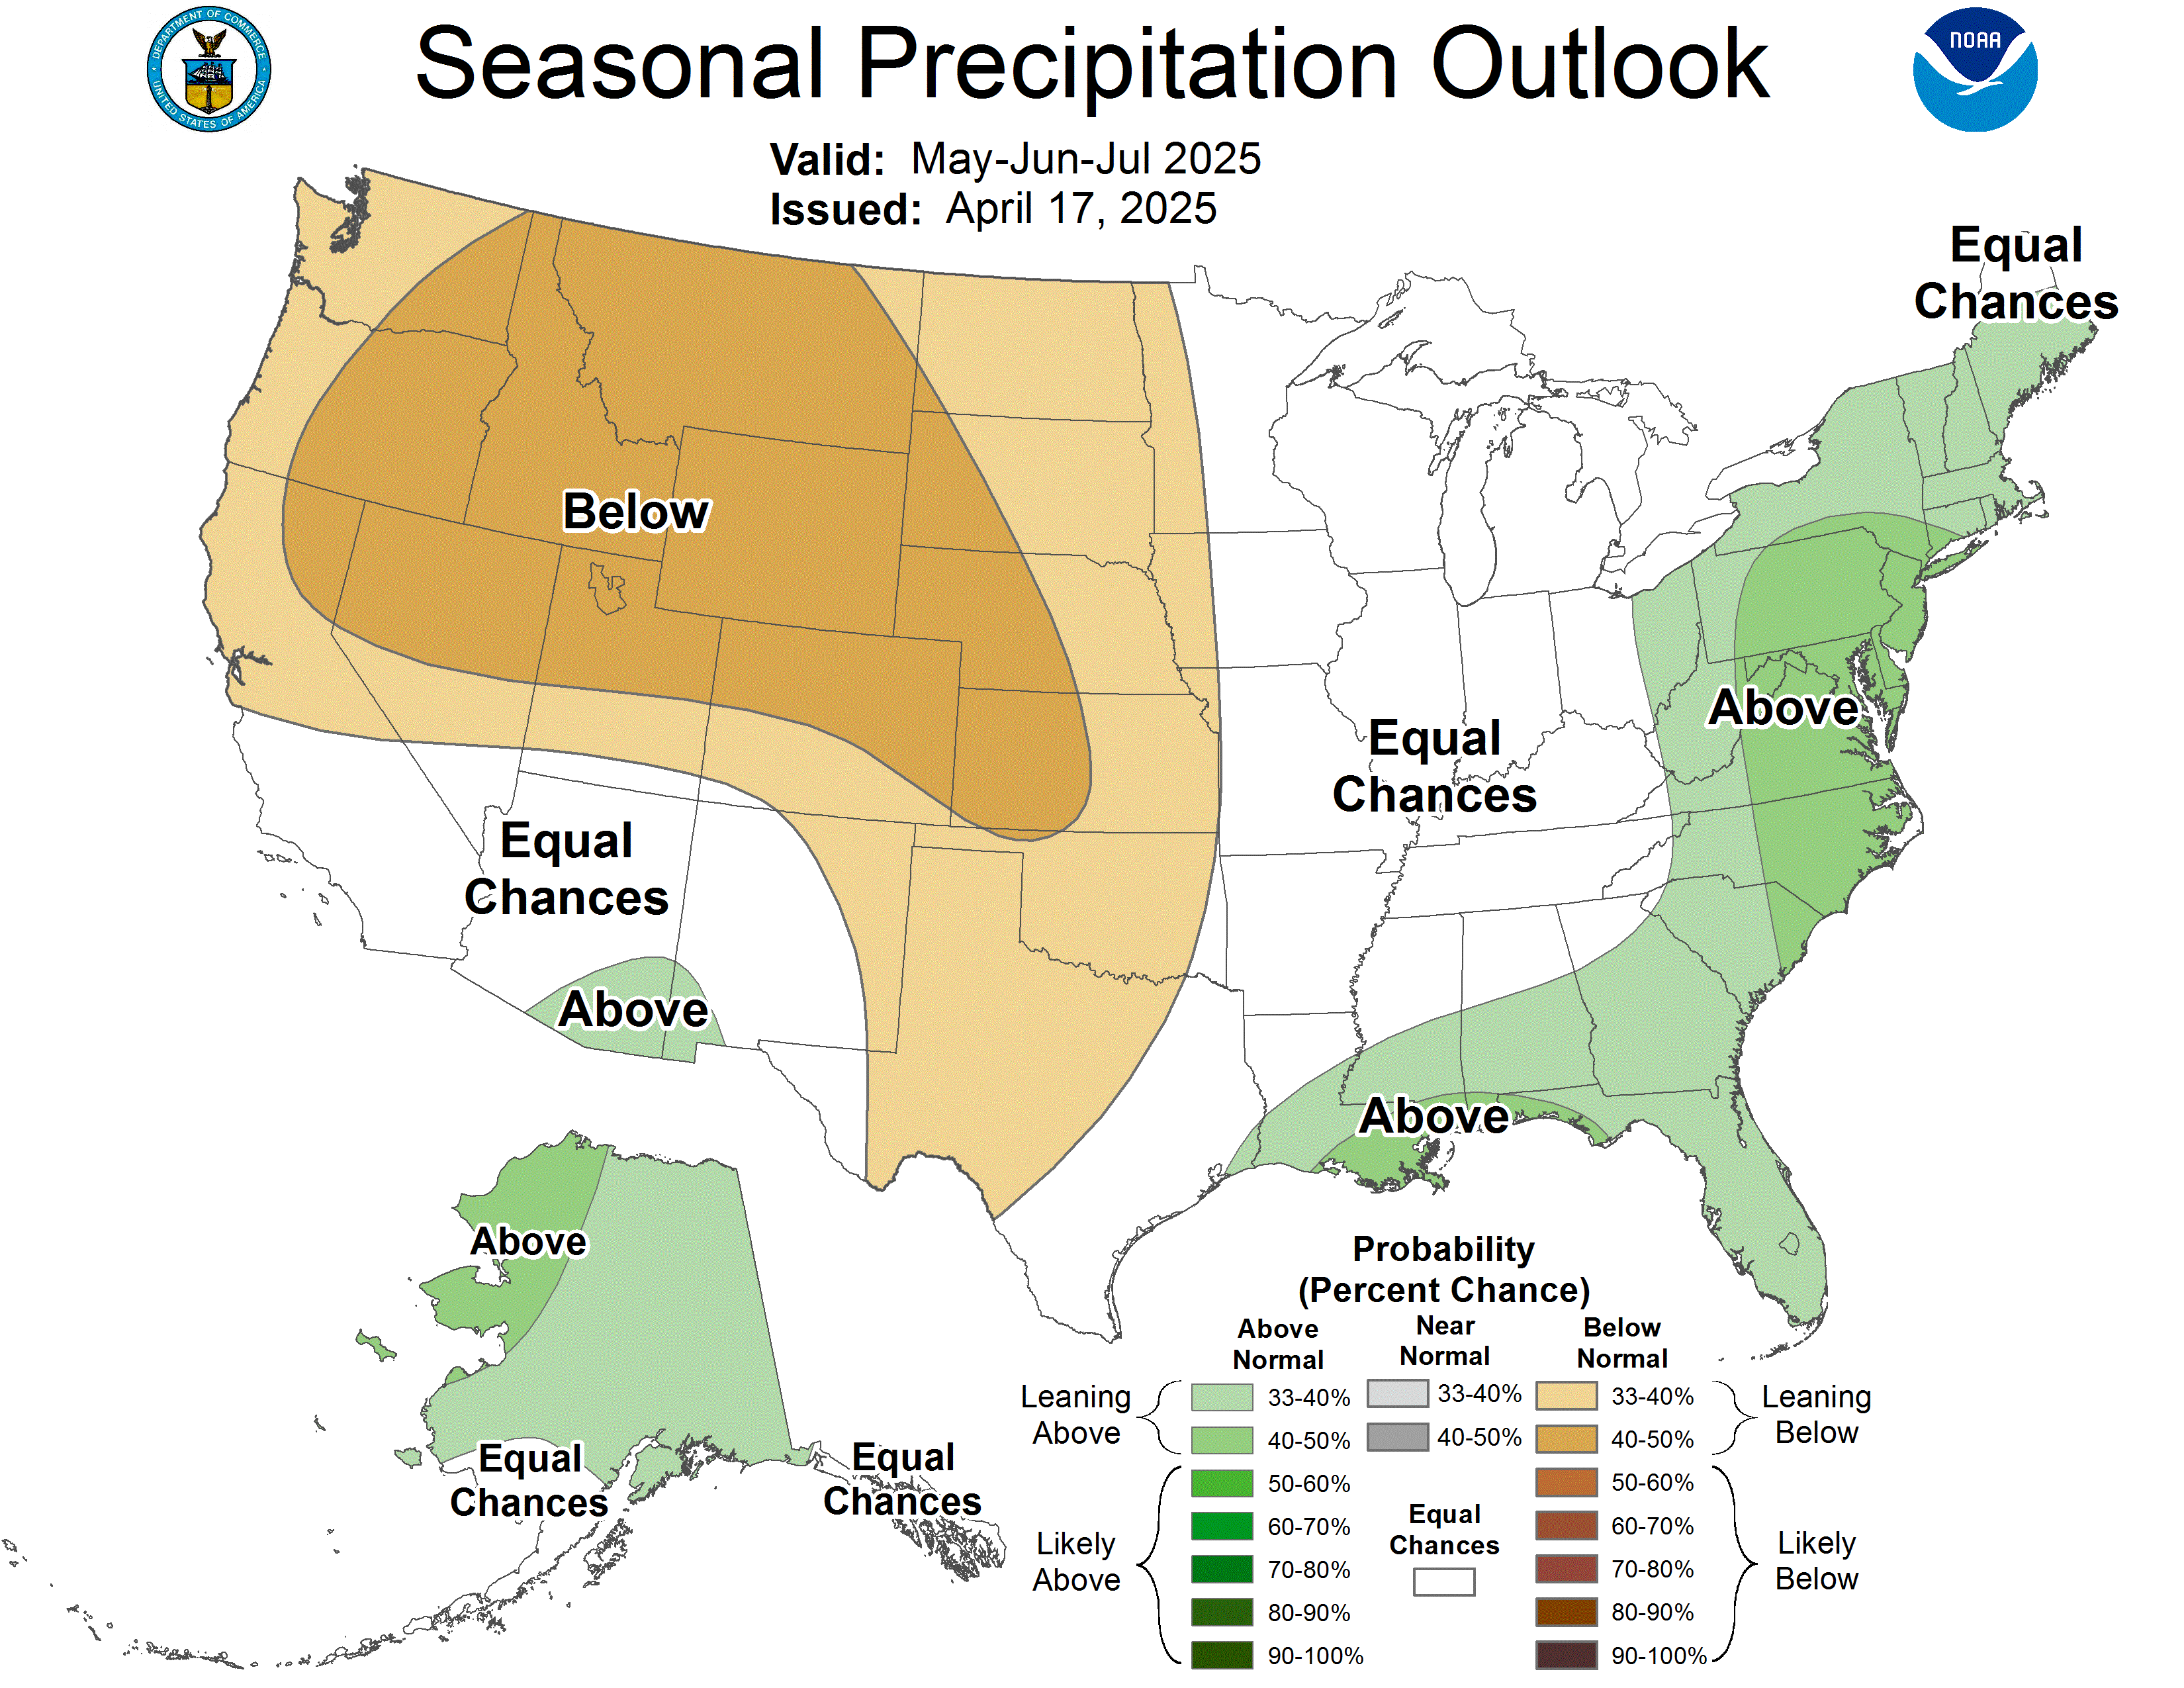
- Wet precipitation forecast: Current seasonal outlooks favor above-normal precipitation across much of the Four Corners, with the greatest chance for wetter than normal conditions focused over Arizona and New Mexico and extending into southern portions of Utah and Colorado.
- One good winter won’t eliminate deficits: A wetter winter would help offset water supply deficits, but one season will not erase the deep deficits that have accumulated over several years. Recovery of streamflow, reservoir storage, and other long-term drought indicators will depend, not only on winter precipitation, but also on how much falls as snow, when that snow melts, and how efficiently it becomes spring runoff.
- Warm temperatures forecast: As seen in long-range forecasts, continued warmth remains an important risk. Seasonal forecasts favor above-normal temperatures across much of the West, which could reduce snow accumulation, increase evaporative demand, and limit the water-supply benefits of otherwise favorable precipitation.
Where We’re Headed: Potential Wet Fall for the Southern Intermountain West Region
Additional Resources
- More local information is available from the following resources:
- More state information is available from the following resources:
- Arizona: Interactive Drought Dashboard; State Climate Office
- Colorado: Water Conditions Monitoring Committee; Colorado Climate Center Drought Dashboard
- New Mexico: Office of the State Engineer, Drought page; New Mexico Climate Center
- Utah: Department of Natural Resources, Drought page; Utah Climate Center
- Wyoming: Drought page; State Climate Office
- Regional: Intermountain West Dashboard – weather, drought, and water resources for Colorado, Utah, and Wyoming
- To report or view local drought impact information:
- News story: NIDIS and National Weather Service Revamp Drought Outlooks to be Clearer, More Useable
Get In Touch!
- Is your interest piqued by this update?
- Want to learn more about the data behind these numbers?
- Curious how your local conditions might compare?
Don’t hesitate to explore Drought.gov and reach out to your Regional Drought Information Coordinator, Will Farmer (will.farmer@noaa.gov).
Prepared By
William H. Farmer
Cooperative Institute for Research in Environmental Sciences (CIRES)/University of Colorado Boulder; NOAA’s National Integrated Drought Information System (NIDIS)
Meredith Muth
NOAA’s National Integrated Drought Information System (NIDIS)
Dave Dubois
New Mexico Climate Center, New Mexico State University
Jon Meyer
Utah Climate Center, Utah State University
NIDIS and its partners will issue future Drought Status Updates as conditions evolve. NIDIS is an interagency program within the Climate Program Office, which is part of NOAA’s Office of Oceanic and Atmospheric Research.