Amid Record Heat, Severe Storms Bring Some Drought Relief to the Mid-Atlantic
Key Points
- Early July brought a record-breaking heat wave and severe, damaging thunderstorms to the Mid-Atlantic. However, locally heavy rainfall from these storms improved drought and dry conditions in several areas of the region.
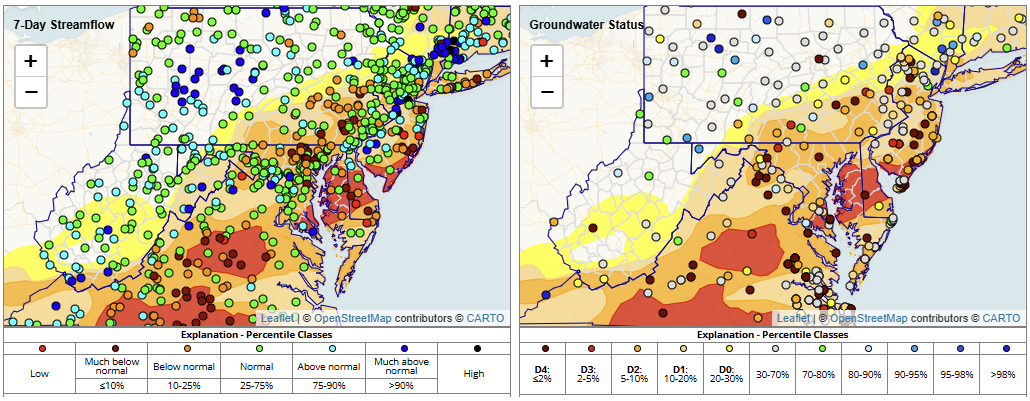
- Groundwater levels are much below normal throughout the Mid-Atlantic, especially in New Jersey, Virginia, and along parts of the East Coast.
- 7-, 14-, and 28-day streamflows are mixed across the region. Streamgages report below-normal flow along the East Coast, across much of Virginia, and in parts of Pennsylvania.
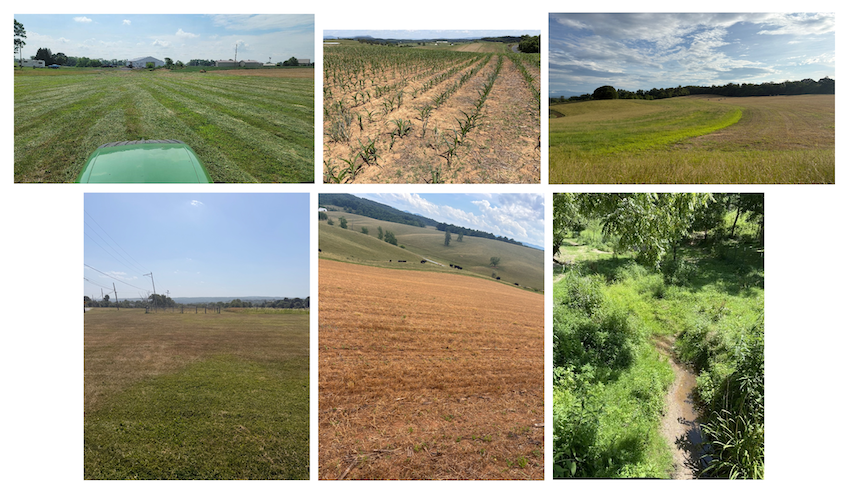
- Drought impacts are occurring across the region, including crop and tree stress, dry wells, and water restrictions.
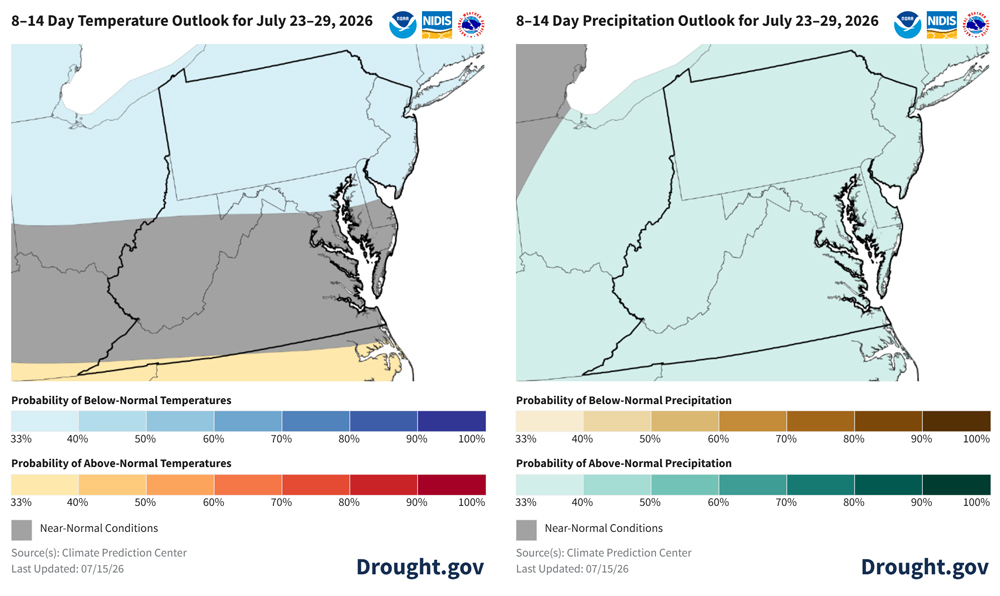
- Over the next 8–14 days, forecasters expect above-normal precipitation across the entire region, paired with below-normal temperatures in the north and near-normal temperatures in the south. Over the next three months, forecasts favor above-normal temperatures across the region. There are equal chances of above-, below-, and near-normal precipitation predicted for most of the region.
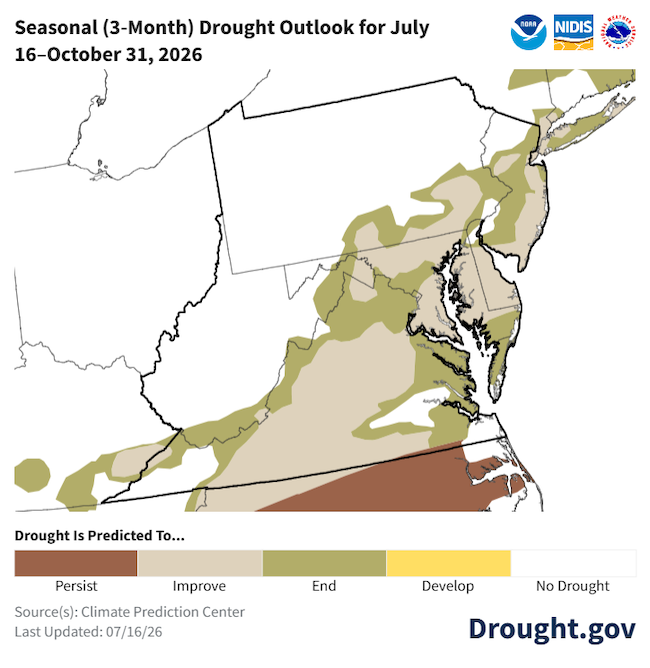
- Drought is expected to improve or be removed across the entire region over the next three months.
This update is based on data available as of Thursday, July 16, 2026 at 10:00 a.m. ET. We acknowledge that conditions are evolving.
The U.S. Drought Monitor 4-week change map shows where drought has improved, remained the same, or worsened across the Mid-Atlantic since the previous month's U.S. Drought Monitor.
The U.S. Drought Monitor depicts the location and intensity of drought across the country, using 5 classifications (D0–D4). Green hues show where conditions improved, yellow/orange hues show where conditions worsened, and gray areas show where drought remained the same.
A drought index combines multiple drought indicators (e.g., precipitation, temperature, soil moisture) to depict drought conditions. For some products, like the U.S. Drought Monitor, authors combine their analysis of drought indicators with input from local observers. Other drought indices, like the Standardized Precipitation Index (SPI), use an objective calculation to describe the severity, location, timing, and/or duration of drought.
Learn MorePeriods of drought can lead to inadequate water supply, threatening the health, safety, and welfare of communities. Streamflow, groundwater, reservoir, and snowpack data are key to monitoring and forecasting water supply.
Learn MoreDrought can reduce the water availability and water quality necessary for productive farms, ranches, and grazing lands, resulting in significant negative direct and indirect economic impacts to the agricultural sector. Monitoring agricultural drought typically focuses on examining levels of precipitation, evaporative demand, soil moisture, and surface/groundwater quantity and quality.
Learn MoreDrought Change Since Last Month
5-Category Degradation
Drought/dryness has worsened by 5 categories, according to the U.S. Drought Monitor.
4-Category Degradation
Drought/dryness has worsened by 4 categories, according to the U.S. Drought Monitor.
3-Category Degradation
Drought/dryness has worsened by 3 categories, according to the U.S. Drought Monitor.
2-Category Degradation
Drought/dryness has worsened by 2 categories, according to the U.S. Drought Monitor.
1-Category Degradation
Drought/dryness has worsened by 1 category, according to the U.S. Drought Monitor.
No Change
There has been no change in drought conditions at this location.
1-Category Improvement
Drought/dryness has improved by 1 category, according to the U.S. Drought Monitor.
2-Category Improvement
Drought/dryness has improved by 2 categories, according to the U.S. Drought Monitor.
3-Category Improvement
Drought/dryness has improved by 3 categories, according to the U.S. Drought Monitor.
4-Category Improvement
Drought/dryness has improved by 4 categories, according to the U.S. Drought Monitor.
5-Category Improvement
Drought/dryness has improved by 5 categories, according to the U.S. Drought Monitor.
The U.S. Drought Monitor 4-week change map shows where drought has improved, remained the same, or worsened across the Mid-Atlantic since the previous month's U.S. Drought Monitor.
The U.S. Drought Monitor depicts the location and intensity of drought across the country, using 5 classifications (D0–D4). Green hues show where conditions improved, yellow/orange hues show where conditions worsened, and gray areas show where drought remained the same.
The U.S. Drought Monitor is released every Thursday morning, with data valid through the previous Tuesday at 8 a.m. EDT.
A drought index combines multiple drought indicators (e.g., precipitation, temperature, soil moisture) to depict drought conditions. For some products, like the U.S. Drought Monitor, authors combine their analysis of drought indicators with input from local observers. Other drought indices, like the Standardized Precipitation Index (SPI), use an objective calculation to describe the severity, location, timing, and/or duration of drought.
Learn MorePeriods of drought can lead to inadequate water supply, threatening the health, safety, and welfare of communities. Streamflow, groundwater, reservoir, and snowpack data are key to monitoring and forecasting water supply.
Learn MoreDrought can reduce the water availability and water quality necessary for productive farms, ranches, and grazing lands, resulting in significant negative direct and indirect economic impacts to the agricultural sector. Monitoring agricultural drought typically focuses on examining levels of precipitation, evaporative demand, soil moisture, and surface/groundwater quantity and quality.
Learn MoreCurrent Conditions & Impacts
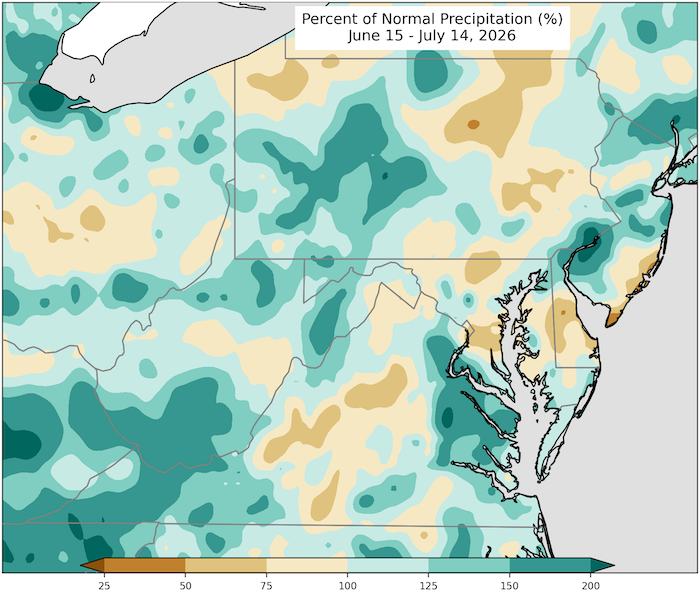
- Warm conditions largely dominated in the Mid-Atlantic over the last two weeks, with temperatures ranging from 2-10°F above normal since July 1. Precipitation varied across the region. The driest areas reported 25-50% of normal precipitation, and the wettest areas observed rainfall totals that were 200-300% of normal.
- Since the beginning of July, drought and Abnormal Dryness (D0-D4) improved across much of the Mid-Atlantic, with the greatest improvements occurring over the southeastern and southwestern portions of the region. However, drought conditions worsened in areas that missed beneficial precipitation. Severe Drought (D2) expanded from northern Maryland to northern Virginia, while Extreme Drought (D3) expanded in parts of New Jersey, Delaware, and Virginia.
- Recent precipitation improved streamflow conditions in parts of the region. However, gages report streamflows from record low to the 10th percentile across much of Virginia, Maryland, and Delaware, and in parts of southeast Pennsylvania and southern New Jersey.
- In Virginia, 29 community water systems have mandatory water restrictions, while Richmond, Virginia issued a voluntary water conservation order for the first time since 2002.
- In response to the Pennsylvania Department of Environmental Protection’s drought watch expansion, Pennsylvania American Water, a water utility, is asking customers to voluntarily reduce nonessential water consumption by 10–15%.
- Officials in Livingston, New Jersey, declared a water emergency, implementing water restrictions due to the ongoing drought, extreme heat, and limited precipitation.
- Farmers in Delaware are relying on irrigation to keep crops alive and report some corn will not recover from the dry conditions.
Storms Brought Heavy Rainfall to Parts of the Mid-Atlantic
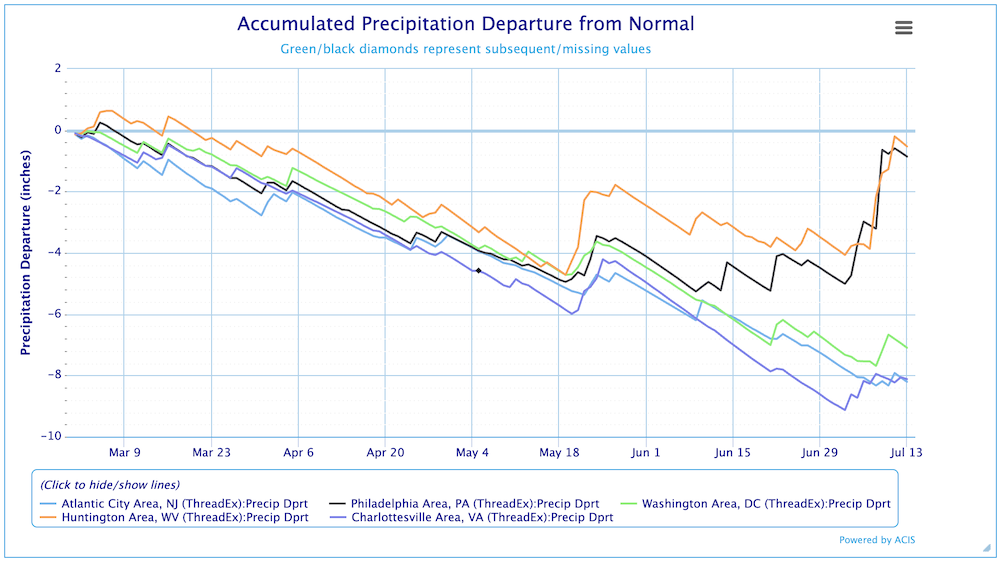
Precipitation Departures Began to Rebound in Some Areas
Low Streamflow and Groundwater Levels Across Coastal and Southern Areas
Drought Damaging Crops, Reducing Streamflow in the Mid-Atlantic
Outlooks and Potential Impacts
- The Climate Prediction Center’s 8–14 day outlook favors above-normal precipitation across the entire region, paired with below-normal temperatures in the north and near-normal temperatures in the south.
- The three-month outlook for August–October favors above-normal temperatures and equal chances of above-, below-, and near-normal precipitation for the region.
- The Climate Prediction Center’s seasonal drought outlook for July 16–October 31 favors drought improvement or removal for most of the region.
- Streamflows are beginning to improve in many locations, while groundwater levels continue to be below normal across much of the region. Follow local officials for information on water restrictions or conservation measures.
8-14 Day Outlook Favors Near- to Cooler-than-Normal Temperatures and Wetter Conditions
Drought Expected to Improve Across the Region
Resources
- Northeast Regional Climate Center (NRCC)
- NRCC Weekly Northeast Drought Update
- NRCC Monthly Maps and Regional Maps
- Register for the next Northeast Regional Climate Center monthly webinar on Thursday, July 30 at 9:30 a.m. ET.
- Drought in Delaware Portal
- Delaware River Basin Commission
- Interstate Commission on the Potomac River Basin Drought Monitoring and Operations
- Susquehanna River Basin Commission Drought Information
- Maryland Current Status of Drought
- New Jersey Drought Information
- Pennsylvania Drought Information
- Virginia Department of Environmental Quality Drought Information
- U.S. Geological Survey West Virginia Public Water System Drought Risk
- Eastern Area Coordination Center Wildland Fire Activity
- View or submit Condition Monitoring Observer Reports (CMOR)
Prepared By
Rocky Bilotta
Mid-Atlantic DEWS Drought Information Coordinator, NOAA National Integrated Drought Information System (NIDIS)
Samantha Borisoff, Art DeGaetano, Keith Eggleston, Jessica Spaccio, and Natalie Umphlett
Northeast Regional Climate Center
This Drought Status Update is issued in partnership between the National Oceanic and Atmospheric Administration (NOAA) and the Northeast Regional Climate Center to communicate a potential area of concern for drought expansion and/or development within the Mid-Atlantic region based on recent conditions and the upcoming forecast. NIDIS and its partners will issue future Drought Status Updates as conditions evolve.