Drought Worsens in Upper Midwest but Improves in Portions of the Plains and Ohio Valley
Hot and Dry Week Ahead Could Worsen Drought
Mississippi River Conditions, Impacts, and Outlook
Key Points
- According to the U.S. Drought Monitor, drought is currently impacting 38% of the north central U.S., with an additional 24% abnormally dry. Exceptional drought (D4)—the most intense level of drought—is impacting portions of Kansas, central Missouri, and eastern Nebraska.
- Recent rainfall has brought relief to some areas of the Plains and Ohio Valley, while other areas in the Midwest (Minnesota, Wisconsin, and Missouri) have seen drought conditions worsen.
- Drought impacts remain prevalent across the north central U.S., including significant impacts to vegetation, agriculture, water supply, recreation, tourism, and an increase of wildfires.
- The drier conditions in the Midwest have led to low water stages in the Upper Mississippi River. The low-flow conditions, particularly in Minnesota, are nearing low-flow triggers for hydropower operators, and dredging continues to maintain the 9-foot navigation channel for normal operations.
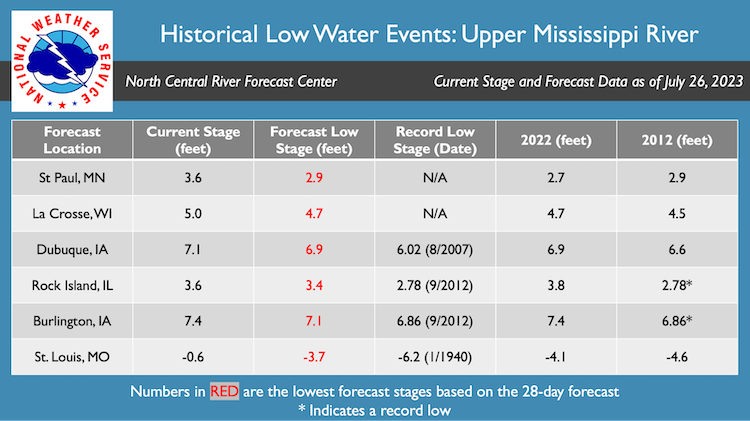
- Long-range river forecasts show that stages along the Upper Mississippi River are expected to continue to decrease over the next 28 days. Dubuque, IA, Rock Island, IL, and Burlington, IA have the potential to be within one foot of the record low water stage.
- This week (July 26–August 2) is expected to bring hot conditions to the north central U.S., with widespread temperatures above 90°F, including +100°F in the Central Plains. Some areas may also be drier this week as well. These conditions will increase stress on crops, including corn, soybeans, and specialty crops; increase risk to human and animal health; and increase potential for wildfires.
As conditions evolve, accurate reports on conditions and drought impacts are critical. Whether your area is currently wet, close to normal, or dry, please consider reporting conditions and any drought impacts you see or hear via the Condition Monitoring Observer Reports (CMOR) from the National Drought Mitigation Center. If you are already a CoCoRaHS observer, we encourage you to submit a Condition Monitoring Report.
Current U.S. Drought Monitor map for the National Weather Service Central Region with data valid for July 18, 2023. The U.S. Drought Monitor depicts the location and intensity of drought across the country. The map uses 5 classifications: Abnormally Dry (D0), showing areas that may be going into or are coming out of drought, and four levels of drought (D1–D4).
U.S. Drought Monitor Categories
Abnormally Dry (D0)
Abnormally Dry (D0) indicates a region that is going into or coming out of drought. View typical impacts by state.
Moderate Drought (D1)
Moderate Drought (D1) is the first of four drought categories (D1–D4), according to the U.S. Drought Monitor. View typical impacts by state.
Severe Drought (D2)
Severe Drought (D2) is the second of four drought categories (D1–D4), according to the U.S. Drought Monitor. View typical impacts by state.
Extreme Drought (D3)
Extreme Drought (D3) is the third of four drought categories (D1–D4), according to the U.S. Drought Monitor. View typical impacts by state.
Exceptional Drought (D4)
Exceptional Drought (D4) is the most intense drought category, according to the U.S. Drought Monitor. View typical impacts by state.
Current U.S. Drought Monitor map for the National Weather Service Central Region with data valid for July 18, 2023. The U.S. Drought Monitor depicts the location and intensity of drought across the country. The map uses 5 classifications: Abnormally Dry (D0), showing areas that may be going into or are coming out of drought, and four levels of drought (D1–D4).
The U.S. Drought Monitor is updated weekly on Thursdays, with data valid through the previous Tuesday at 7 a.m.
Current Conditions and Impacts
- According to the U.S. Drought Monitor, drought is currently impacting 38% of the north central U.S., with an additional 24% abnormally dry. Exceptional drought (D4)—the most intense level of drought—is impacting portions of Kansas, central Missouri, and eastern Nebraska.
- Recent rainfall and cooler temperatures have helped improve drought conditions in some areas over the last four weeks (Figure 1, Figure 2, Figure 3). Drought improved by up to two categories on the U.S. Drought Monitor across portions of Illinois, Indiana, and Kentucky in the Midwest, and Nebraska, South Dakota, Montana, and Wyoming in the Missouri River Basin.
- Drought has worsened in some areas of the Upper Midwest and Northern Plains, including portions of Minnesota, Wisconsin, Missouri, eastern Kansas, northern North Dakota, northern Montana, and western Colorado. Rainfall has been below normal in these areas over the last 30 days (Figure 2).
- Southern Illinois and western Kentucky had a significant rainfall event on July 19 where 6–12 inches of rain fell in a 10-hour window, causing significant flash flooding. The effectiveness of how this rainfall improved (or did not improve) drought conditions will be incorporated into the next release of the U.S. Drought Monitor on July 27.
- Looking over the last 12 weeks, drought has worsened by four categories on the U.S. Drought Monitor in portions of Missouri, southern Iowa, Wisconsin, and Minnesota (Figure 4). Miller and Cole counties in Missouri have worsened by 5 categories, meaning that they were completely drought free on April 25, 2023 and now are in the highest level—exceptional drought (D4).
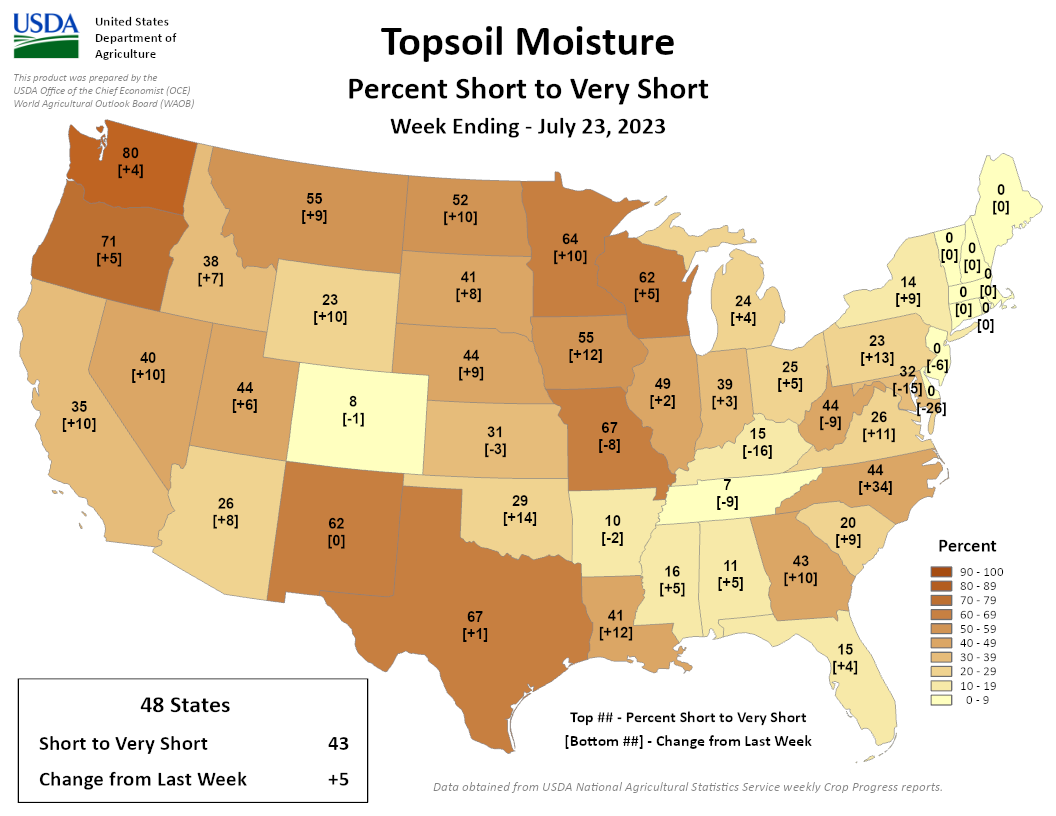
- While some areas have seen recent improvement, topsoil moisture remains low across many areas in the north central U.S. According to reports from the USDA, topsoil moisture is short to very short across 67% of agricultural land in Missouri, 64% in Minnesota, 62% in Wisconsin, and 55% in both Iowa and Montana.
Figure 1: 4-Week U.S. Drought Monitor Change Map (Since June 20, 2023)
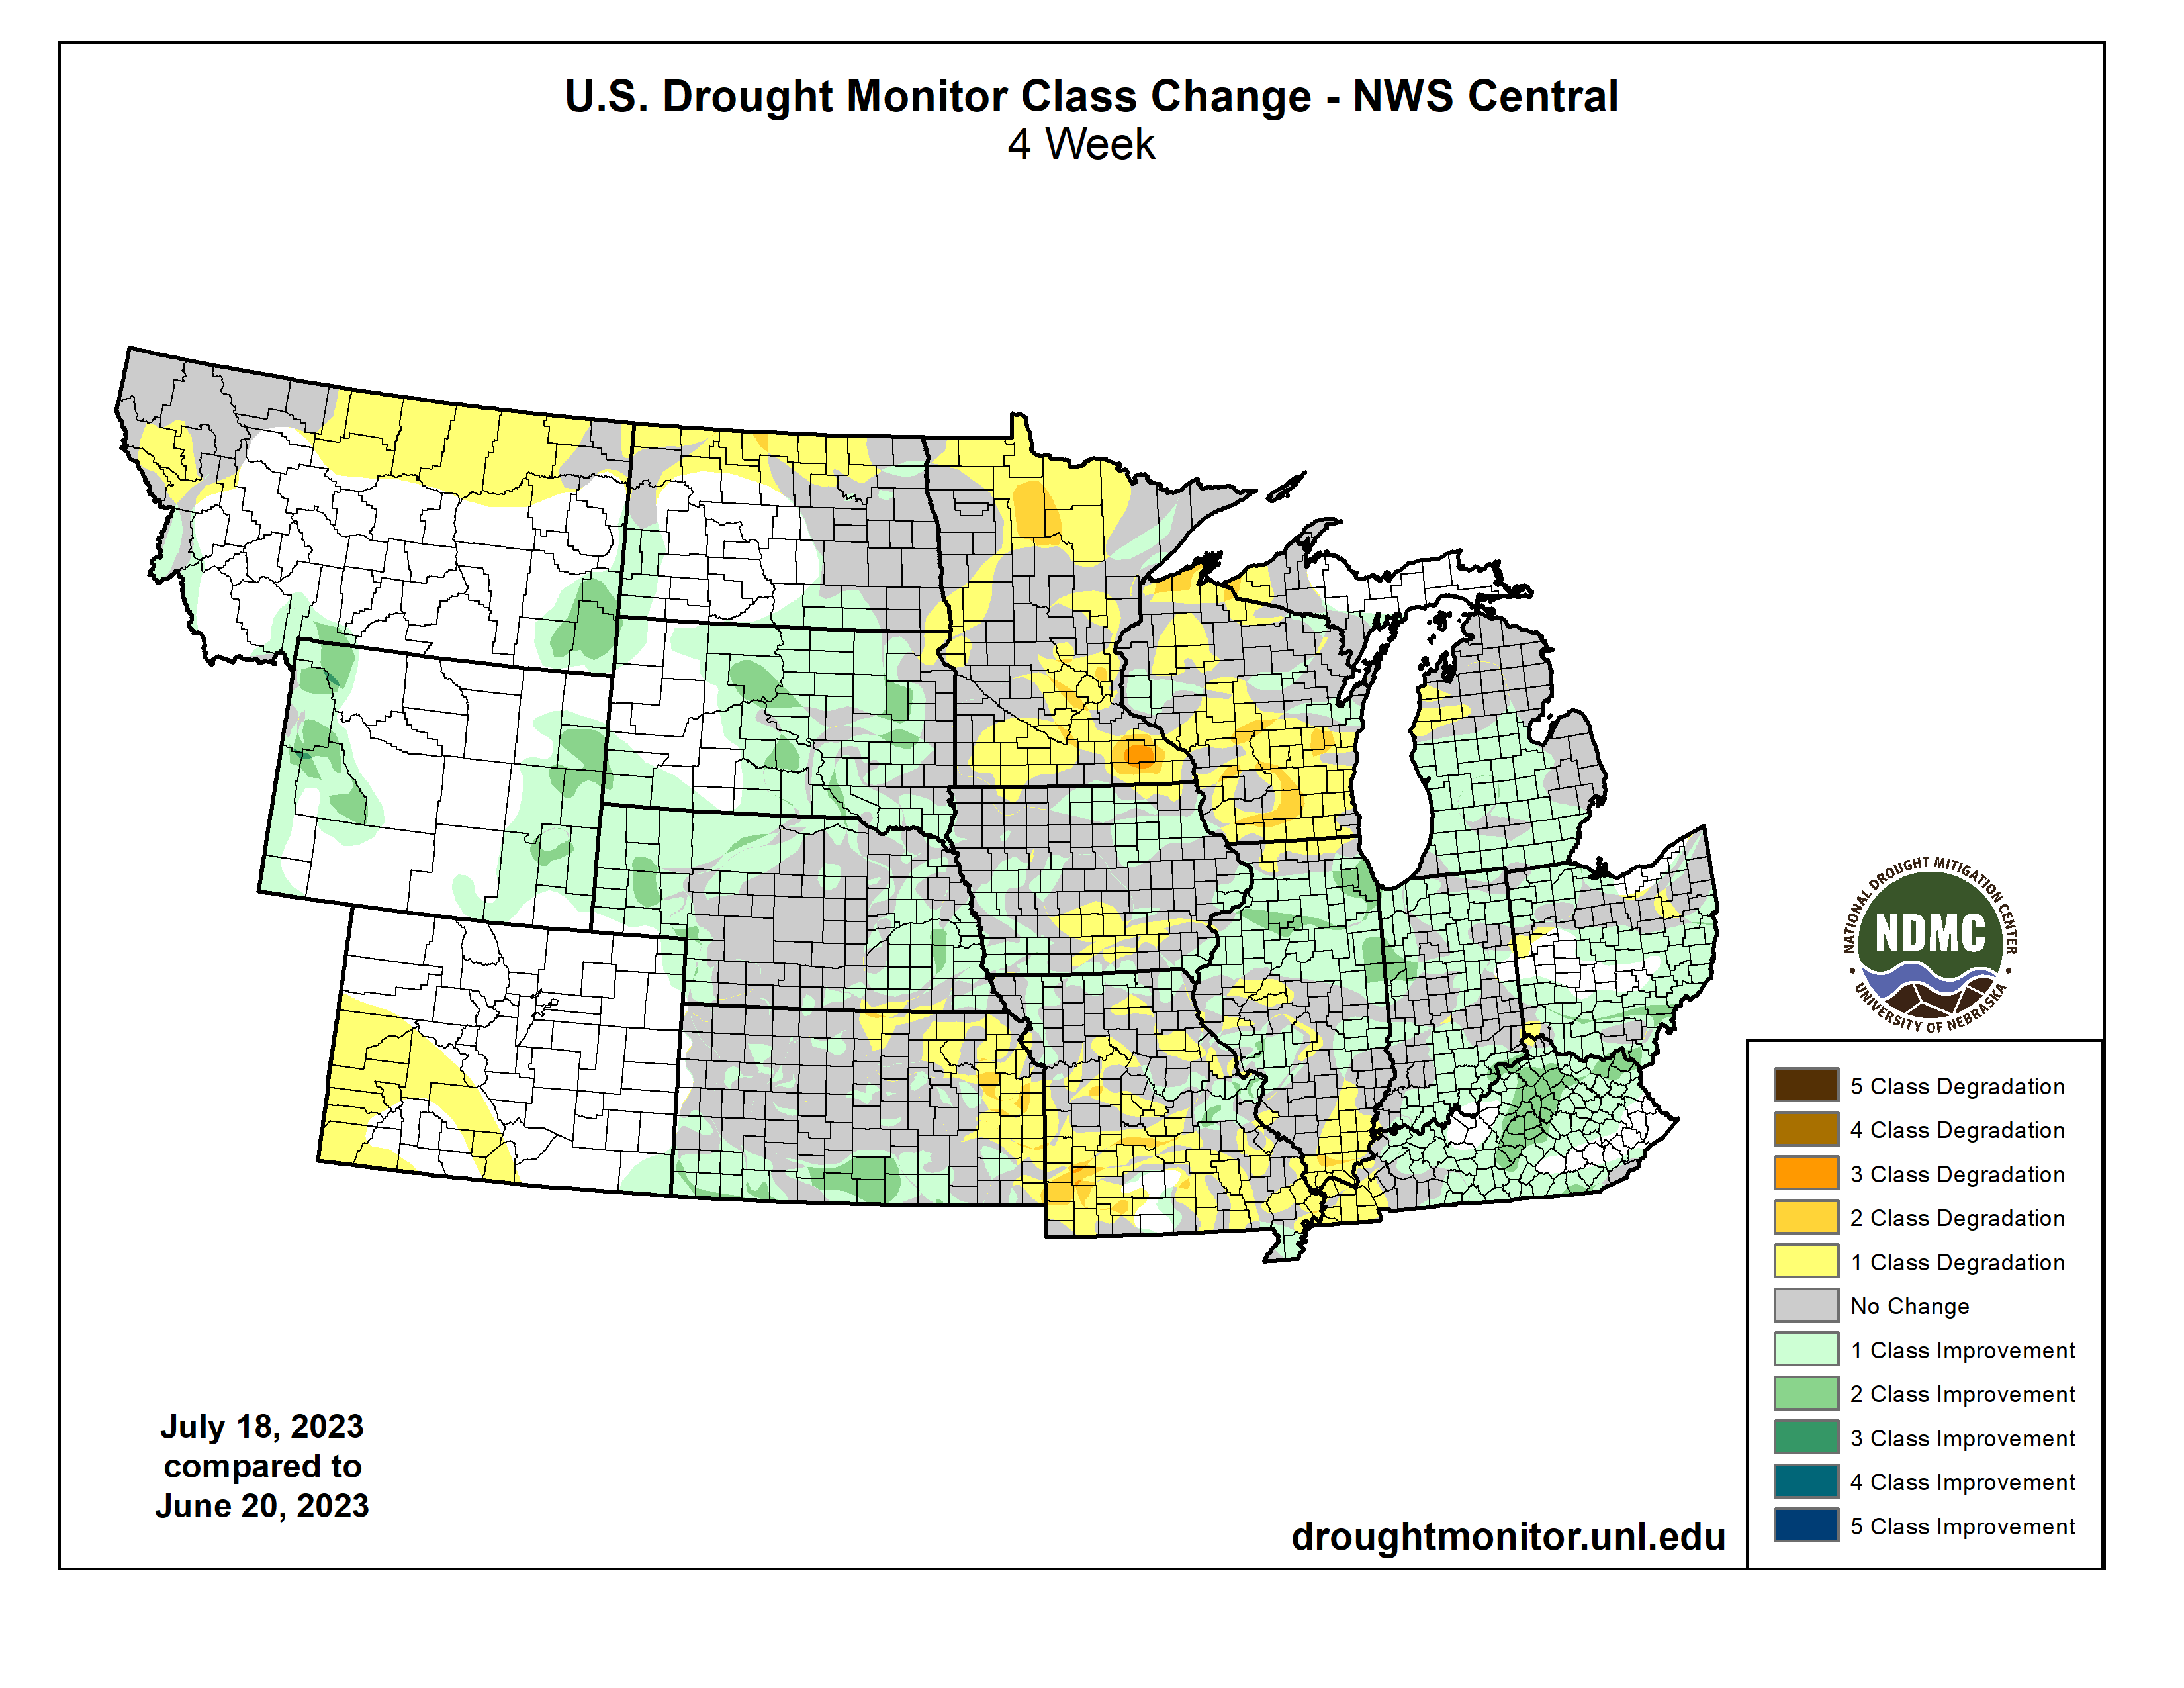
Figure 2: 30-Day Percent of Normal Precipitation: June 25–July 24, 2023
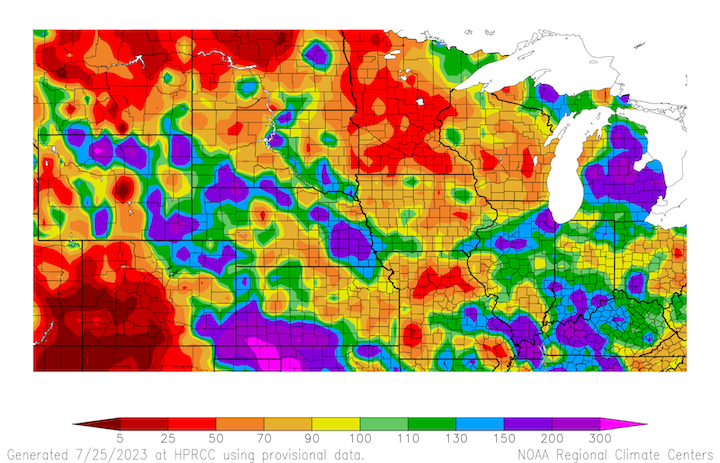
Figure 3: 30-Day Departure from Normal Temperature: June 25–July 24, 2023
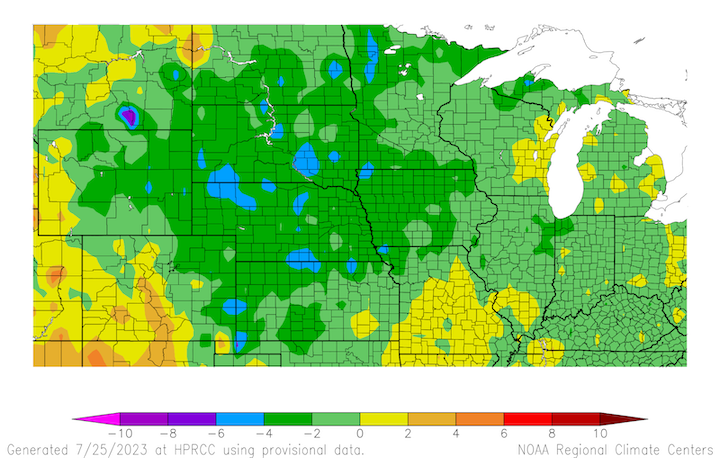
Figure 4: 12-Week U.S. Drought Monitor Change Map (since April 25, 2023)
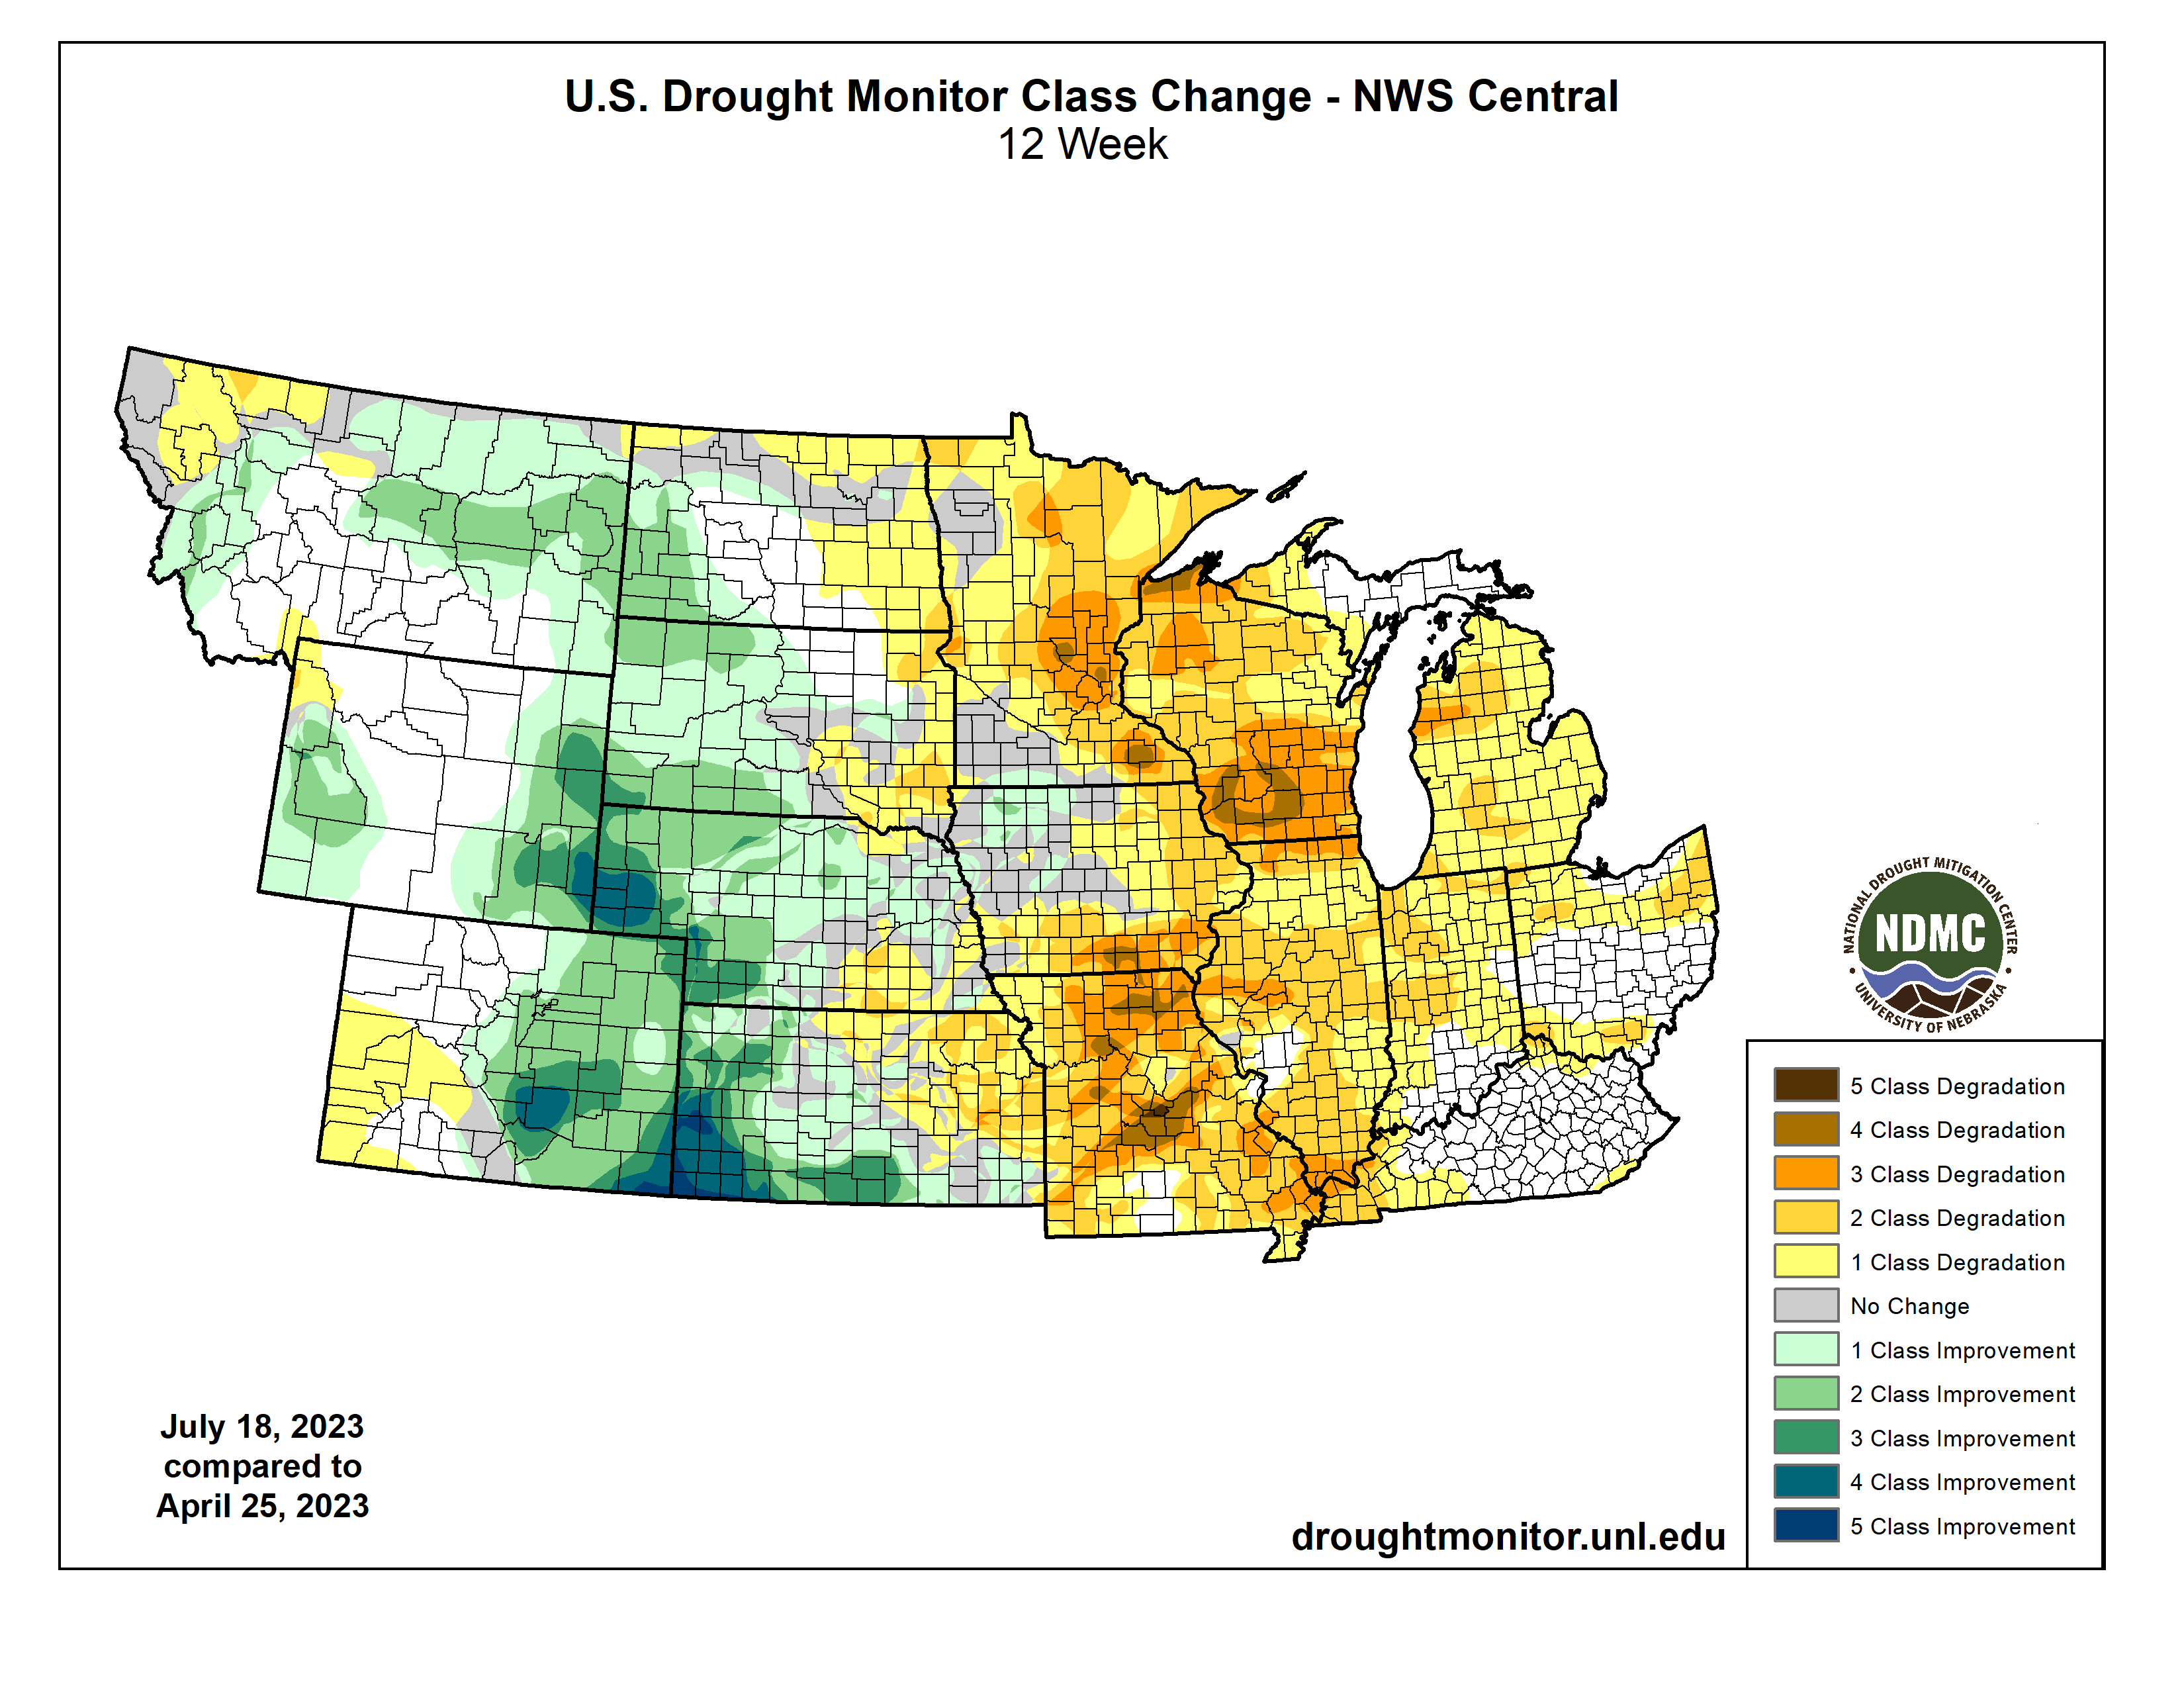
Figure 5: Topsoil Moisture (Percent Rated Short to Very Short) – Week ending July 23, 2023
Mississippi River Conditions, Impacts, and Outlook
- Recent rainfall in the Ohio River Basin has helped improve river stages in the Lower Mississippi River (below Cairo, IL) where there were issues with low river stages a few weeks ago (Figure 6).
- However, the Upper Mississippi River is experiencing low water stages. The river at St. Louis, MO continues to steadily fall and just fell below 0 feet on Tuesday, July 25 (Figure 7).
- The low flow conditions, particularly in Minnesota, are nearing low-flow triggers for hydropower operators. In fact, one hydroelectric dam near St. Cloud, Minnesota has already shut down all turbines due to low flow.
- The U.S. Army Corps of Engineers is working to maintain the 9-foot navigation channel on the Mississippi River, with 11 dredges in the upper portion of the river and 6 additional dredges on the lower portion. Dredging crews continue to operate 24 hours per day (compared to the normal 12 hours) throughout the length of the Mississippi River and have allowed the river to remain open and operating thus far.
- The low water season on the Mississippi River does not usually begin until late July into August, which is concerning as the climatological low-flow season is still yet to come.
- Long-range river forecasts from the NOAA North Central River Forecast Center shows that stages along the Upper Mississippi River are expected to continue to decrease over the next 28 days (Figure 8). Dubuque, IA, Rock Island, IL, and Burlington, IA have the potential to be within one foot of the record low water stage.
Figure 6: Ohio River Stage at Cairo, IL as of July 26, 2023
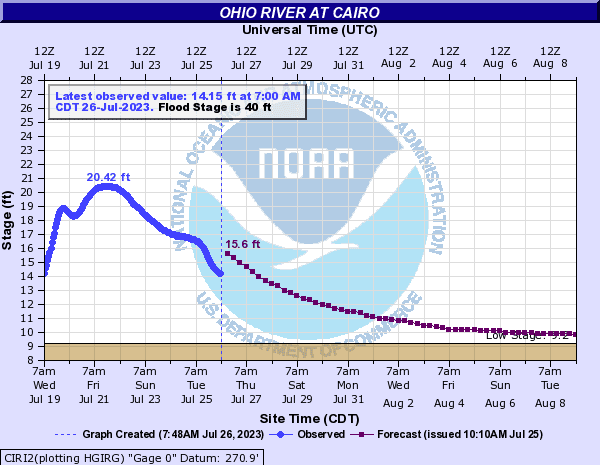
Figure 7: Mississippi River Stage at St Louis, MO as of July 26, 2023
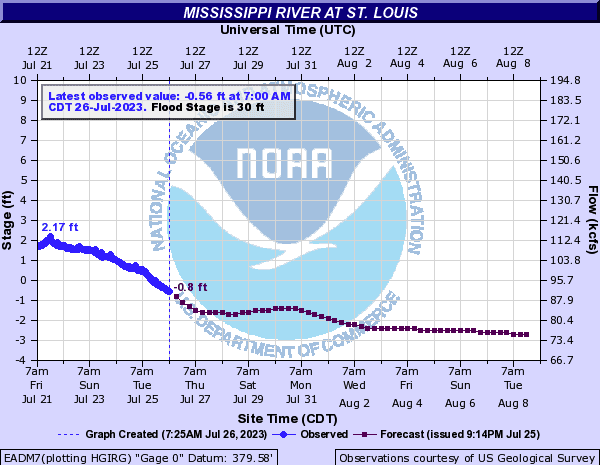
Figure 8: Current and Forecast Stages on the Upper Mississippi River Compared to Historical Events
Agriculture and Other Impacts
- Despite improvement in some areas, drought impacts remain prevalent across the north central U.S. including significant impacts to vegetation, agriculture, water supply, recreation, tourism, and increasing fire risk.
- The recent rainfall and cooler temperatures have helped improve crop conditions across the north central U.S., with many states reporting the majority of corn crops are in good to excellent condition (Figure 9). However, the states with the most intense drought conditions (Missouri, Wisconsin, Illinois, and Michigan) are reporting that less than half of the corn crop is in good to excellent condition. Specialty crops like pumpkin, watermelon, and onion are stressed from drought conditions.
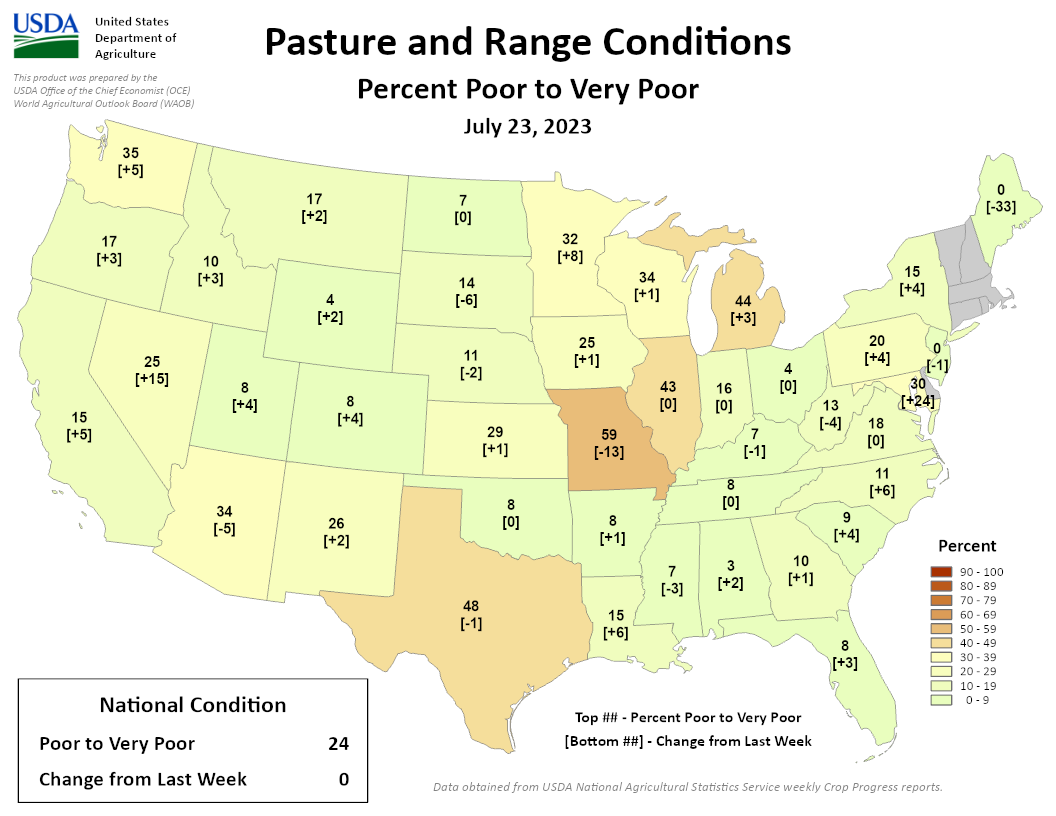
- Pasture and range conditions are reported as poor to very poor across 59% of Missouri (a 13% improvement from last week), 44% of Michigan, 43% of Illinois, 34% of Wisconsin, and 32% of Minnesota (Figure 10). Some producers in Missouri are hauling water to livestock and selling livestock in response to the lack of water and feed. Producers in Iowa, Nebraska and South Dakota are feeding hay earlier in the year due to poor forage conditions, and more hay is being sold for this time of year.
- Low water levels and high water temperatures caused the deaths of nearly 21,000 shovelnose sturgeon along a 60-mile stretch of the Des Moines River in Iowa from Ottumwa to Farmington.
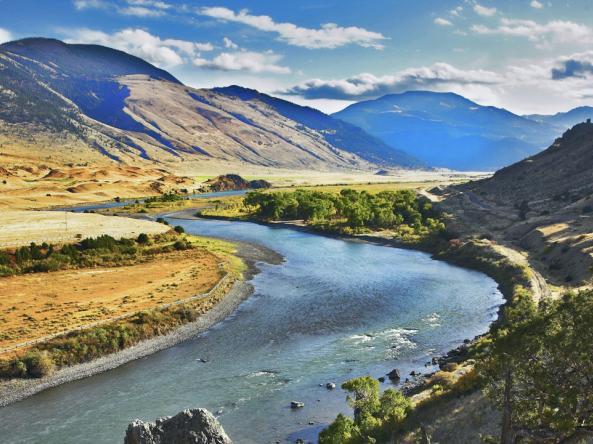
- Rivers and streams in northwest Montana are running at or near historic lows for late July, prompting Montana Fish, Wildlife and Parks to urge local anglers to reduce stress on native cold-water trout for the remainder of the summer, or else face the prospect of restrictions or closures.
- Recreation and tourism have been impacted in some areas. In Minnesota, low river and lake levels have caused issues for boaters by damaging propellers in shallow waters, visitor attendance at Starved Rock State Park in Illinois has been down as the waterfall was not flowing, and boat docks are empty as Flathead Lake in Montana is low.
- Water supply and access has become an increasing issue in many areas. Some cities in Iowa, Missouri, and Illinois are implementing water conservation measures.
Figure 9: Corn Conditions (Percent Good to Excellent) – As of July 23, 2023
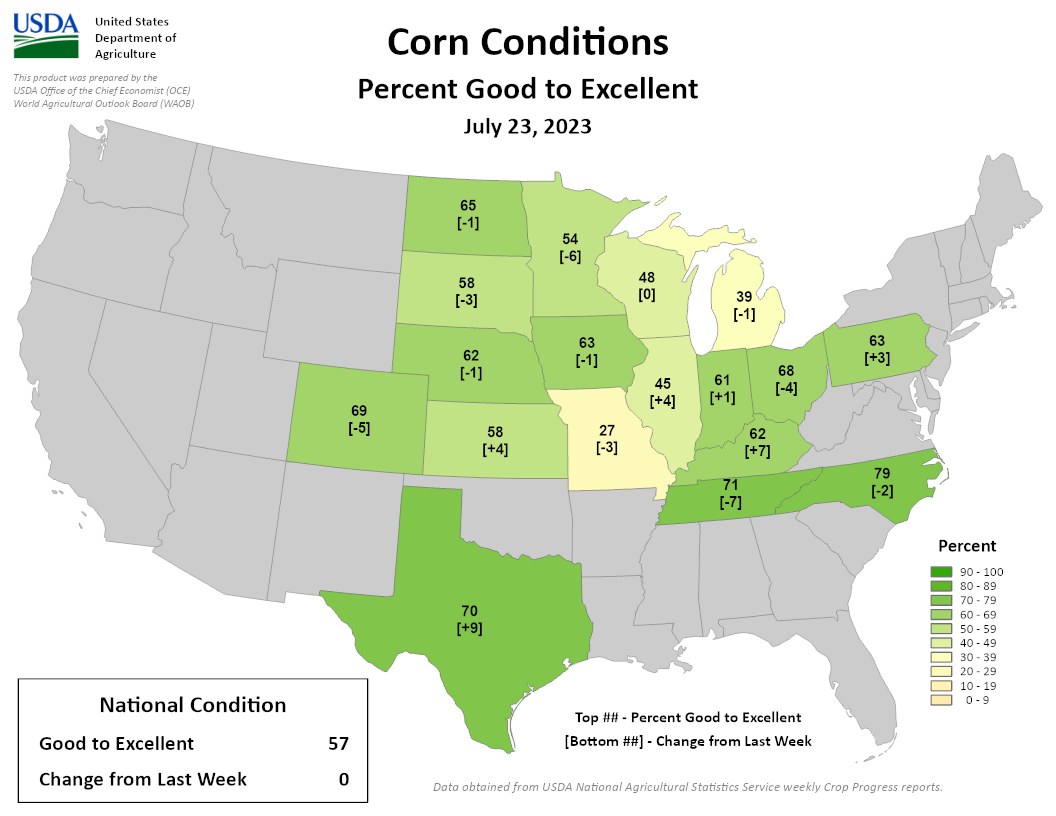
Figure 10: Pasture and Range Conditions (Percent Poor to Very Poor) – As of July 23, 2023
Outlook and Potential Impacts
- This week is expected to bring hot conditions to a majority of the north central U.S., and some areas are also expected to receive little to no rainfall, which could worsen drought conditions across the region.
- Portions of the Upper Midwest (Wisconsin, Michigan) could receive decent rainfall between July 26–August 2, which would help drought conditions (Figure 11). However, dry areas like Missouri, Kansas, Iowa, Illinois, and eastern Nebraska are projected to receive very little rainfall.
- Hazardous heat is expected across the north central U.S. during the July 28–August 1 time frame (Figure 12). Forecasted highs are expected to be in the mid- to upper-90s across much of the region, with temperatures over 100°F in Kansas, Missouri, Iowa, Nebraska, and South Dakota.
- Corn progress is very delayed in Ohio and Michigan, most not reaching tasseling yet, and therefore the corn in these states are at risk of yield loss from the upcoming extreme heat. Soybeans are less at risk unless the heat persists well into August. Other non-irrigated crops are also susceptible to stress from the coming hot and dry conditions.
- Other potential impacts of the hot and drier conditions over the next week include increased risk to human and animal health, negative ecological impacts, and increased potential for wildfires.
- Above-normal temperatures are likely to continue across a majority of the region in early August, with the possibility for below-normal temperatures across eastern portions of the region (Figure 13). Above-normal rainfall is more likely in the Plains from August 2-8, with near-normal rainfall elsewhere (Figure 14).
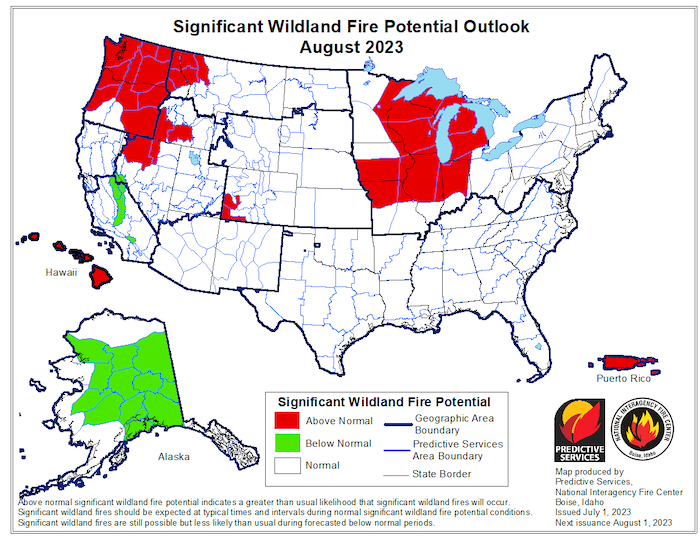
- Figure 15 shows locations with above-normal significant wildland fire potential during August 2023, which includes the central and upper Midwest areas across Illinois, Indiana, Iowa, Michigan, Minnesota, Missouri, and Wisconsin.
Figure 11: Quantitative Precipitation Forecast for the Next 7 Days (July 26–August 2, 2023)
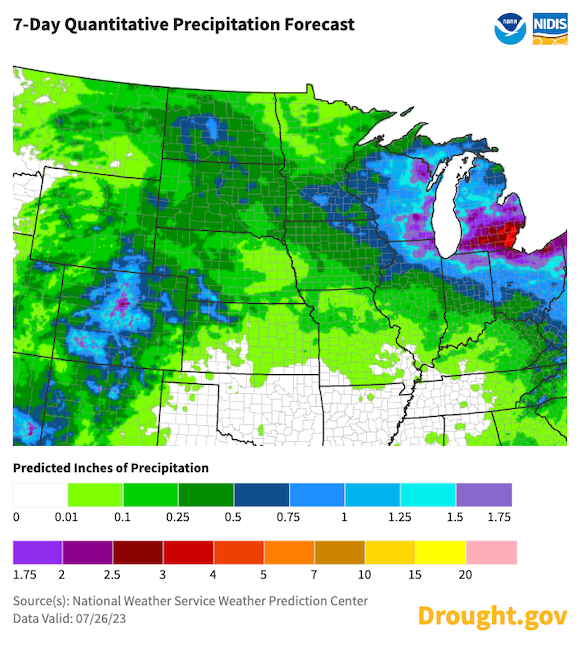
Figure 12: Day 3–7 U.S. Hazards Outlook (Valid July 28–August 1, 2023)
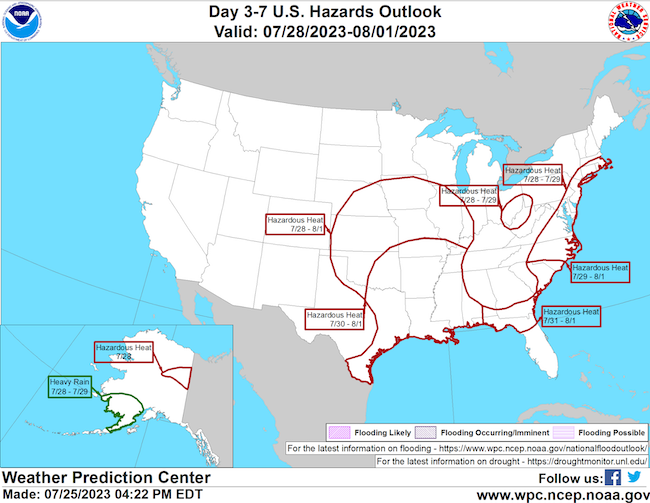
Figure 13: 8–14 Day Precipitation Outlook (Valid August 2–8, 2023)
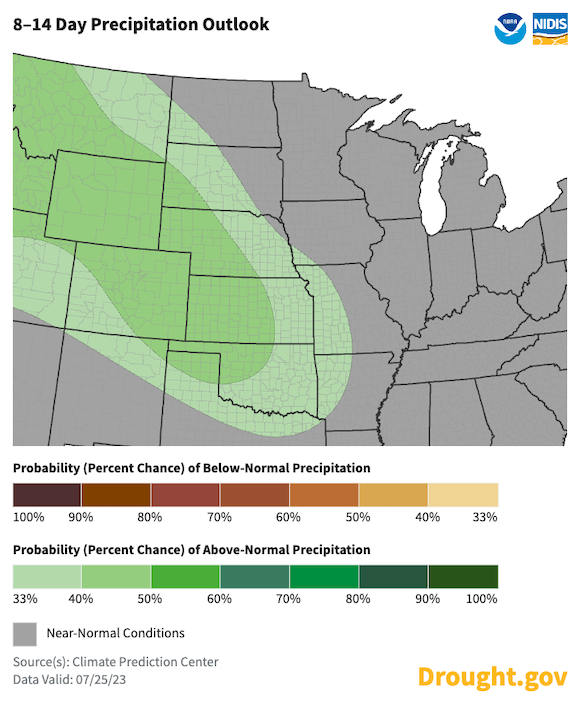
Figure 14: 8-14 Day Temperature Outlook (Valid August 2–8, 2023)
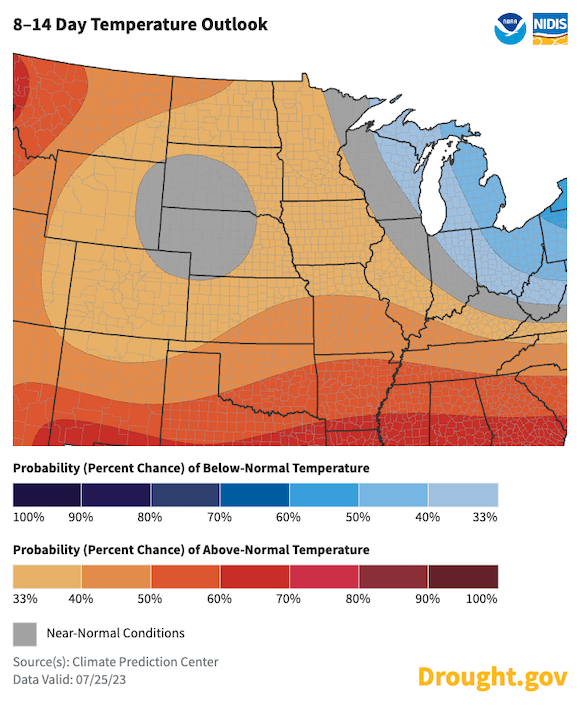
Figure 15: Significant Wildland Fire Potential Outlook for August 2023
Resources for Monitoring Drought and Heat Risk
- Keep track of the risk for extreme heat in the next 3–7 days with the U.S. Day 3–7 Hazards Outlook.
- Keep track of the risk of rapid drought onset and heat risk in the next 8–14 days with the U.S. Week 2 Hazards Outlook.
- Keep track of how much soil moisture there is compared to normal with various soil moisture products.
- Keep track of temperatures across the region with the Midwest Climate Watch Daily Maps for the Central U.S.
Heat Health Resources
- Climate and Health Outlook – July 2023 from the U.S. Department of Health and Human Services.
- Heat Illness Prevention information from the National Integrated Heat Health Information System (NIHHIS).
- Tips on staying safe in extreme heat from the Centers for Disease Control and Prevention (CDC).
- Heat Safety Tips and Resources from the National Weather Service.
For More Information
- NIDIS and its partners will issue future updates as conditions evolve.
- A special thank you to the state climate offices in the Midwest and Missouri River Basin for providing local information on drought conditions and impacts included in the webinar and on this report.
- The most recent North Central U.S. Climate and Drought Summary & Outlook Webinar took place on July 20, 2023 (watch recording). Register for the next webinar on August 17, 2023.
- More local information is available from the following resources:
- To report or view local drought impact information:
- Report your Drought Impacts through Condition Monitoring Observer Reports (CMOR).
- View CoCoRaHS Condition Monitoring reports.
Prepared By
Molly Woloszyn
NOAA/National Integrated Drought Information System (NIDIS), CIRES/CU Boulder
Doug Kluck
NOAA/National Centers for Environmental Information
Dennis Todey & Laurie Nowatzke
USDA Midwest Climate Hub
Dannele Peck
USDA Northern Plains Climate Hub
Audra Bruschi
NOAA/National Weather Service (NWS)
Kevin Low, Jim Noel, and Mike Welvaert
NOAA/NWS Missouri Basin River Forecast Center
Anna Wolverton
U.S. Army Corps of Engineers Mississippi Valley Division/NOAA National Weather Service
Melissa Widhalm
Midwestern Regional Climate Center/Purdue University
Gannon Rush & Rezaul Mahmood
High Plains Regional Climate Center/University of Nebraska-Lincoln
Hunter Jones
NOAA/National Integrated Heat Health Information System
This Drought Status Update is issued in partnership between the National Oceanic and Atmospheric Administration (NOAA) and the U.S. Department of Agriculture (USDA) to communicate a potential area of concern for drought expansion and/or development within the North Central U.S. based on recent conditions and the upcoming forecast. NIDIS and its partners will issue future Drought Status Updates as conditions evolve.