Late-Summer Rain Could Improve Conditions in Kansas and Oklahoma, while Drought-Stricken Southern Texas Falls Short
Key Points
- Extreme to Exceptional Drought (D3–D4) persists along parts of the Rio Grande and Edwards Plateau regions of Texas.
- Moderate Drought (D1) returned to Oklahoma, according to the U.S. Drought Monitor, but rain this week may improve conditions.
- While significant rainfall improved conditions this week, Moderate to Severe Drought (D1-D2) continues in parts of northern Kansas. Meanwhile, drought was removed in southern Kansas. Cheney Lake, which provides water for Wichita, Kansas, is at 99% of capacity for the first time since 2022.
- Late summer showers are expected to improve dry conditions in Kansas and Oklahoma.
- Seasonal outlooks favor drought persistence and expansion, and high summer temperatures may mean recent improvements are short-lived.
This update is based on data available as of Tuesday, August 26, 2025 at 9 a.m. CT. We acknowledge that conditions are evolving.
This map shows the amount of liquid precipitation (in inches) forecast to fall over the next 7 days (August 25–September 1, 2025), according to the National Weather Service.
U.S. Drought Monitor from August 19, 2025. The U.S. Drought Monitor depicts the location and intensity of drought across the country using 5 classifications: Abnormally Dry (D0), showing areas that may be going into or are coming out of drought, and four levels of drought (D1–D4).
The U.S. Drought Monitor is a joint effort of the National Drought Mitigation Center, U.S. Department of Agriculture, and National Oceanic and Atmospheric Administration.
Drought is defined as the lack of precipitation over an extended period of time, usually for a season or more, that results in a water shortage. Changes in precipitation can substantially disrupt crops and livestock, influence the frequency and intensity of severe weather events, and affect the quality and quantity of water available for municipal and industrial use.
Learn MoreA drought index combines multiple drought indicators (e.g., precipitation, temperature, soil moisture) to depict drought conditions. For some products, like the U.S. Drought Monitor, authors combine their analysis of drought indicators with input from local observers. Other drought indices, like the Standardized Precipitation Index (SPI), use an objective calculation to describe the severity, location, timing, and/or duration of drought.
Learn MorePeriods of drought can lead to inadequate water supply, threatening the health, safety, and welfare of communities. Streamflow, groundwater, reservoir, and snowpack data are key to monitoring and forecasting water supply.
Learn MoreDrought can reduce the water availability and water quality necessary for productive farms, ranches, and grazing lands, resulting in significant negative direct and indirect economic impacts to the agricultural sector. Monitoring agricultural drought typically focuses on examining levels of precipitation, evaporative demand, soil moisture, and surface/groundwater quantity and quality.
Learn MorePredicted Inches of Precipitation
Less than 0.01 inch
0.01 to 0.1 inch
0.1 to 0.25 inch
0.25 to 0.5 inch
0.5 to 0.75 inch
0.75 to 1 inch
1 to 1.25 inches
1.25 to 1.5 inches
1.5 to 1.75 inches
1.75 to 2 inches
1.5 to 2 inches
2 to 2.5 inches
2.5 to 3 inches
3 to 4 inches
4 to 5 inches
5 to 7 inches
7 to 10 inches
10 to 15 inches
15 to 20 inches
More than 20 inches
U.S. Drought Monitor Categories
Abnormally Dry (D0)
Abnormally Dry (D0) indicates a region that is going into or coming out of drought. View typical impacts by state.
Moderate Drought (D1)
Moderate Drought (D1) is the first of four drought categories (D1–D4), according to the U.S. Drought Monitor. View typical impacts by state.
Severe Drought (D2)
Severe Drought (D2) is the second of four drought categories (D1–D4), according to the U.S. Drought Monitor. View typical impacts by state.
Extreme Drought (D3)
Extreme Drought (D3) is the third of four drought categories (D1–D4), according to the U.S. Drought Monitor. View typical impacts by state.
Exceptional Drought (D4)
Exceptional Drought (D4) is the most intense drought category, according to the U.S. Drought Monitor. View typical impacts by state.
This map shows the amount of liquid precipitation (in inches) forecast to fall over the next 7 days (August 25–September 1, 2025), according to the National Weather Service.
U.S. Drought Monitor from August 19, 2025. The U.S. Drought Monitor depicts the location and intensity of drought across the country using 5 classifications: Abnormally Dry (D0), showing areas that may be going into or are coming out of drought, and four levels of drought (D1–D4).
The U.S. Drought Monitor is a joint effort of the National Drought Mitigation Center, U.S. Department of Agriculture, and National Oceanic and Atmospheric Administration.
The Quantitative Precipitation Forecast maps on Drought.gov are updated once a day and are valid from 7 a.m. Eastern that day.
This U.S. Drought Monitor is released every Thursday morning, with data valid through Tuesday at 7 a.m. ET.
Drought is defined as the lack of precipitation over an extended period of time, usually for a season or more, that results in a water shortage. Changes in precipitation can substantially disrupt crops and livestock, influence the frequency and intensity of severe weather events, and affect the quality and quantity of water available for municipal and industrial use.
Learn MoreA drought index combines multiple drought indicators (e.g., precipitation, temperature, soil moisture) to depict drought conditions. For some products, like the U.S. Drought Monitor, authors combine their analysis of drought indicators with input from local observers. Other drought indices, like the Standardized Precipitation Index (SPI), use an objective calculation to describe the severity, location, timing, and/or duration of drought.
Learn MorePeriods of drought can lead to inadequate water supply, threatening the health, safety, and welfare of communities. Streamflow, groundwater, reservoir, and snowpack data are key to monitoring and forecasting water supply.
Learn MoreDrought can reduce the water availability and water quality necessary for productive farms, ranches, and grazing lands, resulting in significant negative direct and indirect economic impacts to the agricultural sector. Monitoring agricultural drought typically focuses on examining levels of precipitation, evaporative demand, soil moisture, and surface/groundwater quantity and quality.
Learn MoreCurrent Conditions and Impacts for the Southern Plains
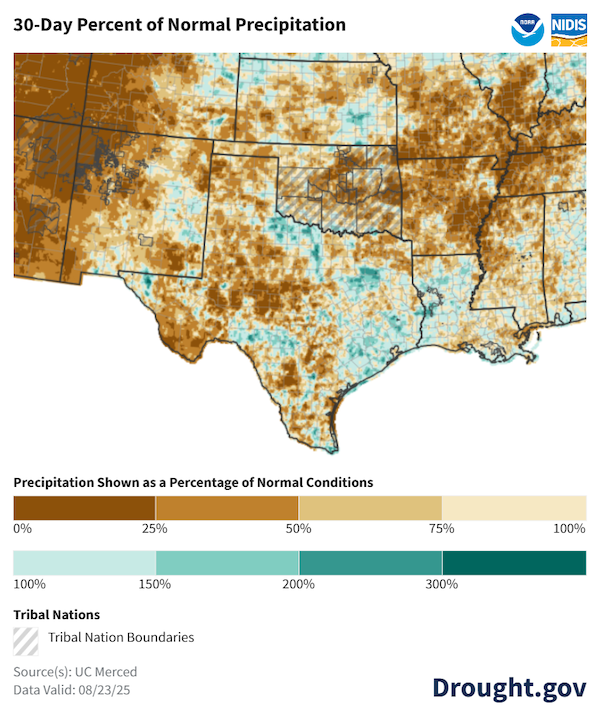
- Precipitation from mid-July through mid-August was below the 25th percentile for most of far southwest Kansas, eastern Oklahoma, and central and southern Texas.
- In Texas, Exceptional Drought (D4) contracted to two smaller areas over the southern South Central and the Big Bend regions, specifically Medina, Frio, and Brewster counties, according to the U.S. Drought Monitor.
- Long-term Extreme to Exceptional Drought (D3-D4) continues along the Rio Grande and Edwards Plateau regions of Texas.
- Regions impacted include Big Bend National Park and McMullen, Medina, and Bexar counties.
- San Antonio (in Bexar County) recently implemented Stage 3 water restrictions, which includes mandatory landscape watering restrictions.
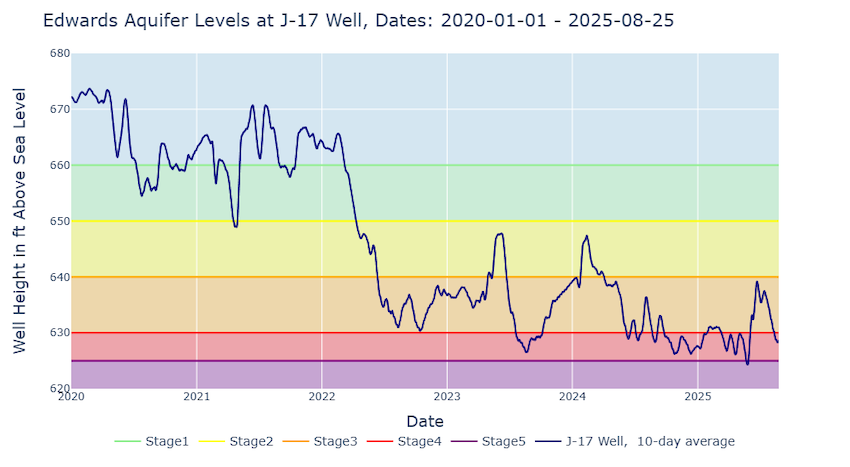
- Local reservoir and aquifer levels remain low as long-term drought persists across parts of the region.
- The Texas portion of the Rio Grande is very dry, and the low river conditions extend upstream into New Mexico. Elephant Butte Reservoir is currently at 3.8% full, and the Rio Grande ran dry in Albuquerque in late July.
- Many south-central Texas reservoirs remain low: Medina Lake is at 6.2% of conservation storage capacity. Choke Canyon Reservoir is at 12.2%. Falcon Reservoir is at 15.1%. Canyon Lake is at 67.9%.
- Moderate to Severe Drought (D1-D2) continues in parts of northern Kansas, but southern Kansas saw significant drought improvement over the summer months:
- Southern Kansas experienced ample precipitation over the past two months. Sedgwick County recorded its third wettest June on record, averaging just over 10.5 inches of rainfall. July rainfall was also above average with 5.5 inches. June and July combined had more than 16 inches and ranked as the 4th wettest on record.
- Parts of Butler and Cowley Counties in south-central Kansas received more than 24 inches of rain in June and July combined.
- Cheney Lake, which provides water for Wichita, returned to near-normal levels—99% of capacity—as of August 21, 2025. Despite the recent precipitation and reservoir rise, the City of Wichita remains in Stage 2 drought status based on the 12-month average at Cheney Lake.
- Dryness persisted in parts of north-central, northeast, and east-central Oklahoma for more than 40 days according to data from the Oklahoma Mesonet.
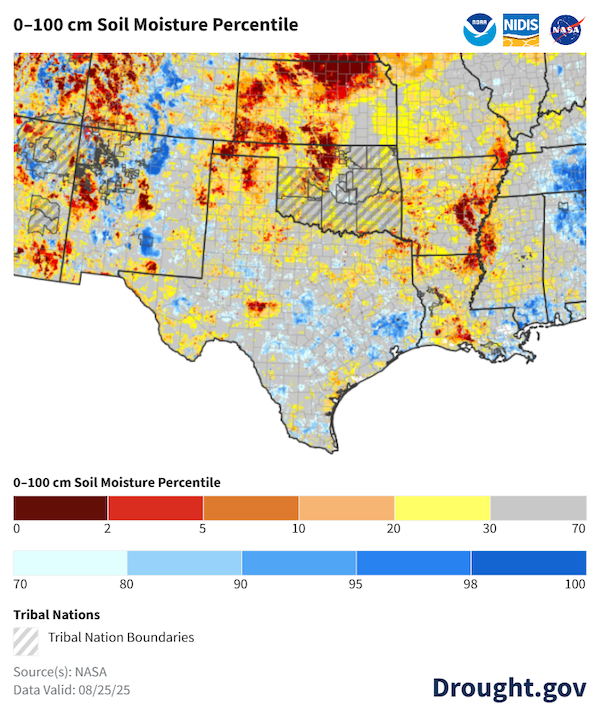
- Soil moisture continued to diminish over the last 30-60 days, with nearly desiccated soils evident across southwestern Oklahoma, extending north and east into east-central parts of Kansas.
Mid-July to Mid-August Precipitation Was Below Normal Across Most of the Southern Plains
Soil Moisture Continued to Decline in Western Oklahoma and Central-to-Northern Kansas
Edwards Aquifer in Stage 4 Drought with Low Groundwater Levels
Outlooks and Potential Impacts in the Southern Plains
- Significant rainfall this week will help reduce developing dryness in Oklahoma and Kansas, but much of Texas will likely miss out on most of the heavy rain.
- The National Weather Service Climate Prediction Center’s 6-10 and 8-14 day outlooks favor above-normal precipitation for Kansas, Oklahoma, and Texas. Outlooks show mostly below-normal temperatures for much of the region, except for southern Texas, where the Lower Rio Grande Valley can expect above-normal temperatures.
- Odds very slightly favor below-normal precipitation for the Southern Plains, according to September climate outlooks. Temperatures are expected to be above normal in the month ahead.
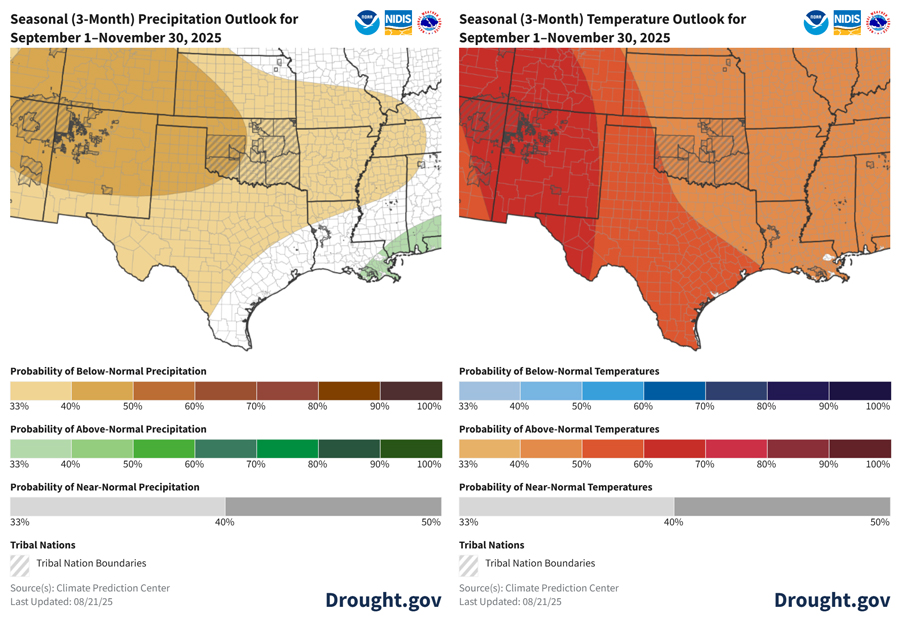
- The September–November outlooks favor above-normal temperatures across the Southern Plains and a 40-50% chance of below-normal precipitation for the Texas and Oklahoma Panhandles region into southwest Kansas. Odds only slightly favor below-normal precipitation elsewhere in the region, except for an equal chance of above-, near-, or below-normal precipitation along the Gulf Coast and far northwest Kansas.
- The National Weather Service Climate Prediction Center’s seasonal outlooks and global climate patterns favor drought persistence along the Rio Grande and expansion over western Kansas and far western Texas.
- The El Niño–Southern Oscillation (ENSO) is currently neutral.
- ENSO-neutral means neither El Niño nor La Niña is driving current weather patterns for the Southern Plains, and we lean more heavily on other climate patterns when making seasonal forecasts, rarely deviating far from normal conditions.
- A La Niña watch is in place as forecasts show slightly elevated odds that a La Niña pattern will develop in the fall. This will increase chances for a dry fall for most of Texas, with little impact on Oklahoma and Kansas.
- The Pacific Decadal Oscillation (PDO) is still below -1.
- A negative PDO has a similar, albeit weaker, influence on Southern Plains weather patterns as La Niña. When the two occur together, they amplify each other’s impacts. In the fall months, a negative PDO correlates with less precipitation and higher temperatures in parts of the Southern Plains, especially southern Texas.
- The PDO has been negative since January 2020 and reached a new minimum of -4.0 in July 2025, the lowest value in modern history.
Summer Will Likely Be Warmer and Drier for the Southern Plains
Resources
- Upcoming event: September Virtual Cafe: Doing Community Engaged Work in the Great Plains, September 12 at 1 p.m. CT/12 p.m. MT.
- In case you missed it:
- Southern Regional Climate Center
- USDA Southern Plains Climate Hub
- South-Central Climate Adaptation Science Center
- More local information is available from the following resources:
- To report or view local drought impact information:
Prepared By
Joel Lisonbee, Kelsey Satalino Eigsti, and Eleanor C. Hasenbeck
Cooperative Institute for Research in Environmental Sciences/University of Colorado, Boulder and NOAA’s National Integrated Drought Information System, Southern Plains Drought Early Warning System
B.J. Baule, Alison Tarter, and John Nielsen-Gammon
Texas State Climate Office, Southern Regional Climate Center, Texas A&M University
Gary McManus
Oklahoma Climatological Survey, State Climatologist
Matthew Sittel
Kansas Climate Office, Kansas State University
This Drought Status Update is issued in partnership between the National Oceanic and Atmospheric Administration (NOAA) and and partners across the Southern Plains Drought Early Warning System to communicate a potential area of concern for drought expansion and/or development within the Southern Plains region based on recent conditions and the upcoming forecast. NIDIS and its partners will issue future Drought Status Updates as conditions evolve.


