Data and Decisions: Creating Actionable Soil Moisture and Snowpack Information in the Upper Missouri River Basin
The Upper Missouri River Basin is home to a growing network of automated weather stations designed to observe and monitor weather and soil conditions. Over the past several years, the U.S. Army Corps of Engineers has been working with state mesonets to install or augment 540 stations to improve drought and flood monitoring in the Upper Missouri River Basin (UMRB) as part of the Congressionally funded, multi-agency UMRB Soil Moisture and Plains Snowpack Project.
Soil moisture and snowpack data serve as a tool to support critical decisions: farmers rely on it to decide when to plant crops; forecasters and communities use it for flood warnings; and federal scientists use it to monitor and identify drought. A recent NIDIS-funded study within the UMRB project found strong interest in using soil moisture and snowpack data across sectors and opportunities to further expand and maximize such use by refining communications and providing data in more accessible formats.
The End User Engagement Study, a component of the NIDIS’s Upper Missouri River Basin Data Value Study, explored how mesonet data can support day-to-day needs of users who rely on soil moisture, snowpack, and weather information.
Led by Kristal Jones at JG Research, this project’s findings will help NIDIS, network operators, and other providers of public information better tailor future resources and tools to maximize the value of data coming from new stations.
With a New Data Stream, a Thirst for Interpretation
Through a mix of surveys and interviews, JG Research asked individuals about their experience with soil moisture and snowpack data in the UMRB. Forty-six individuals from across the basin completed the survey, and twenty individuals participated in interviews. Poll information was also gathered from attendees at two 2025 webinars about the UMRB Soil Moisture and Snowpack Maps Dashboard.
Across sectors, stakeholders said soil moisture and snowpack data were valuable to their work, but also revealed that barriers still remain in putting data to best possible use.
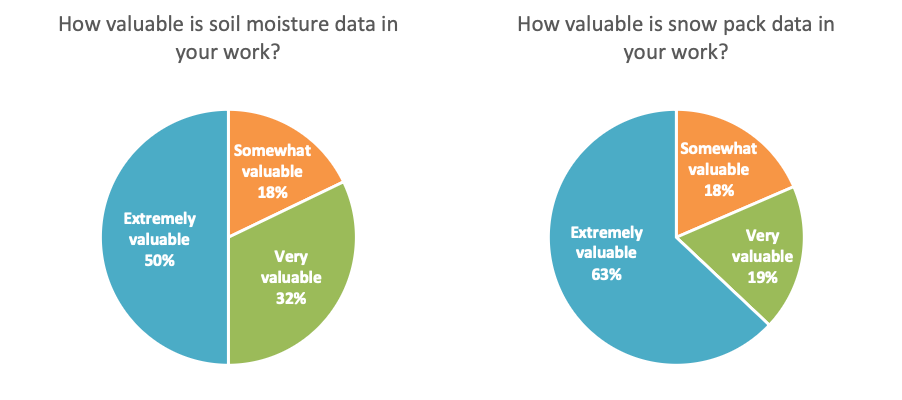
Survey participants came from the private sector, federal agencies, state and local government, universities, and tribal agencies. Their work spans diverse sectors, including agriculture, resource management, energy, infrastructure, and recreation. Although participants agreed the information was valuable, not all respondents actually used this data. 83% of respondents identified both soil moisture and snowpack data as either very or extremely valuable in their work. However, only 61% of respondents reported currently using each type of data.
The mismatch between interest and use was tied to barriers in either finding or interpreting information. For soil moisture data, 44% of those not using data reported they were limited by not knowing how to use or interpret the information. An additional 22% reported that they were not certain where to find soil moisture data. For snowpack, the same top two barriers emerged.
However, those survey and interview respondents who currently use data identified multiple applications, indicating that addressing challenges to access could benefit a variety of users, ranging from scientific applications behind the scenes, to supporting daily decision-making in agricultural fields, floods, and more.
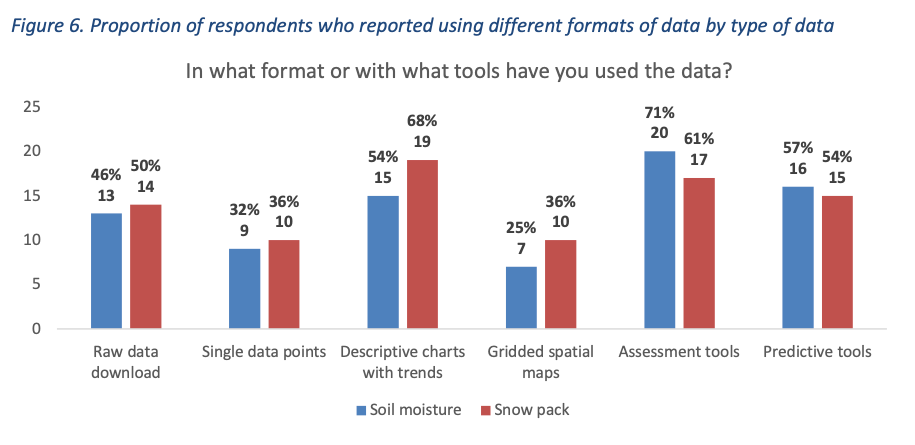
This data is also critical to improving land-surface and hydrologic models. Study participants from federal and state agencies underscored the essential role of on-the-ground data used to ensure more accurate satellite products and models. These models, in turn, are vital to drought, wildfire, and flood forecasting.
Agricultural participants used soil moisture information in both seasonal and daily decision-making: determining planting dates, identifying crop rotations, planning irrigation (for farmers), and understanding forage production for grazing (for ranchers). Multiple kinds of data were useful to support insurance claims and emergency-relief programs. Station data also legitimized people’s day-to-day experiences of weather variability, building trust in reported data and information.
Not all survey respondents saw a direct connection between their work and soil moisture or snowpack data. Those who focused on long-term planning were less likely to find the new station data immediately valuable, because their work often looks at trends or changes over time. These uses rely on long periods of record these new stations cannot yet provide. Some respondents working in infrastructure, construction, and transportation did not use soil moisture or snowpack data in their work because, in many cases, existing protocols for planning and operations do not incorporate information of this type.
While making data maximally applicable for multiple user types depends on how the data is used, several common themes emerged. Data users across sectors looked for:
- Consistent data quality and availability (continuity), which depends on robust and ongoing network operations and maintenance
- Streamlined and transparent data access
- Targeted spatial coverage to add stations in regions where on-the-ground data are not already available
- Communication and translation of information for non-technical users, such as interpretive text, intuitive graphs and graphics, or training sessions.
The UMRB build-out is entering its final year. As new data streams come online, findings from the End User Survey will guide information providers on how to leverage these new datasets to best support their stakeholders.