The Drought Data Dashboard (D3): A System for Open, Transparent, and Local Drought Monitoring
When drought intensifies, decisions cannot wait. Ranchers decide when to move livestock, water managers balance reservoir operations, and emergency managers coordinate drought response. Yet the information guiding those decisions is often scattered across multiple websites, difficult to compare, and challenging to translate into action.
To help close that gap, the Montana Climate Office has launched the Drought Data Dashboard (D3, pronounced “D three”), a free, open-source web platform that delivers daily drought information across the contiguous United States. Designed for drought assessors, producers, water managers, researchers, and the public, D3 brings together leading drought datasets into a single interactive platform while making every method, dataset, and line of code accessible and transparent.
D3 is the culmination of nearly a decade of collaboration. The platform grew from the Upper Missouri River Basin Drought Dashboard, developed after the 2017 Northern Plains flash drought exposed the need for more transparent and accessible drought information. With support from NOAA’s National Integrated Drought Information System (NIDIS), the Montana Climate Office worked closely with the Montana Department of Natural Resources and Conservation (DNRC); Montana’s Governor's Drought and Water Supply Advisory Committee (DWSAC); agricultural producers; federal, Tribal, and state partners; and other collaborators to build a tool around real operational needs. Rather than developing technology first and searching for applications later, the dashboard evolved through continuous feedback from the people responsible for drought monitoring, planning, and response. The new dashboard will serve as a forum for enhanced coordination and co-development of modern drought assessment approaches through the National Science Foundation (NSF) sponsored Northern Great Plains Regional Resiliency Incubator in Drought Resiliency (NGP RIDR).
“D3 provides transparent, science-based drought information in a format that helps producers, water managers, and drought assessors make informed decisions,” said Michael Downey, Drought Program Coordinator at the Montana DNRC and D3 collaborator and co-producer. “It’s an important step forward for drought monitoring and collaboration.”
Today, D3 provides daily drought information across the contiguous United States. Users can explore precipitation, atmospheric demand, temperature, snowpack, streamflow, and multiple drought indicators across timescales ranging from 15 days to 2 years. They can compare conditions across space and time, retrieve values for any location, overlay U.S. Drought Monitor classifications and administrative boundaries, and incorporate observations from United States Geological Survey (USGS) streamgages and thousands of Global Historical Climatology Network (GHCN) climate and weather stations.
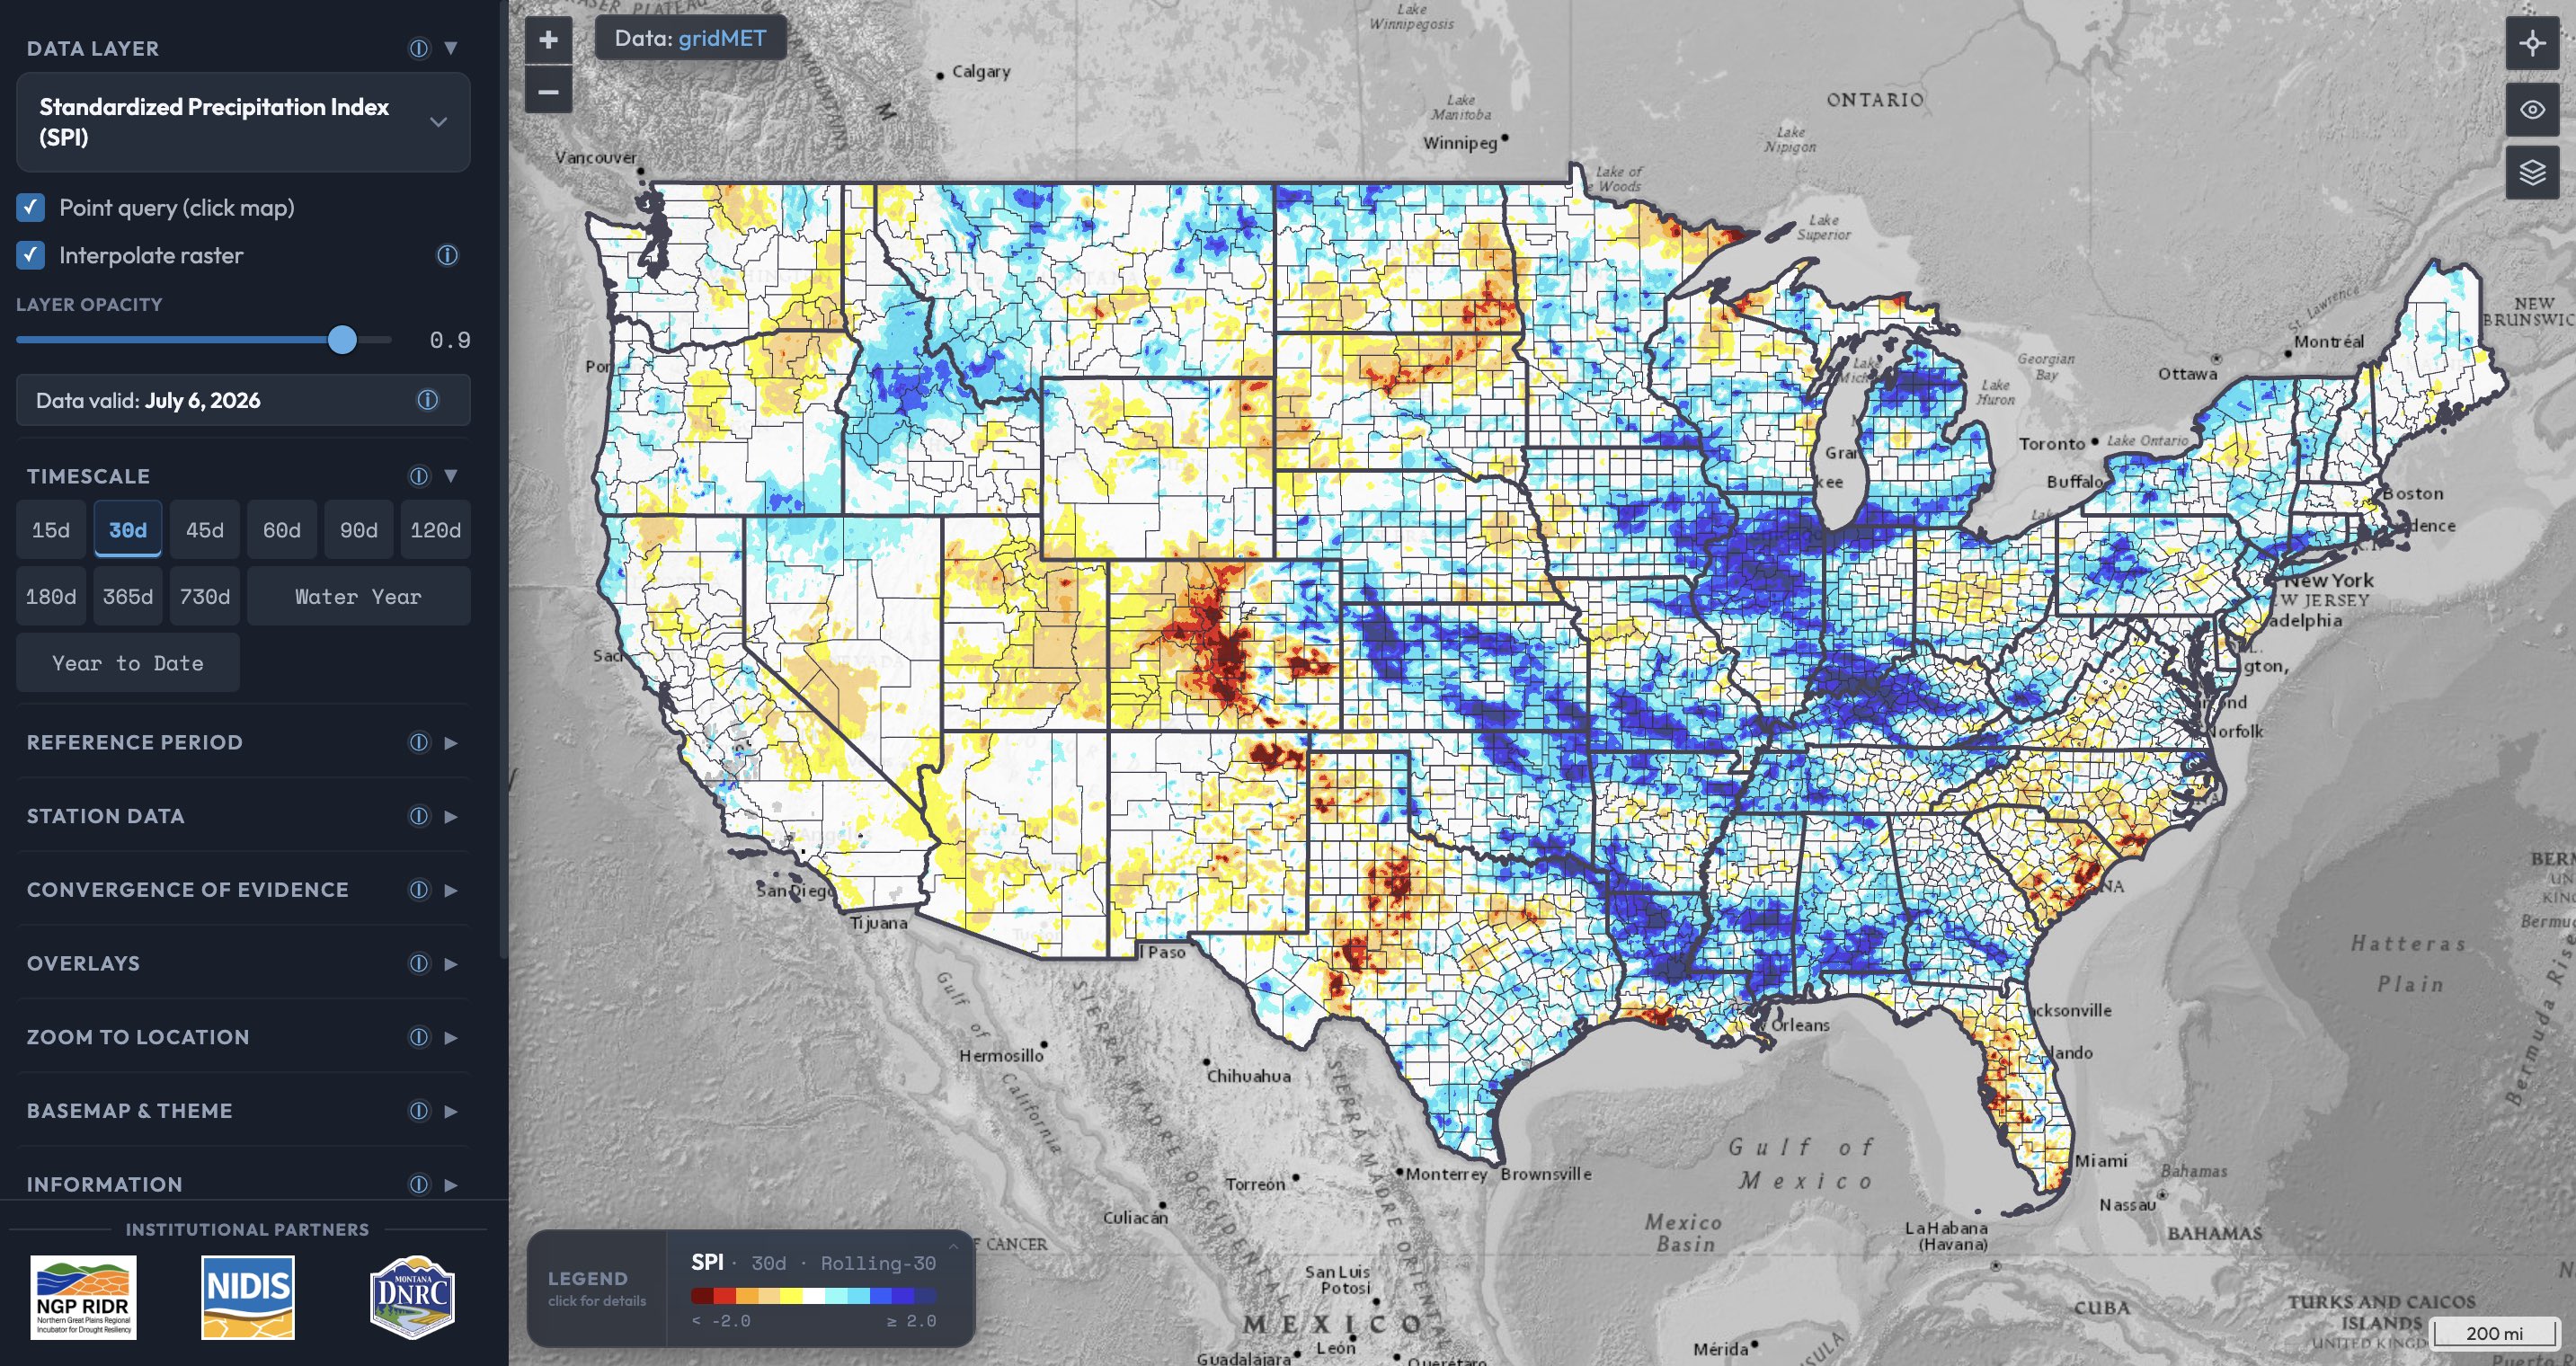
Several innovations distinguish D3 from traditional drought monitoring platforms. Users can choose among multiple climatological reference periods, including a rolling 30-year baseline, the World Meteorological Organization’s 1991–2020 climate normal, and the full period of record, making processes like aridification something users can explore rather than simply read about. The dashboard also includes a Convergence of Evidence tool that allows users to combine multiple drought indicators into a single composite map with reproducible and transparent methods, reflecting the way climatologists evaluate drought by considering multiple lines of evidence instead of relying on a single index. Regional datasets, including observations from state mesonet weather and soil moisture networks, can also be integrated through flexible plugin architecture that allows local information to appear seamlessly alongside national products.
Beyond visualization, D3 serves as an operational data platform. Every layer is published as a Cloud-Optimized GeoTIFF and can be accessed directly from GIS software, R, Python, or other scientific workflows. Whether someone wants to view conditions on a smartphone, prepare a drought assessment, or build a new application, everyone is working from the same openly available information.
The dashboard also provides a foundation for future decision-support tools created by the larger drought monitoring community. As new products become operational, including knowledge-guided machine learning predictions of streamflow and soil moisture developed through the RIDR, they can be integrated directly into the D3 platform. Continued expansion of D3 is supported through ongoing partnerships, including the NSF NGP RIDR, NOAA/NIDIS, and recent Congressionally directed spending secured by the office of Senator Tim Sheehy.
"NIDIS and the Montana Climate Office have been working together for almost 10 years to transform how we understand and respond to drought,” said Veva Deheza, NIDIS Executive Director. “By consolidating complex climate datasets into a single, transparent, and open-source platform, the Drought Data Dashboard empowers everyone—from ranchers and water managers to the general public—to make confident, evidence-based decisions when it matters most."
The release of D3 comes as the drought community is increasingly focused on modernizing drought assessment. The recently released National Academies of Sciences, Engineering, and Medicine consensus study, Improving Future U.S. Drought Assessment, calls for drought assessments that integrate multiple lines of evidence, use transparent and reproducible methods, and better account for climate nonstationarity.
At its core, D3 is built on the idea that drought information should be treated like public infrastructure: open, transparent, and available to everyone who depends on it. The platform was shaped through years of engagement with the drought community and designed around the practical needs of drought assessment and decision-making. Whether someone is managing a ranch, allocating water, preparing for wildfire, or conducting research, they should be able to access the same high-quality information, understand how it was produced, and use it with confidence.
The Drought Data Dashboard is available free of charge at d3drought.org.