California-Nevada Awaits Potential Impacts of the Strong El Niño
Key Points
- Currently, 88% of Nevada is in drought (D1-D3) according to the U.S. Drought Monitor, with 6% in Extreme Drought (D3). Meanwhile, only 7% of California is in drought (D1-D2) with an additional 58% Abnormally Dry (D0).
- Drought in the Colorado River Basin has persisted as isolated monsoon rains provided only minor relief for the basin’s water supply challenges. Both Lake Mead and Lake Powell are at critically low levels.
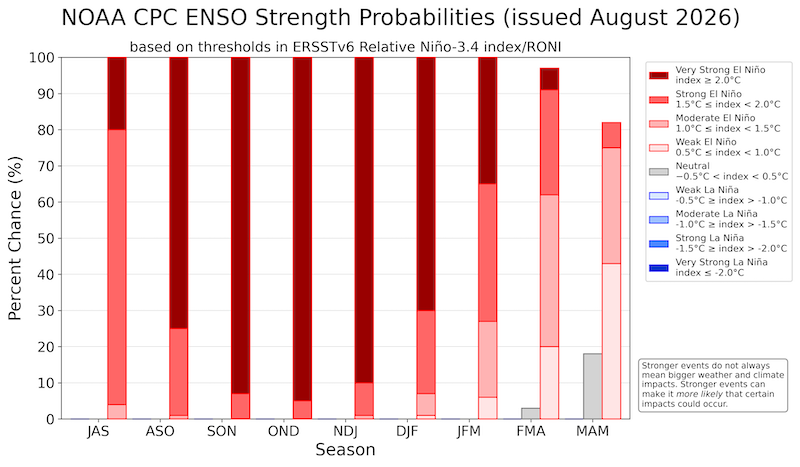
- Currently El Niño conditions are present. The NOAA forecast indicates a very strong El Niño will be present September–January (greater than 90% chance). El Niño conditions are likely to remain through the winter and into spring, though the strength of the El Niño may be reduced.
- Since 1950, two of the three strongest El Niño events (1982/1983, 1997/1998), according to the Relative Oceanic Nino Index (RONI), resulted in extreme wet conditions throughout California and Nevada. Precipitation was near normal during the third event (2015/2016).
This update is based on data available as of Tuesday, August 25, 2026 at 7:00 a.m. PT. We acknowledge that conditions are evolving.
The U.S. Drought Monitor depicts the location and intensity of drought across the country. The map uses 5 classifications: Abnormally Dry (D0), showing areas that may be going into or are coming out of drought, and four levels of drought (D1–D4).
The U.S. Drought Monitor is a joint effort of the National Oceanic and Atmospheric Administration, U.S. Department of Agriculture, National Aeronautics and Space Administration, and National Drought Mitigation Center.
A drought index combines multiple drought indicators (e.g., precipitation, temperature, soil moisture) to depict drought conditions. For some products, like the U.S. Drought Monitor, authors combine their analysis of drought indicators with input from local observers. Other drought indices, like the Standardized Precipitation Index (SPI), use an objective calculation to describe the severity, location, timing, and/or duration of drought.
Learn MorePeriods of drought can lead to inadequate water supply, threatening the health, safety, and welfare of communities. Streamflow, groundwater, reservoir, and snowpack data are key to monitoring and forecasting water supply.
Learn MoreDrought can reduce the water availability and water quality necessary for productive farms, ranches, and grazing lands, resulting in significant negative direct and indirect economic impacts to the agricultural sector. Monitoring agricultural drought typically focuses on examining levels of precipitation, evaporative demand, soil moisture, and surface/groundwater quantity and quality.
Learn MoreDrought & Dryness Categories
% AreaD0 – Abnormally Dry
Abnormally Dry (D0) indicates a region that is going into or coming out of drought.
D1 – Moderate Drought
Moderate Drought (D1) is the first of four drought categories (D1–D4), according to the U.S. Drought Monitor.
D2 – Severe Drought
Severe Drought (D2) is the second of four drought categories (D1–D4), according to the U.S. Drought Monitor.
D3 – Extreme Drought
Extreme Drought (D3) is the third of four drought categories (D1–D4), according to the U.S. Drought Monitor.
D4 – Exceptional Drought
Exceptional Drought (D4) is the most intense drought category, according to the U.S. Drought Monitor.
Total Area in Drought (D1–D4)
Percent area of the California–Nevada region that is currently in drought (D1–D4), according to the U.S. Drought Monitor.
The U.S. Drought Monitor depicts the location and intensity of drought across the country. The map uses 5 classifications: Abnormally Dry (D0), showing areas that may be going into or are coming out of drought, and four levels of drought (D1–D4).
The U.S. Drought Monitor is a joint effort of the National Oceanic and Atmospheric Administration, U.S. Department of Agriculture, National Aeronautics and Space Administration, and National Drought Mitigation Center.
This U.S. Drought Monitor is released every Thursday morning, with data valid through Tuesday at 7 a.m. EDT.
A drought index combines multiple drought indicators (e.g., precipitation, temperature, soil moisture) to depict drought conditions. For some products, like the U.S. Drought Monitor, authors combine their analysis of drought indicators with input from local observers. Other drought indices, like the Standardized Precipitation Index (SPI), use an objective calculation to describe the severity, location, timing, and/or duration of drought.
Learn MorePeriods of drought can lead to inadequate water supply, threatening the health, safety, and welfare of communities. Streamflow, groundwater, reservoir, and snowpack data are key to monitoring and forecasting water supply.
Learn MoreDrought can reduce the water availability and water quality necessary for productive farms, ranches, and grazing lands, resulting in significant negative direct and indirect economic impacts to the agricultural sector. Monitoring agricultural drought typically focuses on examining levels of precipitation, evaporative demand, soil moisture, and surface/groundwater quantity and quality.
Learn MoreCalifornia-Nevada Current Drought Conditions and Impacts
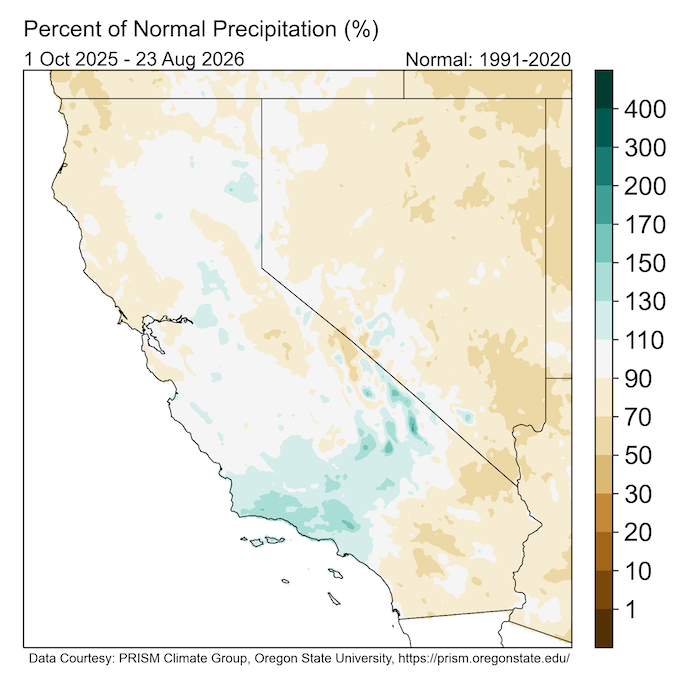
- While precipitation over the current water year (since October 1, 2025) has been near normal, drought conditions have deteriorated in northern California and Nevada. According to the U.S. Drought Monitor, around 41% of California-Nevada is in drought, with Moderate to Extreme Drought (D1-D3) conditions covering 88% of Nevada. An additional 39% of the region is Abnormally Dry (D0).
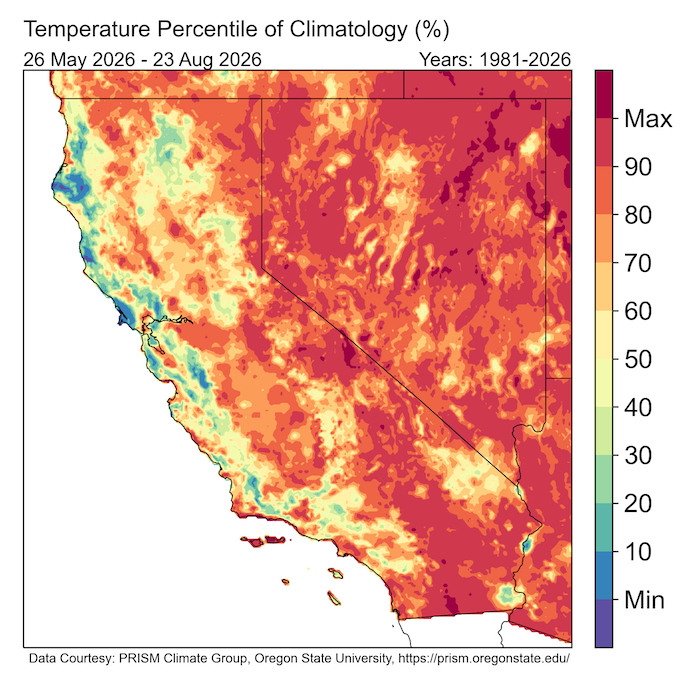
- Summer temperatures have been in the 90th percentile or greater for much of Nevada and parts of Southern California. Nighttime temperatures were warmer than average compared to daytime temperatures.
- Major California water supply reservoirs remain near or above their historical averages. Reservoirs in Nevada have storage comparable to 2025 levels, except for the Lower Humboldt, Owhyee, and Snake, which are lower.
- Major reservoirs across the Colorado River Basin are reaching critical lows. The combined contents of Lake Powell and Lake Mead have not been this low since before Lake Powell began filling following the closure of the gates at Glen Canyon Dam in 1963. Both Lake Powell and Lake Mead hit record lows the last few weeks. On Friday August 21, the U.S. Department of the Interior finalized plans for the 2027-2028 Colorado River operations and included reductions of 12% and 28% for California and Nevada, respectively.
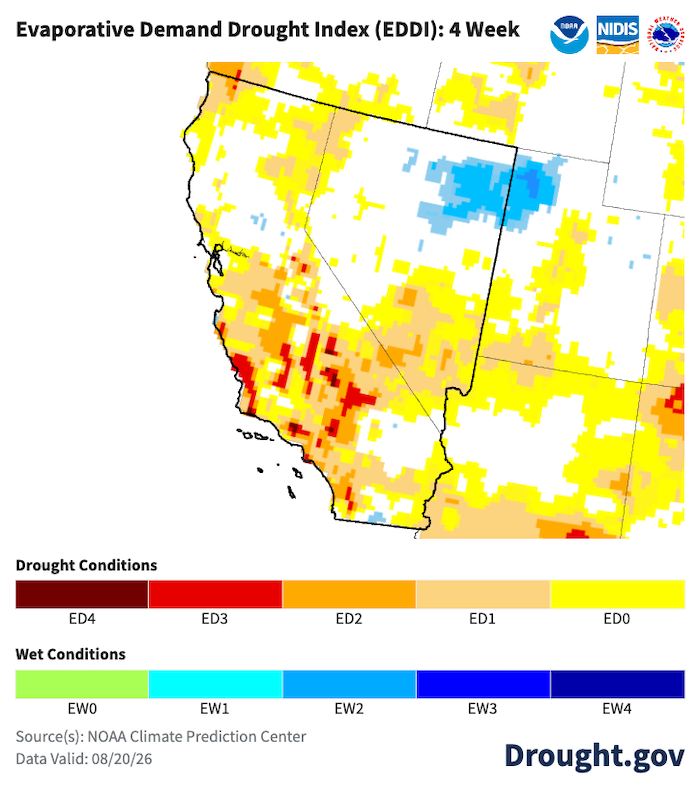
- Evaporative demand (the “thirst of the atmosphere,” or the potential loss of water from the land surface and sometimes linked with increased risk for wildfire) over the month has been extremely high along the Central Coast and Central Valley of California. However, fires in California are lower year to date than this time last year or over the five-year average.
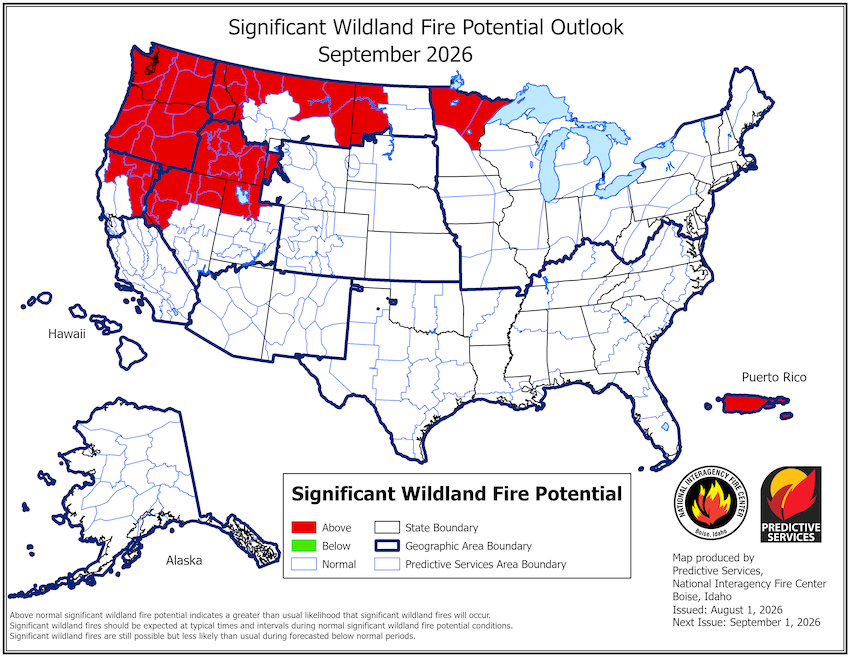
- In northern Nevada, fine fuel loading combined with hot and dry conditions set up the potential for above-normal significant wildland fire potential in August–September. Due to the Hawk Fire in Reno that started on August 22, Nevada Gov. Joe Lombardo has activated the National Guard and declared a state of emergency in Washoe County.
Precipitation for This Water Year to Date Was Near Normal Throughout California-Nevada
Summer Temperatures Have Been Well Above Normal
High Evaporative Demand in the Central Valley and Central Coast of California
Outlooks and Potential Impacts for California-Nevada
- An El Niño has developed in the Pacific Ocean. NOAA’s National Weather Service Climate Prediction Center’s official outlook shows a greater than 90% chance of a very strong El Niño through January 2027.
- During October–December 2026, there is a 69% chance of a historic event that would exceed the strength of previous El Niño events dating back to 1950.
- According to the Relative Oceanic Nino Index (RONI), two of the three strongest El Niño events since 1950 resulted in extreme wet conditions throughout California and Nevada (1982/1982 and 1997/1998). The third (2015/2016) resulted in near-normal precipitation.
- Scripps Institution of Oceanography has developed an El Niño Hub for resources about the forecasts and impacts on weather, coasts, and ecosystems.
- The National Interagency Coordination Center forecasts above-normal significant wildland fire potential for parts of northern California and northern Nevada in September, with fire potential decreasing later in fall.
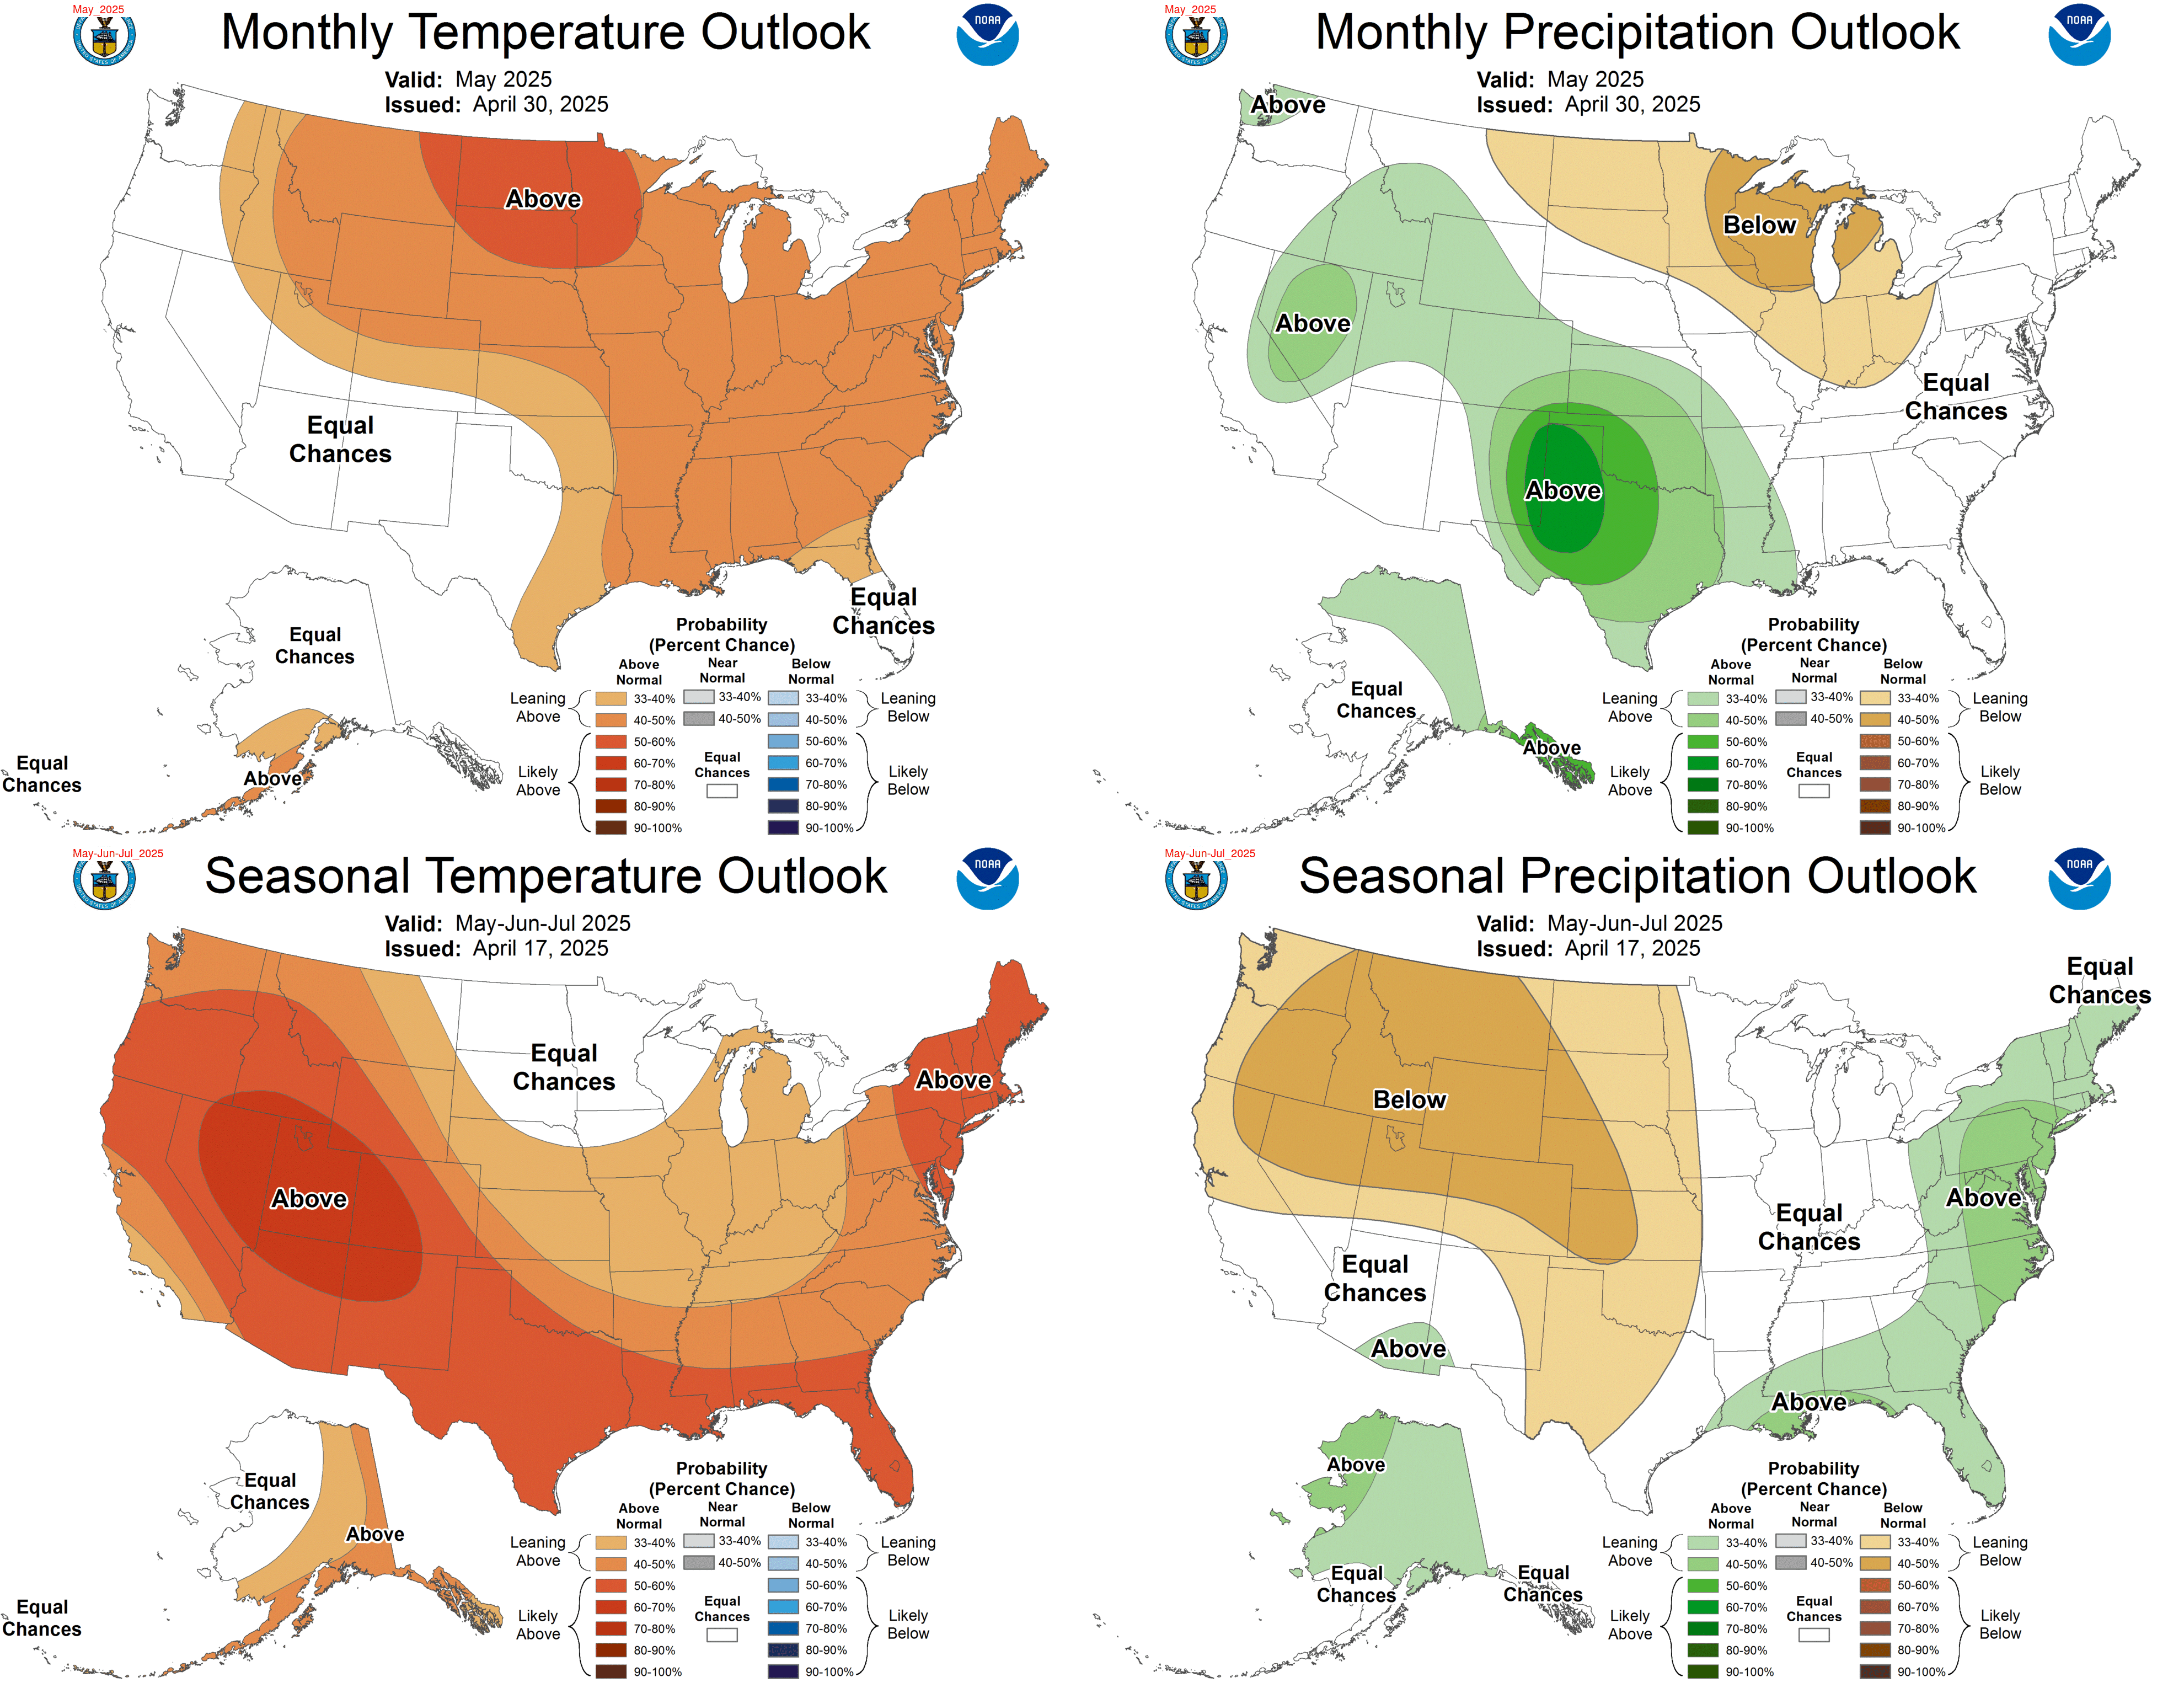
- September–November outlooks from NOAA’s Climate Prediction Center lean towards above-normal precipitation for southern Nevada and California, while above-normal temperatures are likely for much of the region.
NOAA Forecasts Predict Strong El Niño During Fall and Winter
Above-Normal Significant Wildland Fire Potential in Northern Nevada and Northeastern California
Resources
- Explore regional and state drought information:
- NIDIS and partners are piloting a series of Southern California Sector-Specific Drought Early Warning Outlooks in Water Year 2025–2026. View the latest update from July 23, or learn more and get involved by contacting Amanda Sheffield (amanda.sheffield@noaa.gov).
Prepared By
Amanda Sheffield
California-Nevada DEWS Regional Drought Information Coordinator
Cooperative Institute for Research in Environmental Sciences (CIRES), University of Colorado Boulder
NOAA’s National Integrated Drought Information System
Julie Kalansky
Principal Investigator
California-Nevada Adaptation Program (a NOAA RISA team)
This Drought Status Update is issued in partnership between the National Oceanic and Atmospheric Administration (NOAA), the California-Nevada Adaptation Program (a NOAA RISA team), and the Western Regional Climate Center at the Desert Research Institute to communicate a potential area of concern for drought expansion and/or development within the California-Nevada DEWS region based on recent conditions and the upcoming forecast. NIDIS and its partners will issue future Drought Status Updates as conditions evolve. NIDIS is an interagency program within the Climate Program Office, which is part of NOAA's Office of Oceanic and Atmospheric Research.