Midwest Needs Sustained, Above-Normal Rain in Coming Months to Improve Persistent Hydrological Drought Conditions
Key Points
- Recent March rainfall has reduced drought coverage by 15% over the past three weeks, though 23% of the Midwest still faces Moderate to Extreme Drought (D1-D3). The most severe conditions are affecting central Illinois and Indiana, northwest Ohio, southern Missouri, southeast Iowa, and north-central Minnesota.
- Recent rainfall has improved shallow soil moisture, pond levels, and early lawn green-up, but longer-term deficits persist. Streamflows remain low across central Illinois, Indiana, Missouri, northwest Ohio, and portions of Kentucky, and deeper soil moisture is still below normal—raising concerns for the upcoming growing season, including groundwater availability for irrigation needs.
- Low water tables persist in Illinois, and local wells are running low in Ohio and Missouri. The City of Sullivan, Illinois has extended its water emergency through June due to the drought, restricting use to only essentials.
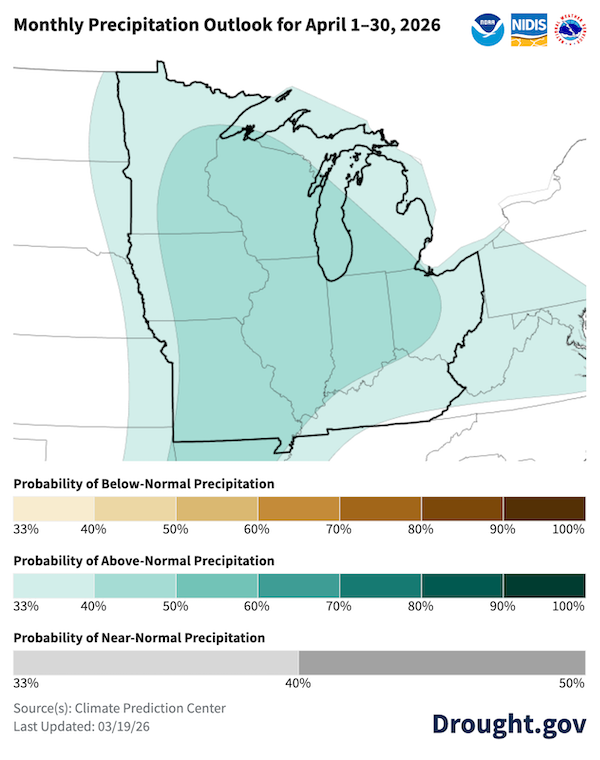
- In the short term, there may be some precipitation relief on the way. The 8–14 day outlook for April 2–8 and April precipitation outlook both show increased chances for above-normal precipitation for the entire Midwest region.
- Due to the long-term precipitation deficits across portions of the region, persistent, above-normal precipitation in the coming months is needed to improve drought conditions and lessen ongoing hydrological impacts.
This update is based on data available as of Thursday, March 26, 2026 at 8:00 a.m. CT. We acknowledge that conditions are evolving.
The U.S. Drought Monitor depicts the location and intensity of drought across the country. The map uses 5 classifications: Abnormally Dry (D0), showing areas that may be going into or are coming out of drought, and four levels of drought (D1–D4).
The U.S. Drought Monitor is a joint effort of the National Oceanic and Atmospheric Administration, U.S. Department of Agriculture, National Aeronautics and Space Administration, and National Drought Mitigation Center.
A drought index combines multiple drought indicators (e.g., precipitation, temperature, soil moisture) to depict drought conditions. For some products, like the U.S. Drought Monitor, authors combine their analysis of drought indicators with input from local observers. Other drought indices, like the Standardized Precipitation Index (SPI), use an objective calculation to describe the severity, location, timing, and/or duration of drought.
Learn MorePeriods of drought can lead to inadequate water supply, threatening the health, safety, and welfare of communities. Streamflow, groundwater, reservoir, and snowpack data are key to monitoring and forecasting water supply.
Learn MoreDrought can reduce the water availability and water quality necessary for productive farms, ranches, and grazing lands, resulting in significant negative direct and indirect economic impacts to the agricultural sector. Monitoring agricultural drought typically focuses on examining levels of precipitation, evaporative demand, soil moisture, and surface/groundwater quantity and quality.
Learn MoreU.S. Drought Monitor Categories
D0 - Abnormally Dry
Abnormally Dry (D0) indicates a region that is going into or coming out of drought. View typical impacts by state.
D1 - Moderate Drought
Moderate Drought (D1) is the first of four drought categories (D1–D4), according to the U.S. Drought Monitor. View typical impacts by state.
D2 - Severe Drought
Severe Drought (D2) is the second of four drought categories (D1–D4), according to the U.S. Drought Monitor. View typical impacts by state.
D3 - Extreme Drought
Extreme Drought (D3) is the third of four drought categories (D1–D4), according to the U.S. Drought Monitor. View typical impacts by state.
D4 - Exceptional Drought
Exceptional Drought (D4) is the most intense drought category, according to the U.S. Drought Monitor. View typical impacts by state.
Total Area in Drought (D1–D4)
Percent area of the Midwest that is currently in drought (D1–D4), according to the U.S. Drought Monitor.
The U.S. Drought Monitor depicts the location and intensity of drought across the country. The map uses 5 classifications: Abnormally Dry (D0), showing areas that may be going into or are coming out of drought, and four levels of drought (D1–D4).
The U.S. Drought Monitor is a joint effort of the National Oceanic and Atmospheric Administration, U.S. Department of Agriculture, National Aeronautics and Space Administration, and National Drought Mitigation Center.
The U.S. Drought Monitor is released every Thursday morning, with data valid through the previous Tuesday at 7 a.m. ET.
A drought index combines multiple drought indicators (e.g., precipitation, temperature, soil moisture) to depict drought conditions. For some products, like the U.S. Drought Monitor, authors combine their analysis of drought indicators with input from local observers. Other drought indices, like the Standardized Precipitation Index (SPI), use an objective calculation to describe the severity, location, timing, and/or duration of drought.
Learn MorePeriods of drought can lead to inadequate water supply, threatening the health, safety, and welfare of communities. Streamflow, groundwater, reservoir, and snowpack data are key to monitoring and forecasting water supply.
Learn MoreDrought can reduce the water availability and water quality necessary for productive farms, ranches, and grazing lands, resulting in significant negative direct and indirect economic impacts to the agricultural sector. Monitoring agricultural drought typically focuses on examining levels of precipitation, evaporative demand, soil moisture, and surface/groundwater quantity and quality.
Learn MoreCurrent Conditions and Impacts for the Midwest
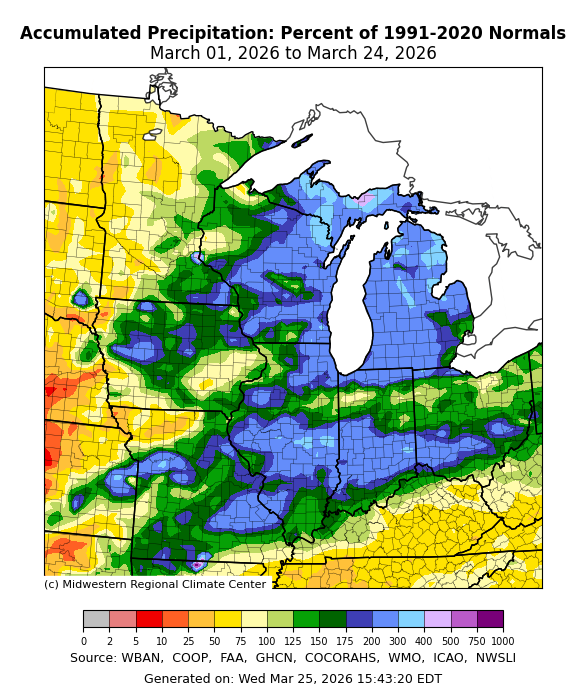
- Drought persisted through winter for portions of the Midwest, including Illinois, Indiana, Ohio, Missouri, Iowa, and Minnesota, as precipitation was only 10-75% of normal across a majority of the region, with the exception of northern Wisconsin and Michigan.
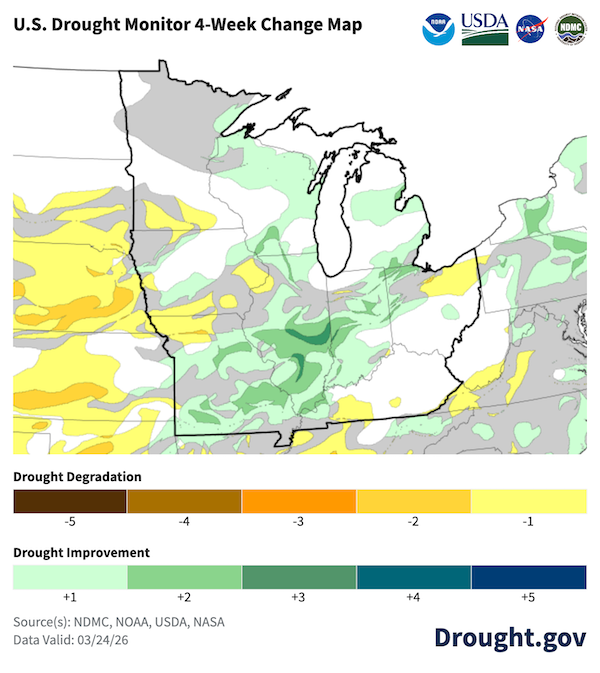
- However, March has brought some much-needed precipitation to the region. In fact, according to the U.S. Drought Monitor, Moderate to Extreme Drought (D1-D3) coverage decreased by 15% from March 3 to March 24. The recent rainfall has helped improve shallow soil moisture, increase pond levels, and initiate lawn green-up.
- Currently, 23% of the Midwest region is experiencing Moderate to Extreme Drought (D1-D3), with the most intense conditions of Extreme Drought (D3) in central Illinois, northwest Ohio, and a small portion of south-central Missouri.
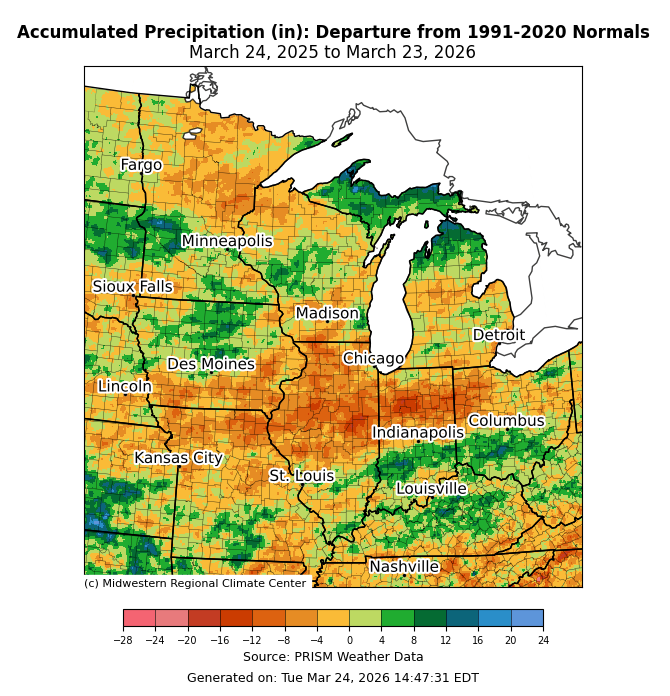
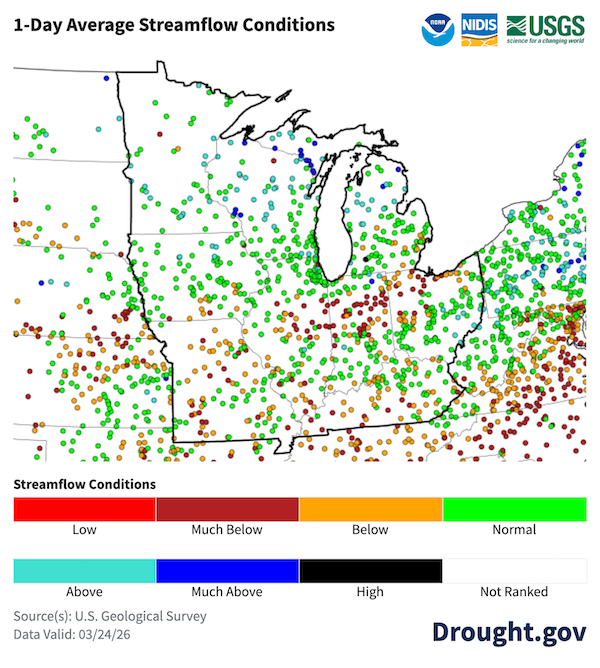
- Despite the recent rainfall, long-term deficits of 8–16 inches over the last twelve months remain across Missouri, Illinois, Indiana, and southern Iowa, leading to persistent hydrological drought impacts. Low streamflows continue across central Illinois, Indiana, northwest Ohio, Kentucky, and Missouri.
- Low water tables persist in central Illinois, and local wells are running low in Ohio and Missouri. The City of Sullivan, Illinois has extended its water emergency, first issued on February 11, through June due to ongoing drought conditions. Water use is restricted to essential use and residents are urged to conserve water. After a dry winter, Shenandoah, Iowa continues to struggle with low water levels in their wells, prompting a call for residents to conserve water.
- Deeper soil moisture remains below normal across portions of Ohio, Illinois, Indiana, and Missouri, raising concerns about the amount of moisture available for the upcoming growing season. In addition, groundwater across north-central Indiana is heavily depleted, raising concerns for irrigated crops in the northern tier of Indiana.
- The Great Lakes remained below long-term averages over the winter. However, the rate of decline in lake levels is beginning to stabilize as a drought eases in parts of the Great Lakes Basin and snowmelt drives runoff into the lakes.
Last Few Weeks Brought Drought Relief to Portions of the Midwest
Above-Normal March Precipitation Across Much of the Midwest
Large Long-Term Precipitation Deficits Remain Across the Midwest
Low Streamflow Conditions Across Portions of Central and Lower Midwest
Outlooks and Potential Impacts in the Midwest
- In the short term, there may be some precipitation relief on the way. The National Weather Service Climate Prediction Center’s 8–14 day outlook for April 2–8 and April precipitation outlook both show increased chances for above-normal precipitation for the entire Midwest region.
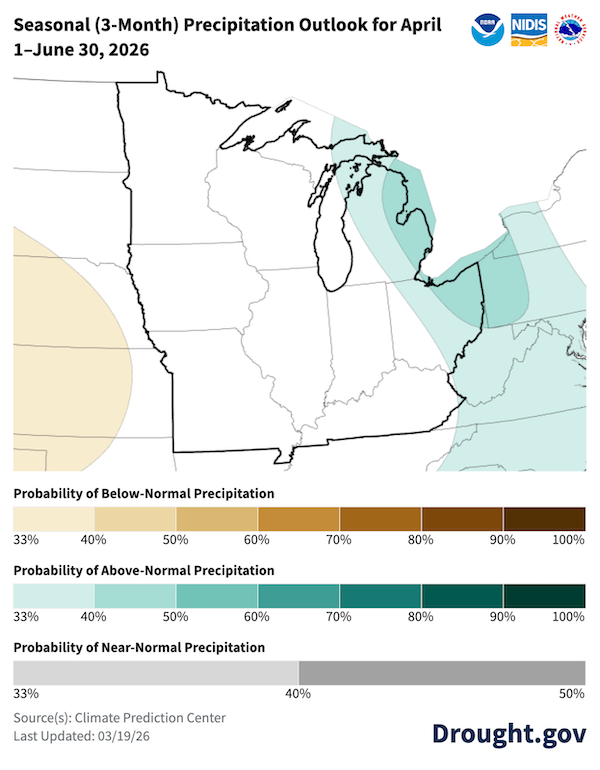
- The 3-month precipitation outlook for April 1–June 30 shows an increased chance for above-normal precipitation across portions of Michigan and Ohio, and equal chances for above-, near-, or below-normal precipitation across the Midwest region. Normal April–June precipitation ranges from 7.5 inches in the Upper Midwest to 20 inches in portions of the southern Midwest.
- Due to the long-term precipitation deficits across portions of the region, persistent, above-normal precipitation in the coming months is needed to improve drought conditions and lessen ongoing hydrological impacts.
Increased Chances for Above-Normal April Precipitation
Uncertain Spring Precipitation Outlook, Slight Wet Signal to the East
Resources
- Register for the next Drought in the Midwest Webinar on April 9, 2026.
- More local information is available from the following resources:
- To report or view local drought impact information:
Prepared By
Molly Woloszyn
Cooperative Institute for Research in Environmental Sciences/NOAA National Integrated Drought Information System (NIDIS)
Austin Pearson
Midwestern Regional Climate Center/Purdue University
Denise Gutzmer
National Drought Mitigation Center
Trent Ford
University of Illinois/Illinois State Water Survey
The following people also contributed to the development of this report: Alexis Highman (NOAA National Weather Service), Melissa Widhalm (Midwestern Regional Climate Center/Purdue University), Jim Noel and Molly Peters (NOAA National Weather Service Ohio and North Central River Forecast Centers), and Dennis Todey (U.S. Department of Agriculture Midwest Climate Hub).
A special thank you to the state climate offices and National Weather Service offices in the Midwest region for providing local information on drought conditions and impacts included in this Drought Status Update.
This Drought Status Update is issued in partnership between the National Oceanic and Atmospheric Administration (NOAA), U.S. Department of Agriculture (USDA), U.S. Army Corps of Engineers (USACE), and the National Drought Mitigation Center to communicate a potential area of concern for drought expansion and/or development within the Midwest region based on recent conditions and the upcoming forecast. NIDIS and its partners will issue future Drought Status Updates as conditions evolve. NIDIS is an interagency program within the Climate Program Office, which is part of NOAA's Office of Oceanic and Atmospheric Research.


