Surface drought conditions improve, but continuing to watch for recovery of groundwater and streamflow.
For more details, see the Northeast Drought Early Warning System Dashboard.
Key Points
- Extreme Drought (D3) continued for Boston’s north shore communities.
- Severe Drought (D2) persisted for parts of Long Island, southeastern New York, Connecticut, Massachusetts, and a small portion of southeast New Hampshire.
- Moderate Drought (D1) and Abnormally Dry (D0) conditions remain in parts of all 7 Northeast DEWS states.
Current U.S. Drought Monitor map for the Northeast Drought Early Warning System with data valid for October 4, 2022. The U.S. Drought Monitor is updated each Thursday to show the location and intensity of drought across the country.
According to the latest U.S. Drought Monitor:
- Extreme drought (D3) conditions exist in 26% of the region.
- Severe drought (D2) conditions exist in 5.13% of the region.
- Moderate drought (D1) conditions exist in 11.15% of the region.
- Abnormally dry (D0) conditions exist in 16.16% of the region.
U.S. Drought Monitor Categories
Current U.S. Drought Monitor map for the Northeast Drought Early Warning System with data valid for October 4, 2022. The U.S. Drought Monitor is updated each Thursday to show the location and intensity of drought across the country.
According to the latest U.S. Drought Monitor:
- Extreme drought (D3) conditions exist in 26% of the region.
- Severe drought (D2) conditions exist in 5.13% of the region.
- Moderate drought (D1) conditions exist in 11.15% of the region.
- Abnormally dry (D0) conditions exist in 16.16% of the region.
Current Conditions
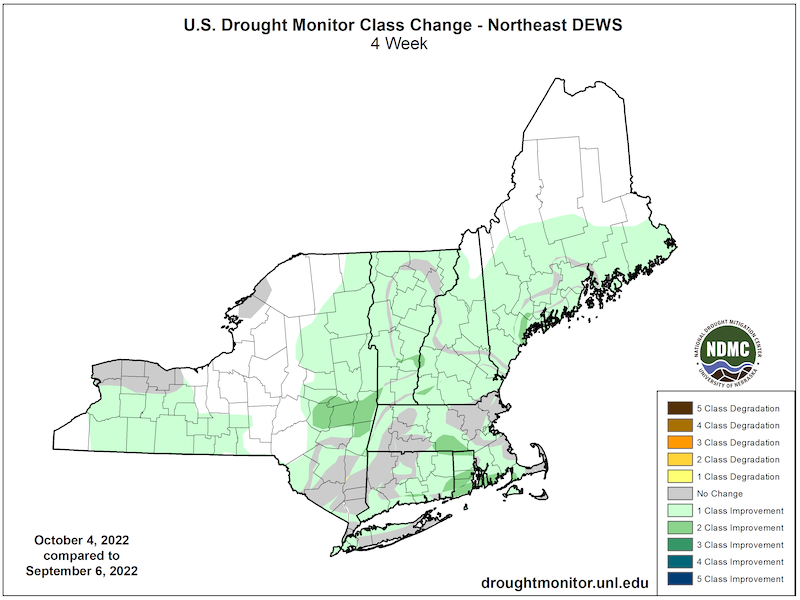
U.S. Drought Monitor 4-Week Change Map
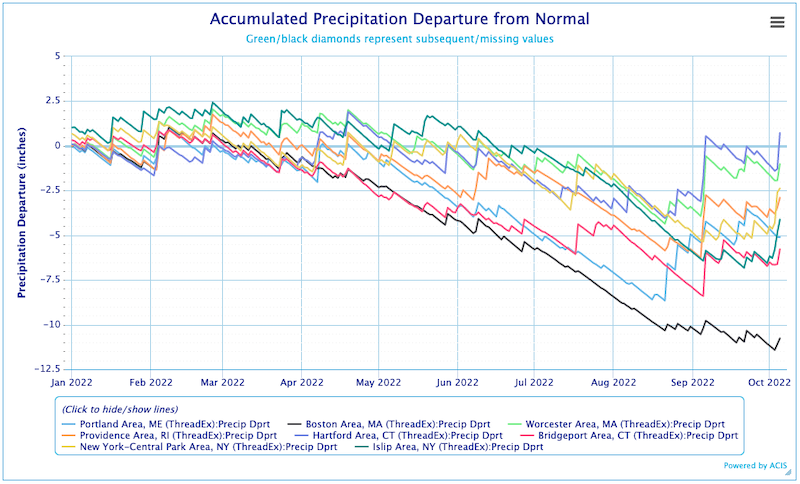
Accumulated Precipitation Departure from Normal
| Station | Jan | Feb | Mar | Apr | May | Jun | Jul | Aug | Sep | Oct | Nov | Dec |
|---|---|---|---|---|---|---|---|---|---|---|---|---|
| Albany, NY | 0.31 | 0.49 | 1.17 | 2.21 | 3.58 | 4.05 | 4.45 | 3.80 | 2.47 | 1.37 | 0.57 | 0.30 |
| Allentown, PA | 0.44 | 0.65 | 1.44 | 2.46 | 3.80 | 4.27 | 4.69 | 4.01 | 2.70 | 1.65 | 0.77 | 0.44 |
| Atlantic City, NJ | 0.55 | 0.77 | 1.53 | 2.47 | 3.83 | 4.34 | 4.77 | 4.13 | 2.84 | 1.81 | 0.90 | 0.55 |
| Baltimore, MD | 0.59 | 0.83 | 1.68 | 2.69 | 3.96 | 4.43 | 4.76 | 4.11 | 2.90 | 1.88 | 0.96 | 0.58 |
| Bangor, ME | 0.27 | 0.45 | 0.98 | 1.86 | 3.11 | 3.56 | 3.91 | 3.42 | 2.20 | 1.20 | 0.49 | 0.27 |
| Beckley, WV | 0.49 | 0.71 | 1.54 | 2.59 | 3.63 | 4.04 | 4.20 | 3.83 | 2.73 | 1.78 | 0.89 | 0.50 |
| Binghamton, NY | 0.26 | 0.42 | 1.00 | 1.93 | 3.23 | 3.63 | 4.00 | 3.41 | 2.13 | 1.22 | 0.48 | 0.25 |
| Boston, MA | 0.37 | 0.57 | 1.15 | 1.95 | 3.09 | 3.58 | 4.02 | 3.49 | 2.29 | 1.36 | 0.63 | 0.37 |
| Bridgeport, CT | 0.44 | 0.63 | 1.31 | 2.21 | 3.41 | 3.90 | 4.38 | 3.76 | 2.52 | 1.54 | 0.74 | 0.44 |
| Buffalo, NY | 0.24 | 0.40 | 0.99 | 1.92 | 3.26 | 3.74 | 4.05 | 3.43 | 2.23 | 1.18 | 0.47 | 0.24 |
| Burlington, VT | 0.24 | 0.42 | 0.97 | 1.96 | 3.26 | 3.74 | 4.13 | 3.47 | 2.18 | 1.13 | 0.45 | 0.23 |
| Caribou, ME | 0.17 | 0.30 | 0.73 | 1.51 | 2.88 | 3.39 | 3.64 | 3.07 | 1.84 | 0.89 | 0.31 | 0.16 |
| Charleston, WV | 0.56 | 0.84 | 1.79 | 2.95 | 4.07 | 4.52 | 4.67 | 4.22 | 3.08 | 2.02 | 1.01 | 0.57 |
| Cleveland, OH | 0.29 | 0.48 | 1.16 | 2.19 | 3.54 | 4.10 | 4.48 | 3.73 | 2.50 | 1.39 | 0.58 | 0.29 |
| Concord, NH | 0.33 | 0.53 | 1.17 | 2.20 | 3.46 | 3.97 | 4.42 | 3.84 | 2.48 | 1.42 | 0.63 | 0.35 |
| Elkins, WV | 0.48 | 0.71 | 1.54 | 2.58 | 3.68 | 4.12 | 4.37 | 3.95 | 2.78 | 1.80 | 0.88 | 0.49 |
| Erie, PA | 0.26 | 0.43 | 1.05 | 2.05 | 3.45 | 4.03 | 4.39 | 3.65 | 2.36 | 1.27 | 0.51 | 0.25 |
| Hartford, CT | 0.41 | 0.61 | 1.34 | 2.32 | 3.57 | 4.03 | 4.50 | 3.86 | 2.60 | 1.53 | 0.71 | 0.41 |
| Huntington, WV | 0.55 | 0.82 | 1.79 | 2.97 | 4.12 | 4.57 | 4.78 | 4.28 | 3.11 | 1.99 | 0.97 | 0.55 |
| New York (LaGuardia), NY | 0.45 | 0.66 | 1.38 | 2.32 | 3.58 | 4.02 | 4.41 | 3.78 | 2.59 | 1.59 | 0.75 | 0.45 |
| Newark, NJ | 0.47 | 0.69 | 1.45 | 2.40 | 3.63 | 4.06 | 4.46 | 3.80 | 2.64 | 1.63 | 0.78 | 0.46 |
| Philadelphia, PA | 0.51 | 0.73 | 1.53 | 2.54 | 3.85 | 4.29 | 4.67 | 4.06 | 2.81 | 1.76 | 0.86 | 0.51 |
| Pittsburgh, PA | 0.35 | 0.55 | 1.32 | 2.36 | 3.55 | 4.03 | 4.36 | 3.79 | 2.61 | 1.54 | 0.67 | 0.35 |
| Portland, ME | 0.33 | 0.52 | 1.08 | 1.91 | 3.09 | 3.61 | 4.08 | 3.54 | 2.30 | 1.29 | 0.58 | 0.34 |
| Providence, RI | 0.42 | 0.62 | 1.29 | 2.14 | 3.32 | 3.72 | 4.15 | 3.53 | 2.45 | 1.49 | 0.71 | 0.42 |
| Rochester, NY | 0.27 | 0.43 | 1.04 | 2.01 | 3.42 | 3.88 | 4.22 | 3.56 | 2.27 | 1.23 | 0.50 | 0.26 |
| Scranton, W-B, PA | 0.37 | 0.58 | 1.31 | 2.32 | 3.65 | 4.10 | 4.48 | 3.80 | 2.49 | 1.50 | 0.67 | 0.37 |
| Syracuse, NY | 0.27 | 0.43 | 1.06 | 2.11 | 3.52 | 3.96 | 4.31 | 3.64 | 2.33 | 1.29 | 0.51 | 0.26 |
| Washington, DC | 0.61 | 0.86 | 1.70 | 2.73 | 3.91 | 4.36 | 4.66 | 4.07 | 2.90 | 1.89 | 0.98 | 0.61 |
| Williamsport, PA | 0.38 | 0.60 | 1.39 | 2.42 | 3.76 | 4.22 | 4.54 | 3.86 | 2.48 | 1.53 | 0.68 | 0.38 |
| Wilmington, DE | 0.52 | 0.74 | 1.54 | 2.55 | 3.90 | 4.37 | 4.77 | 4.13 | 2.83 | 1.77 | 0.86 | 0.52 |
| Worcester, MA | 0.33 | 0.51 | 1.12 | 2.03 | 3.20 | 3.59 | 4.03 | 3.49 | 2.27 | 1.31 | 0.59 | 0.33 |
Estimates (in inches) of average monthly potential evapotranspiration (PET) for a grass-covered surfaces for sites throughout the Northeast. Average values are based on the period 1981–2010. Source: Northeast Regional Climate Center.
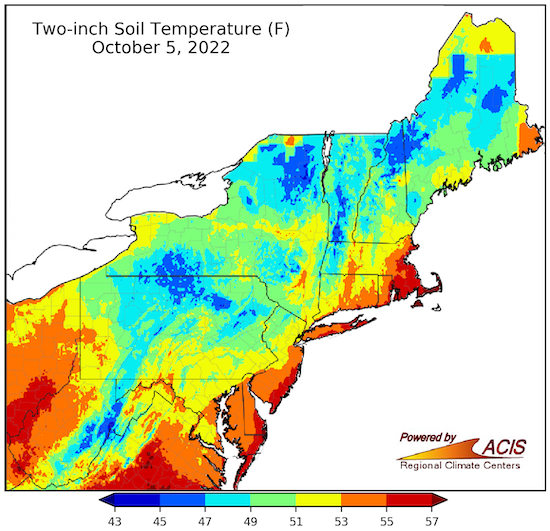
Regional 2-Inch Soil Temperature (°F): October 5, 2022
State-Reported Impacts
Connecticut
- October 4, 2022: Governor Lamont Announces Eligibility for Federal Disaster Assistance Due to Drought Impacts in All Eight Counties
- October 4, 2022: NBC CT – Voluntary Water Restrictions In Bristol
- September 28, 2022: WTNH News8 – Drought Connected to Disease in White-Tail Deer
Maine
- October 5, 2022: Maine Fall Foliage Report
- October 2, 2022: The Maine Monitor – Wild Blueberry Harvest Suffered
Massachusetts
- Condition Monitoring Observer Reports (CMOR): Massachusetts Water Impact Reporting
- October 4, 2022: Ipswich Local News – Summer Vs. Winter Water Rates Control Usage
- October 4, 2022: Ipswich Local News – Unprecedented: A Northshore Water Resilience Task Force Forms
- September 29, 2022: Gloucester Daily Times – Gloucester Extends Water Ban
- September 29, 2022: Ipswich Local News – UMass Boston Funds New Water Gauge: Improve Understanding of Water Resources and Ecosystem Impacts in a Changing Climate
- September 28, 2022: WesternMASSNews – Water Restrictions Set to Expire
- September 26, 2022: The Patriot Ledger – MA Water Resources Authority Waives Entrance Fees Because of Drought, Bacteria
New York
- October 5–11, 2022: New York Fall Foliage Report
- September 29, 2022: The Daily News – Peak Fall Foliage Still Possible
- September 27, 2022: WWLP.com News22 – Fall Festivities Carry on Despite Drought
- September 25, 2022: WAER88.3 – Central Region Pumpkins Available Despite Drought
Rhode Island
- October 5, 2022: The Providence Journal – Several Waterways in Rhode Island Cannot Be Stocked with Trout Due to Drought-Induced Low Water Levels or Harmful Algal Blooms
Outlooks
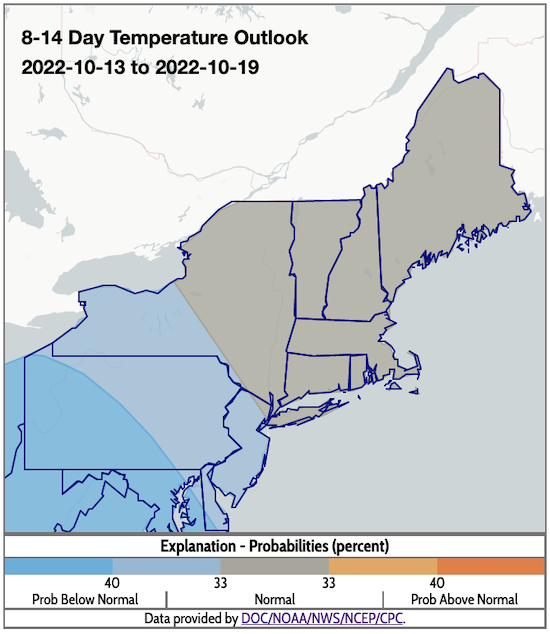
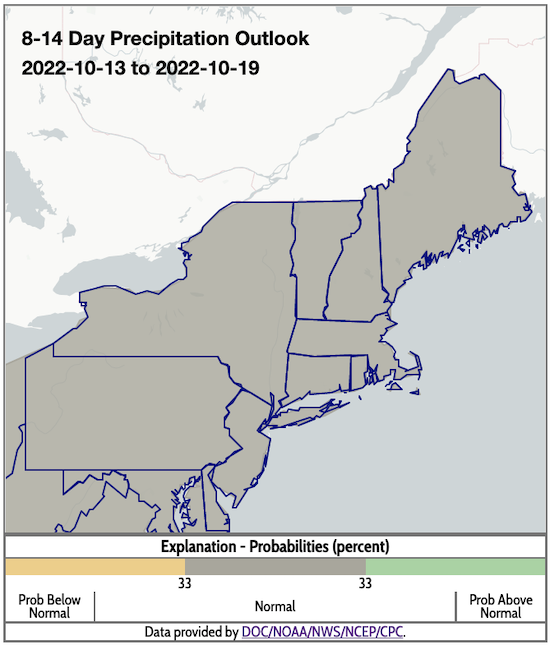
- According to the Climate Prediction Center's 8–14 day outlook (valid October 13–19, 2022), odds favor below-normal temperatures in western New York and near-normal temperatures in the rest of the Northeast. Near-normal precipitation is favored across the region.
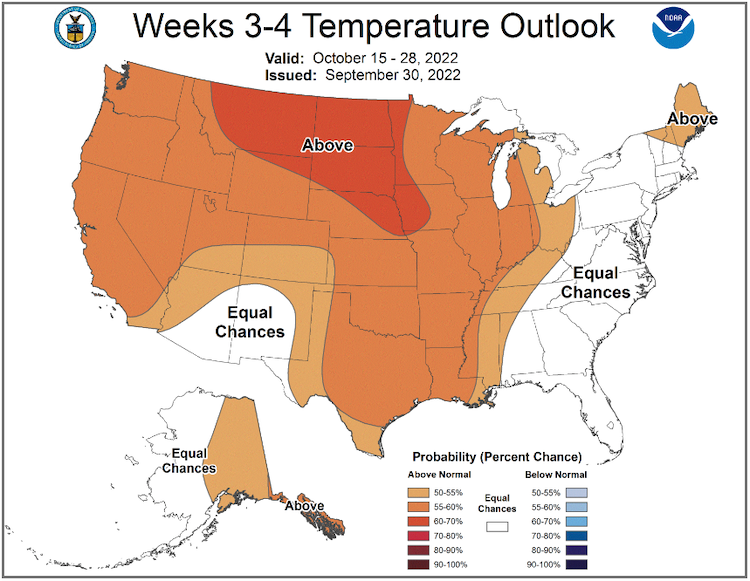
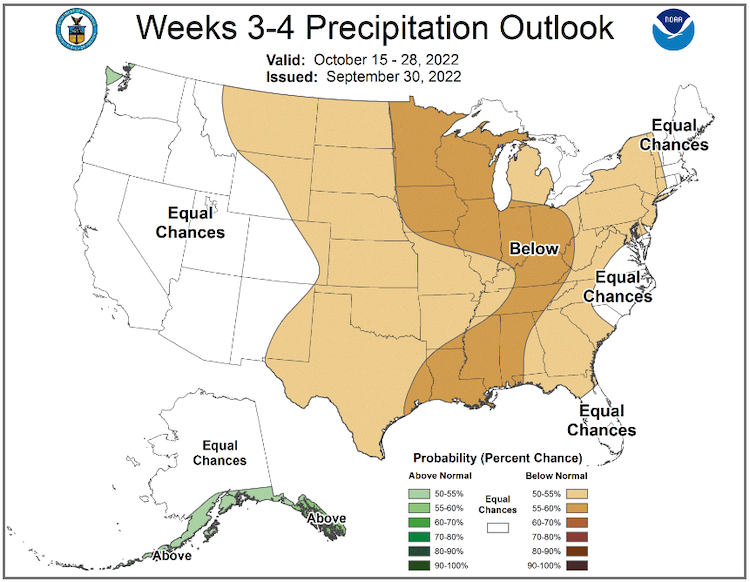
- The week 3–4 outlook (valid October 15–28, 2022) favors above-normal temperatures for Maine and northern Vermont and New Hampshire, with equal chances of above- or below-normal conditions elsewhere. There is a greater likelihood of below-normal precipitation for all of New York, as well as eastern Vermont, Massachusetts, and Connecticut. The rest of the Northeast has equal chances of above- or below-normal precipitation.
8–14 Day Temperature Outlook
8–14 Day Precipitation Outlook
Temperature Outlook Week 3–4
Precipitation Outlook Week 3–4
Featured Resources
- Register for the Northeast DEWS Partners Meeting on November 1–2 in Glen Falls, New York.
- Webinar Recap: Drought Prediction: Water Availability Prediction for Ecosystems
- Register for the National Listening Session Series Key Takeaways and Next Steps: Drought Prediction and Water Availability
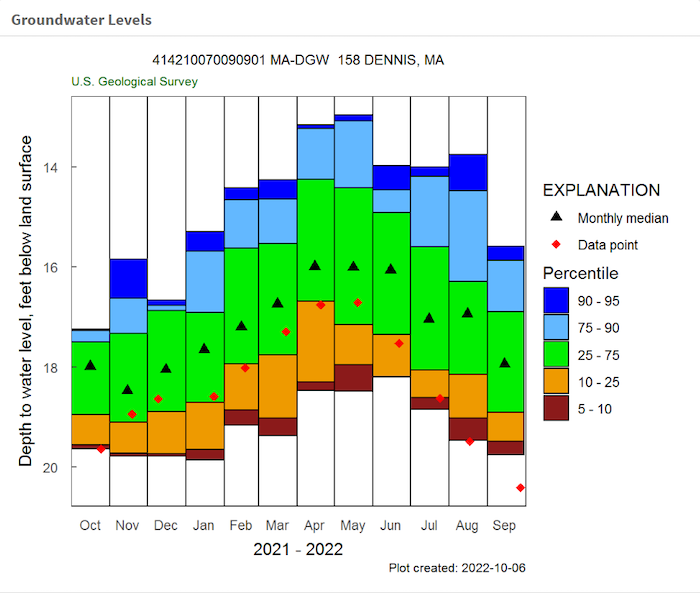
- USGS Groundwater Levels in New England: Recent conditions relative to historical monthly statistics
- Climate Smart Farming Tools website from the Cornell University Agricultural and Life Sciences Department
Additional Resources
- Look back at previous Northeast DEWS Drought Status Updates
- Your local National Weather Service office
- NOAA Regional Climate Services Monthly Webinar Series (next webinar is on October 27)
- USDA Northeast Climate Hub
- USGS New England and New York Water Science Centers
Contacts for More Information
Sylvia Reeves
Regional Drought Information Coordinator (Northeast DEWS)
NOAA/CIRES/National Integrated Drought Information System (NIDIS)
Email: sylvia.reeves@noaa.gov
Ellen L. Mecray
Regional Climate Services Director, Eastern Region
NOAA/NESDIS/National Centers for Environmental Information
Email: Ellen.L.Mecray@noaa.gov
Prepared By
Sylvia Reeves
NOAA/National Integrated Drought Information System (NIDIS), CIRES
Samantha Borisoff, Jessica Spaccio, Keith Eggleston, Art DeGaetano
Northeast Regional Climate Center
Ellen Mecray
Regional Climate Services Director, Eastern Region, NOAA
David Hollinger
USDA Climate Hubs
Gardner Bent
USGS New England Water Science Center
In partnership with National Weather Service Offices of the Northeast and State Climate Offices of the Northeast.
This drought status update is issued in partnership between the National Oceanic and Atmospheric Administration (NOAA), U.S. Geological Survey, and the U.S. Department of Agriculture (USDA) to communicate concern for drought expansion and intensification within the Northeast U.S. based on recent conditions and the forecasts and outlooks. NIDIS and its partners will issue future drought status updates as conditions evolve.

