A Warm, Dry March Led to Snow Melt and Drought Expansion. Heat and Fire Potential Are Concerns for Summer.
Key Points
- Abnormally Dry (D0) and drought conditions have returned to California and expanded and intensified in Nevada, according to the U.S. Drought Monitor. California’s drought-free period earlier in the water year was short lived. Currently, 65% of California is Abnormally Dry (D0) and nearly 77% of Nevada is in drought (D1-D4).
- A dry and warm March, with record-breaking heat, led to rapid and early snowmelt across California and Nevada.
- In early April, 98-100% of SNOTEL stations were in a snow drought (defined as snow water equivalent below the 20th percentile). April 1 statewide snow water equivalent was the lowest on record (going back to 1981) for Nevada, and the second lowest on record for California.
- Recent storms and future forecasted storms through the end of April into early May have and may continue to buffer further drought degradation in some areas.
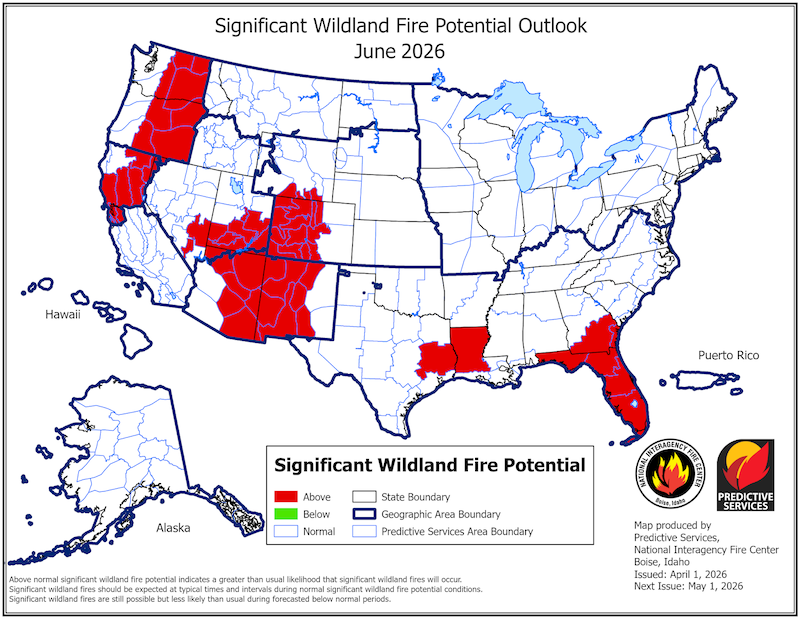
- As the region enters its climatological dry season, seasonal forecasts favor warmer-than-normal conditions for May–July. Above-normal significant wildland fire potential is forecast in northern California and eastern Nevada in June–July.
This update is based on data available as of Monday, April 27, 2026 at 7:00 a.m. PT. We acknowledge that conditions are evolving.
The U.S. Drought Monitor depicts the location and intensity of drought across the country. The map uses 5 classifications: Abnormally Dry (D0), showing areas that may be going into or are coming out of drought, and four levels of drought (D1–D4).
The U.S. Drought Monitor is a joint effort of the National Oceanic and Atmospheric Administration, U.S. Department of Agriculture, National Aeronautics and Space Administration, and National Drought Mitigation Center.
A drought index combines multiple drought indicators (e.g., precipitation, temperature, soil moisture) to depict drought conditions. For some products, like the U.S. Drought Monitor, authors combine their analysis of drought indicators with input from local observers. Other drought indices, like the Standardized Precipitation Index (SPI), use an objective calculation to describe the severity, location, timing, and/or duration of drought.
Learn MorePeriods of drought can lead to inadequate water supply, threatening the health, safety, and welfare of communities. Streamflow, groundwater, reservoir, and snowpack data are key to monitoring and forecasting water supply.
Learn MoreDrought can reduce the water availability and water quality necessary for productive farms, ranches, and grazing lands, resulting in significant negative direct and indirect economic impacts to the agricultural sector. Monitoring agricultural drought typically focuses on examining levels of precipitation, evaporative demand, soil moisture, and surface/groundwater quantity and quality.
Learn MoreA drought index combines multiple drought indicators (e.g., precipitation, temperature, soil moisture) to depict drought conditions. For some products, like the U.S. Drought Monitor, authors combine their analysis of drought indicators with input from local observers. Other drought indices, like the Standardized Precipitation Index (SPI), use an objective calculation to describe the severity, location, timing, and/or duration of drought.
Learn MorePeriods of drought can lead to inadequate water supply, threatening the health, safety, and welfare of communities. Streamflow, groundwater, reservoir, and snowpack data are key to monitoring and forecasting water supply.
Learn MoreDrought can reduce the water availability and water quality necessary for productive farms, ranches, and grazing lands, resulting in significant negative direct and indirect economic impacts to the agricultural sector. Monitoring agricultural drought typically focuses on examining levels of precipitation, evaporative demand, soil moisture, and surface/groundwater quantity and quality.
Learn MoreDrought & Dryness Categories
% AreaD0 – Abnormally Dry
Abnormally Dry (D0) indicates a region that is going into or coming out of drought.
D1 – Moderate Drought
Moderate Drought (D1) is the first of four drought categories (D1–D4), according to the U.S. Drought Monitor.
D2 – Severe Drought
Severe Drought (D2) is the second of four drought categories (D1–D4), according to the U.S. Drought Monitor.
D3 – Extreme Drought
Extreme Drought (D3) is the third of four drought categories (D1–D4), according to the U.S. Drought Monitor.
D4 – Exceptional Drought
Exceptional Drought (D4) is the most intense drought category, according to the U.S. Drought Monitor.
Total Area in Drought (D1–D4)
Percent area of the California–Nevada region that is currently in drought (D1–D4), according to the U.S. Drought Monitor.
Drought Degradation
5-Category Degradation
Drought/dryness has worsened by 5 categories, according to the U.S. Drought Monitor.
4-Category Degradation
Drought/dryness has worsened by 4 categories, according to the U.S. Drought Monitor.
3-Category Degradation
Drought/dryness has worsened by 3 categories, according to the U.S. Drought Monitor.
2-Category Degradation
Drought/dryness has worsened by 2 categories, according to the U.S. Drought Monitor.
1-Category Degradation
Drought/dryness has worsened by 1 category, according to the U.S. Drought Monitor.
Drought Improvement
1-Category Improvement
Drought/dryness has improved by 1 category, according to the U.S. Drought Monitor.
2-Category Improvement
Drought/dryness has improved by 2 categories, according to the U.S. Drought Monitor.
3-Category Improvement
Drought/dryness has improved by 3 categories, according to the U.S. Drought Monitor.
4-Category Improvement
Drought/dryness has improved by 4 categories, according to the U.S. Drought Monitor.
5-Category Improvement
Drought/dryness has improved by 5 categories, according to the U.S. Drought Monitor.
The U.S. Drought Monitor depicts the location and intensity of drought across the country. The map uses 5 classifications: Abnormally Dry (D0), showing areas that may be going into or are coming out of drought, and four levels of drought (D1–D4).
The U.S. Drought Monitor is a joint effort of the National Oceanic and Atmospheric Administration, U.S. Department of Agriculture, National Aeronautics and Space Administration, and National Drought Mitigation Center.
This 8-week U.S. Drought Monitor change map shows where drought has improved, degraded, or remained from February 24–April 21, 2026. Yellow shades indicate drought degradation, while green shades indicate drought improvement, according to the U.S. Drought Monitor.
This U.S. Drought Monitor is released every Thursday morning, with data valid through Tuesday at 7 a.m. ET.
This U.S. Drought Monitor (USDM) and USDM change maps are released every Thursday morning, with data valid through Tuesday at 7 a.m. ET.
A drought index combines multiple drought indicators (e.g., precipitation, temperature, soil moisture) to depict drought conditions. For some products, like the U.S. Drought Monitor, authors combine their analysis of drought indicators with input from local observers. Other drought indices, like the Standardized Precipitation Index (SPI), use an objective calculation to describe the severity, location, timing, and/or duration of drought.
Learn MorePeriods of drought can lead to inadequate water supply, threatening the health, safety, and welfare of communities. Streamflow, groundwater, reservoir, and snowpack data are key to monitoring and forecasting water supply.
Learn MoreDrought can reduce the water availability and water quality necessary for productive farms, ranches, and grazing lands, resulting in significant negative direct and indirect economic impacts to the agricultural sector. Monitoring agricultural drought typically focuses on examining levels of precipitation, evaporative demand, soil moisture, and surface/groundwater quantity and quality.
Learn MoreA drought index combines multiple drought indicators (e.g., precipitation, temperature, soil moisture) to depict drought conditions. For some products, like the U.S. Drought Monitor, authors combine their analysis of drought indicators with input from local observers. Other drought indices, like the Standardized Precipitation Index (SPI), use an objective calculation to describe the severity, location, timing, and/or duration of drought.
Learn MorePeriods of drought can lead to inadequate water supply, threatening the health, safety, and welfare of communities. Streamflow, groundwater, reservoir, and snowpack data are key to monitoring and forecasting water supply.
Learn MoreDrought can reduce the water availability and water quality necessary for productive farms, ranches, and grazing lands, resulting in significant negative direct and indirect economic impacts to the agricultural sector. Monitoring agricultural drought typically focuses on examining levels of precipitation, evaporative demand, soil moisture, and surface/groundwater quantity and quality.
Learn MoreCalifornia-Nevada Current Drought Conditions and Impacts
- According to the U.S. Drought Monitor, ~35% of California-Nevada is in drought (with Severe to Exceptional Drought [D2-D4] conditions in Nevada). An additional ~45% of the region is Abnormally Dry (D0).
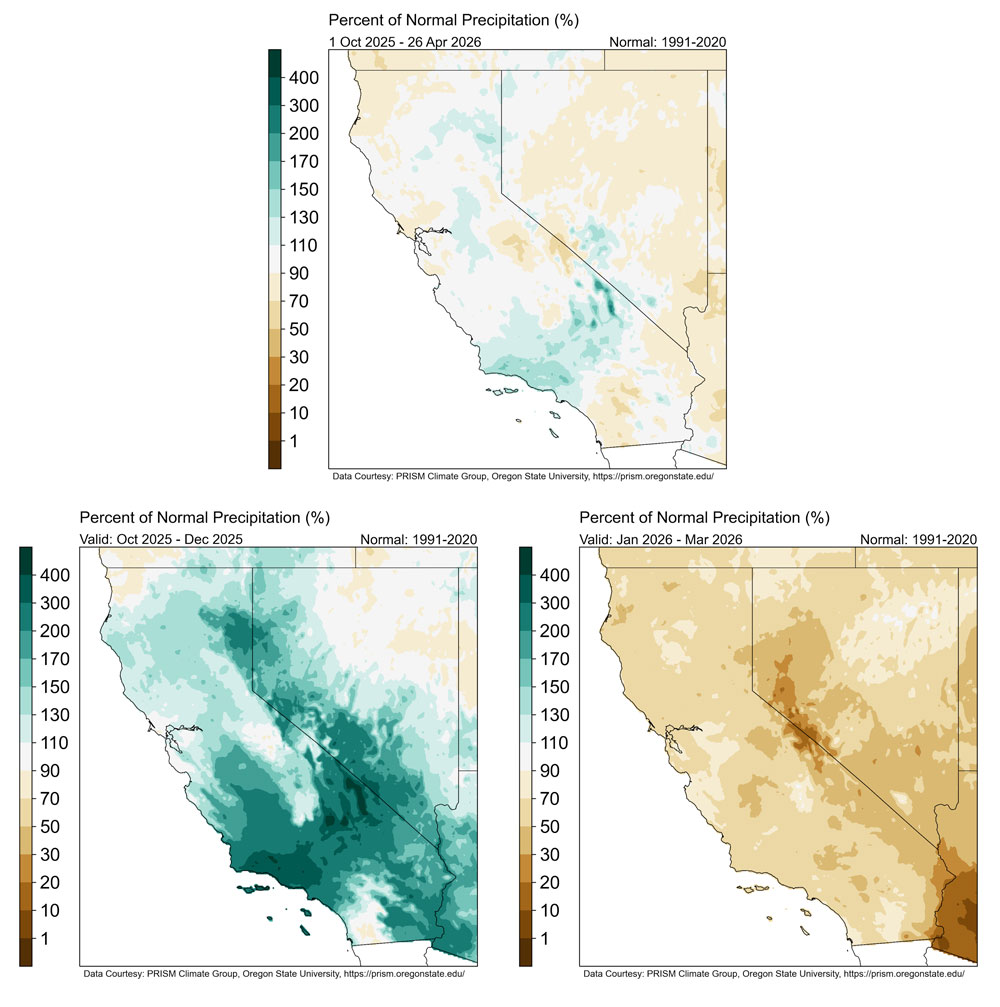
- The wet/winter season (October–March) has ended with near-normal precipitation for much of the region. However, it was divided into a wet first three months (October–December), with 62% of the region receiving above-normal precipitation (>130% of normal), and a dry second three months (January–March), with 88% of the region receiving below-normal precipitation (<70% of normal). A few large atmospheric rivers contributed significantly to the precipitation.
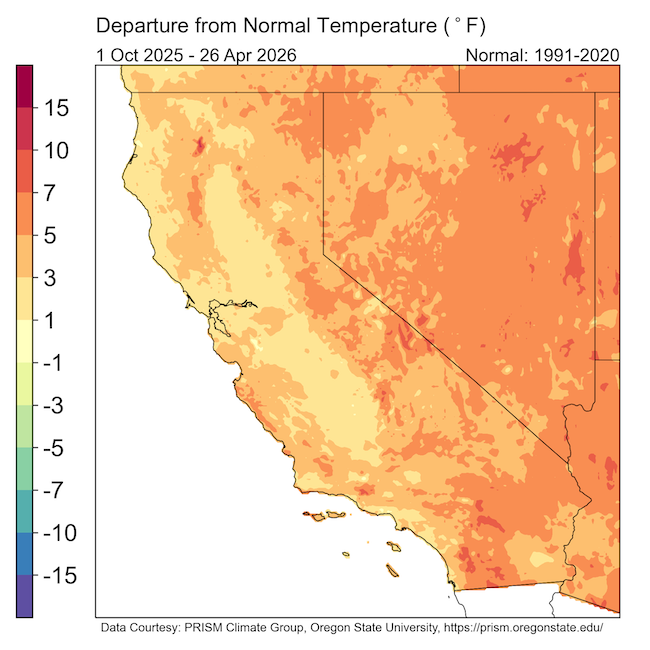
- This March was one of the driest and warmest in the 126-year record, contributing to high evaporative demand (the “thirst of the atmosphere”) and rapid snow melt. Snow melt was between half a month to two months earlier than normal at many stations throughout the region.
- Major California water supply reservoirs remain near or above their historical averages. Reservoirs in Nevada are above or near April 1 median storage (except for Rye Patch and Marlette Lake).
- On April 1st Lake Powell was at 25% of capacity which was a 8% decline from the year prior, and Lake Mead was at 33%, a 1% decline. Further, the Upper Colorado River snow water equivalent is only 36% of median peak, the lowest in a record dating back to 1986.
- After a dry March, April showers have brought precipitation throughout the region, including 3-13 inches of precipitation throughout northern California.
Water Year Precipitation in California and Nevada was Divided into a Wet Period and a Dry Period
Warm Temperatures Since October Contributed to Snow Drought
Outlooks and Potential Impacts for California-Nevada
- The National Weather Service Climate Prediction Center (CPC) outlooks favor a warmer-than-normal May–July for California and Nevada. There are equal chances of below-, near-, and above-normal precipitation during this time, which is climatologically a dry period for the region.
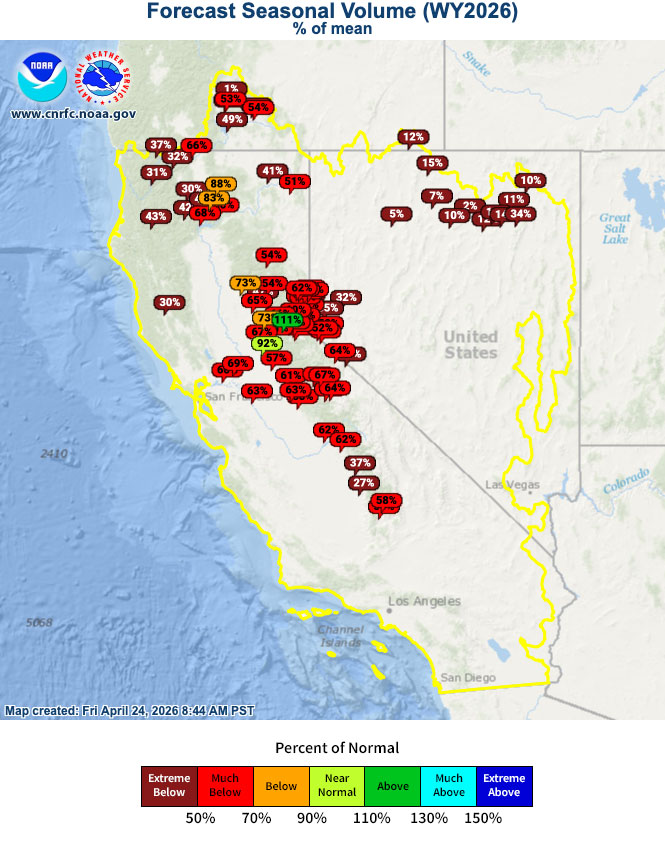
- Seasonal (April–July) runoff volume is predicted to be much below normal in California-Nevada due to the snow drought and early season melt. For the Lower Colorado River Basin, the unregulated inflow into Lake Powell is forecast to be 22% of normal.
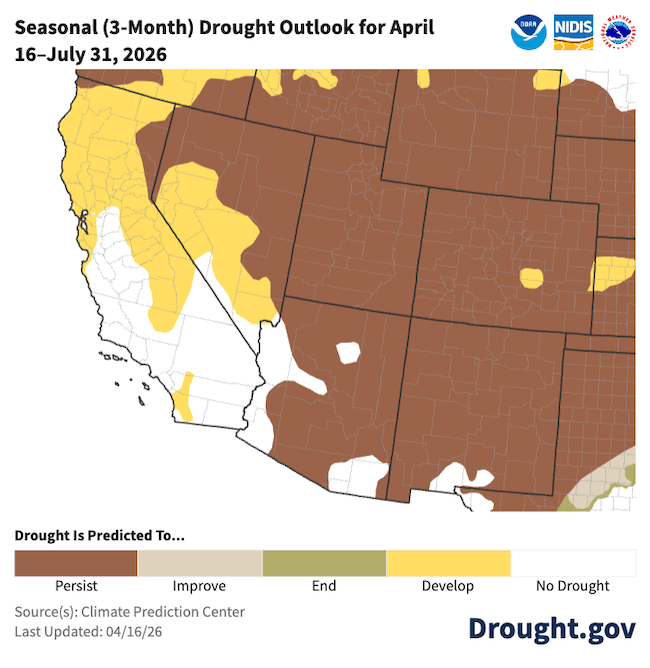
- Over the next three months, drought is forecast to persist and develop in both states. Drought is favored to develop in the Abnormally Dry (D0) parts of the region.
- The National Interagency Coordination Center forecasts above-normal significant wildland fire potential for parts of northern California and eastern Nevada in June, with fire potential expanding in these regions in July.
- In Southern California (and also likely nearby regions), these conditions are predicted to impact public health, power generation, and potentially crop stress and/or future agricultural productivity.
Significantly Below Normal Seasonal (April-July) Runoff Volumes Forecast
Drought Development Favored Over the Next 3 Months in “Abnormally Dry” Areas of California-Nevada
Above-Normal Significant Wildland Fire Potential Expands in June
Resources
- Explore regional and state drought information:
- NIDIS and partners are piloting a series of Southern California Sector-Specific Drought Early Warning Outlooks in Water Year 2025–2026. View the latest update from April 23, or learn more and get involved by contacting Amanda Sheffield (amanda.sheffield@noaa.gov).
Join us for the next bi-monthly webinar on June 8, 2026 at 11 a.m. PT, which will provide an overview of climate and drought conditions, impacts, and outlooks.
Prepared By
Amanda Sheffield
California-Nevada DEWS Regional Drought Information Coordinator
Cooperative Institute for Research in Environmental Sciences (CIRES), University of Colorado Boulder
NOAA’s National Integrated Drought Information System
Julie Kalansky
Principal Investigator
California-Nevada Adaptation Program (a NOAA RISA team)
This Drought Status Update is issued in partnership between the National Oceanic and Atmospheric Administration (NOAA), the California-Nevada Adaptation Program (a NOAA RISA team), and the Western Regional Climate Center at the Desert Research Institute to communicate a potential area of concern for drought expansion and/or development within the California-Nevada DEWS region based on recent conditions and the upcoming forecast. NIDIS and its partners will issue future Drought Status Updates as conditions evolve. NIDIS is an interagency program within the Climate Program Office, which is part of NOAA's Office of Oceanic and Atmospheric Research.


