A March Meltdown: Historically Low Snowpack Melts Across the West, Signaling a Dire Water Supply Situation
Key Points
- Snowpack depth and water content typically peak around April 1, making the snow water equivalent (SWE, the amount of liquid water contained in the snowpack) on this date a primary indicator of spring runoff.
- This year, Arizona, Colorado, Idaho, Nevada, New Mexico, Oregon, Utah, and Wyoming all set new record-low April 1 SWE values since SNOTEL monitoring began in the 1980s. California recorded its second-lowest April 1 SWE value.
- Snow usually accumulates in March, but the record-shattering heat wave coupled with abnormally dry conditions led to rapid and early melting of an already historically low snowpack across most of the West. The exceptions are Washington and parts of Idaho and Montana.
- California River Basins experienced their driest March on record.
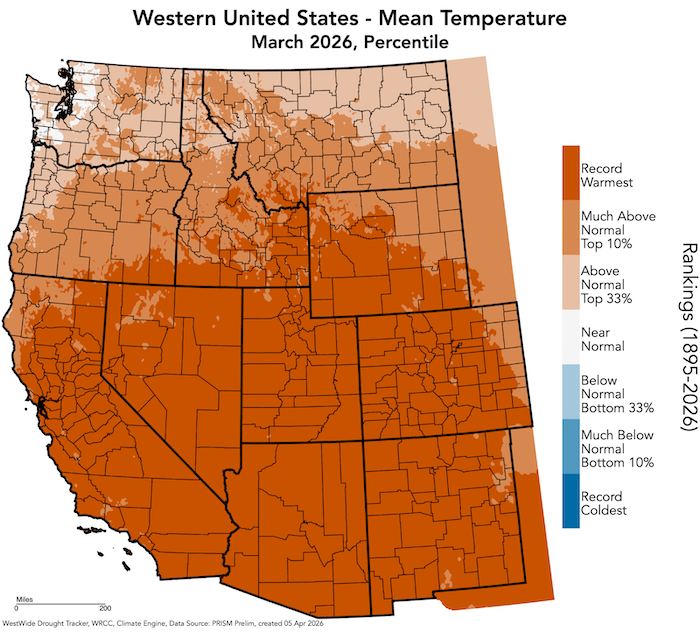
- The Colorado River Basin (Upper and Lower) experienced its warmest March on record, at 13.7 °F warmer than the normal.
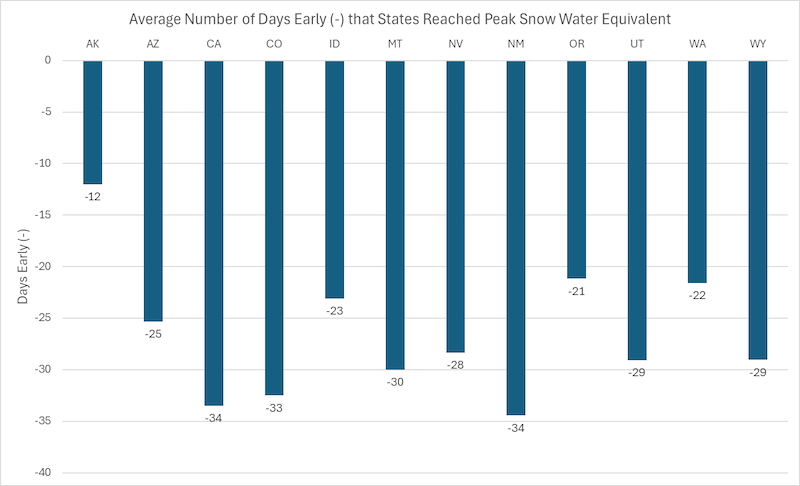
- According to SNOTEL observations, peak SWE across all Western states occurred an average of 21–34 days earlier than normal. Anomalies across some basins are larger. For example, SWE in the Upper Pecos and South Platte Rivers peaked 55 and 40 days earlier than normal, respectively. Only a few basins in the West reported a near-normal peak SWE date as of writing.
- At many streamflow forecast points across the West, the probability of new record low spring and summer runoff volumes has increased. A majority of streamflow forecast points in the Colorado River Basin are forecast to produce less than 30% of average runoff.
- The effect of the low volumes may be especially pronounced in the greater Missouri and Mississippi River Basins, where multiple consecutive years of low water flows have disrupted navigation.
- The Climate Prediction Center’s April–June outlook favors continued warmth across the West and dryness for parts of the region. Much of the West is entering into its climatologically warm and dry period, and any relief will depend on late spring storms and how active and widespread the monsoon season is. Drought conditions and impacts can be expected to deteriorate further.
- Many critical economic sectors like agriculture, energy production, and recreation have been or will be impacted this spring into summer. The worst impacts will likely be seen in parts of the the Pacific Northwest, Rio Grande Basin, and Colorado River Basin—areas that experienced consecutive years of droughts or snow droughts, and are starting the spring and summer with water storage deficits that are expected to worsen and further deplete.
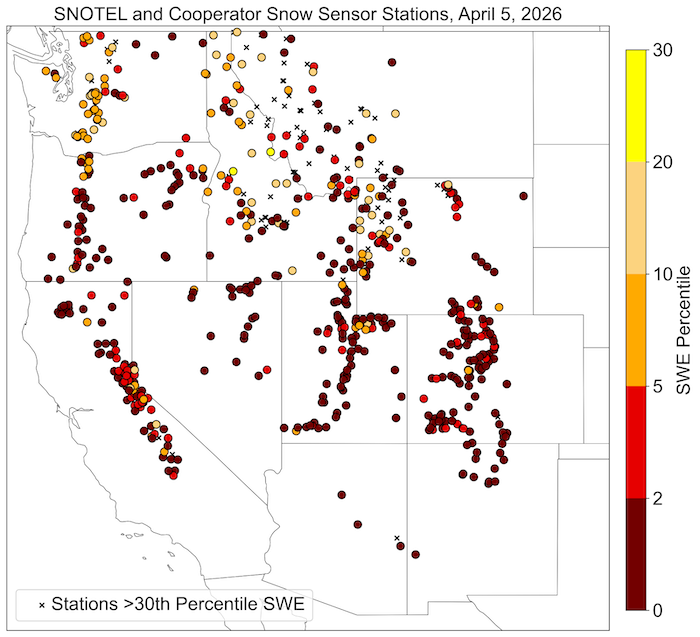
Snow water equivalent (SWE) values for watersheds in the Western U.S. as a percentage of the 1991–2020 median, based on measurements at SNOTEL weather stations. Only stations with at least 20 years of data are included in the basin median. This map is valid as of April 5, 2026. Source:
For an interactive version of this map, please visit the USDA Natural Resources Conservation Service.
Snow water equivalent (SWE) values for watersheds in Alaska as a percentage of the 1991–2020 median, based on measurements at SNOTEL weather stations and snow courses. Only stations with at least 20 years of data are included in the basin median. This map is valid as of March 31, 2026.
For an interactive version of this map, please visit the USDA Natural Resources Conservation Service.
Drought is defined as the lack of precipitation over an extended period of time, usually for a season or more, that results in a water shortage. Changes in precipitation can substantially disrupt crops and livestock, influence the frequency and intensity of severe weather events, and affect the quality and quantity of water available for municipal and industrial use.
Learn MoreSnow drought is a period of abnormally low snowpack for the time of year. Snowpack typically acts as a natural reservoir, providing water throughout the drier summer months. Lack of snowpack storage, or a shift in timing of snowmelt, can be a challenge for drought planning.
Learn MorePeriods of drought can lead to inadequate water supply, threatening the health, safety, and welfare of communities. Streamflow, groundwater, reservoir, and snowpack data are key to monitoring and forecasting water supply.
Learn MoreIn a drought, lower water levels or snowpack can affect the availability of recreational activities and associated tourism, and a resulting loss of revenue can severely impact supply chains and the economy. Drought—as well as negative perceptions of drought, fire bans, or wildfires—may also result in decreased visitations, cancellations in hotel stays, a reduction in booked holidays, or reduced merchandise sales.
Learn MoreDrought is defined as the lack of precipitation over an extended period of time, usually for a season or more, that results in a water shortage. Changes in precipitation can substantially disrupt crops and livestock, influence the frequency and intensity of severe weather events, and affect the quality and quantity of water available for municipal and industrial use.
Learn MoreSnow drought is a period of abnormally low snowpack for the time of year. Snowpack typically acts as a natural reservoir, providing water throughout the drier summer months. Lack of snowpack storage, or a shift in timing of snowmelt, can be a challenge for drought planning.
Learn MorePeriods of drought can lead to inadequate water supply, threatening the health, safety, and welfare of communities. Streamflow, groundwater, reservoir, and snowpack data are key to monitoring and forecasting water supply.
Learn MoreIn a drought, lower water levels or snowpack can affect the availability of recreational activities and associated tourism, and a resulting loss of revenue can severely impact supply chains and the economy. Drought—as well as negative perceptions of drought, fire bans, or wildfires—may also result in decreased visitations, cancellations in hotel stays, a reduction in booked holidays, or reduced merchandise sales.
Learn MorePercent of Median Snow Water Equivalent
< 50% of Median
Current snow water equivalent (SWE) is less than 50% of the median SWE value for this day of the year, compared to historical conditions from 1991–2020.
50%–70% of Median
Current snow water equivalent (SWE) is between 50%–70% of the median SWE value for this day of the year, compared to historical conditions from 1991–2020.
70%–90% of Median
Current snow water equivalent (SWE) is between 70%–90% of the median SWE value for this day of the year, compared to historical conditions from 1991–2020.
90%–110% of Median
Current snow water equivalent (SWE) is between 90%–110% of the median SWE value for this day of the year, compared to historical conditions from 1991–2020.
110%–130% of Median
Current snow water equivalent (SWE) is between 110%–130% of the median SWE value for this day of the year, compared to historical conditions from 1991–2020.
130%–150% of Median
Current snow water equivalent (SWE) is between 130%–150% of the median SWE value for this day of the year, compared to historical conditions from 1991–2020.
>150% of Median
Current snow water equivalent (SWE) is greater than 150% of the median SWE value for this day of the year, compared to historical conditions from 1991–2020.
Percent of Median Snow Water Equivalent
< 50% of Median
Current snow water equivalent (SWE) is less than 50% of the median SWE value for this day of the year, compared to historical conditions from 1991–2020.
50%–70% of Median
Current snow water equivalent (SWE) is between 50%–70% of the median SWE value for this day of the year, compared to historical conditions from 1991–2020.
70%–90% of Median
Current snow water equivalent (SWE) is between 70%–90% of the median SWE value for this day of the year, compared to historical conditions from 1991–2020.
90%–110% of Median
Current snow water equivalent (SWE) is between 90%–110% of the median SWE value for this day of the year, compared to historical conditions from 1991–2020.
110%–130% of Median
Current snow water equivalent (SWE) is between 110%–130% of the median SWE value for this day of the year, compared to historical conditions from 1991–2020.
130%–150% of Median
Current snow water equivalent (SWE) is between 130%–150% of the median SWE value for this day of the year, compared to historical conditions from 1991–2020.
>150% of Median
Current snow water equivalent (SWE) is greater than 150% of the median SWE value for this day of the year, compared to historical conditions from 1991–2020.
Snow water equivalent (SWE) values for watersheds in the Western U.S. as a percentage of the 1991–2020 median, based on measurements at SNOTEL weather stations. Only stations with at least 20 years of data are included in the basin median. This map is valid as of April 5, 2026. Source:
For an interactive version of this map, please visit the USDA Natural Resources Conservation Service.
Snow water equivalent (SWE) values for watersheds in Alaska as a percentage of the 1991–2020 median, based on measurements at SNOTEL weather stations and snow courses. Only stations with at least 20 years of data are included in the basin median. This map is valid as of March 31, 2026.
For an interactive version of this map, please visit the USDA Natural Resources Conservation Service.
View an updated, interactive version of this map from the USDA's Natural Resources Conservation Service. You can also view SWE data on Drought.gov.
View an updated, interactive version of this map from the USDA's Natural Resources Conservation Service. You can also view SWE data on Drought.gov.
Drought is defined as the lack of precipitation over an extended period of time, usually for a season or more, that results in a water shortage. Changes in precipitation can substantially disrupt crops and livestock, influence the frequency and intensity of severe weather events, and affect the quality and quantity of water available for municipal and industrial use.
Learn MoreSnow drought is a period of abnormally low snowpack for the time of year. Snowpack typically acts as a natural reservoir, providing water throughout the drier summer months. Lack of snowpack storage, or a shift in timing of snowmelt, can be a challenge for drought planning.
Learn MorePeriods of drought can lead to inadequate water supply, threatening the health, safety, and welfare of communities. Streamflow, groundwater, reservoir, and snowpack data are key to monitoring and forecasting water supply.
Learn MoreIn a drought, lower water levels or snowpack can affect the availability of recreational activities and associated tourism, and a resulting loss of revenue can severely impact supply chains and the economy. Drought—as well as negative perceptions of drought, fire bans, or wildfires—may also result in decreased visitations, cancellations in hotel stays, a reduction in booked holidays, or reduced merchandise sales.
Learn MoreDrought is defined as the lack of precipitation over an extended period of time, usually for a season or more, that results in a water shortage. Changes in precipitation can substantially disrupt crops and livestock, influence the frequency and intensity of severe weather events, and affect the quality and quantity of water available for municipal and industrial use.
Learn MoreSnow drought is a period of abnormally low snowpack for the time of year. Snowpack typically acts as a natural reservoir, providing water throughout the drier summer months. Lack of snowpack storage, or a shift in timing of snowmelt, can be a challenge for drought planning.
Learn MorePeriods of drought can lead to inadequate water supply, threatening the health, safety, and welfare of communities. Streamflow, groundwater, reservoir, and snowpack data are key to monitoring and forecasting water supply.
Learn MoreIn a drought, lower water levels or snowpack can affect the availability of recreational activities and associated tourism, and a resulting loss of revenue can severely impact supply chains and the economy. Drought—as well as negative perceptions of drought, fire bans, or wildfires—may also result in decreased visitations, cancellations in hotel stays, a reduction in booked holidays, or reduced merchandise sales.
Learn MoreSnow Drought Conditions Summary
This update is based on data available as of Monday, April 6, 2026 at 12:00 a.m. PT. We acknowledge that conditions are evolving.
Quantifying snow drought values is an ongoing research effort. Here, we define snow drought as snow water equivalent (SWE) at or below the 20th percentile, which is a baseline guided by partner expertise and research. Note that reporting of SWE by Snow Telemetry (SNOTEL) stations may be unavailable or delayed due to technical, weather or other issues, which may affect snow drought depiction in this update.
Current Conditions
This winter has brought variable extremes across the West. The March heat wave shattered records across the Western United States, with the exception of Washington and Montana. This was the warmest March on record (since 1895) for Arizona, California, Colorado, Idaho, Utah, and Wyoming, and the second warmest on record for Oregon. The record warm March comes after a record warm winter—which was the warmest December–February on record (since 1895) in Arizona, Colorado, Nevada, New Mexico, Oregon, Utah, and Wyoming and the second warmest in California, Idaho, and Montana.
At the end of March, snow cover across the Western United States was 81,000 square miles—the lowest in the 26-year MODIS satellite record. This is a 46% decrease in snow cover from 149,000 square miles at the end of February. The persistent record warm temperatures continue to make snowfall and accumulation challenging, even at the highest elevations across the West. On April 1, 64% (1,012 of 1,570) of the SNOTEL and snow course survey locations across the Western United States tied or reached new record low SWE. One-quarter of the new record lows occurred at snow course survey locations with over 70 years of record, as some of the longest standing low SWE records were broken.
The “snow-eater heat wave” of March—combined with abnormally dry conditions in much of the West—caused abrupt, early, and rapid snowmelt, accelerating the snow drought in an already record low snow season. Many locations have already melted out or are melting. Snow water equivalent (SWE, the amount of liquid water contained in the snowpack) typically peaks around April 1, and SWE on this date is a primary indicator of spring runoff. Normally, during spring and summer, the snowpack gradually melts, sustaining streamflows throughout summer. However, when peak snowpack is low and the snow melts early, the challenge is compound: a low total water supply that arrives early in the season.
Jump to conditions for your region:
- Colorado, Idaho, Montana, Utah, Wyoming (Rocky Mountains) Snow Conditions
- Arizona and New Mexico Snow Conditions
- Oregon and Washington Snow Conditions
- California and Nevada Snow Conditions
- Alaska Snow Conditions
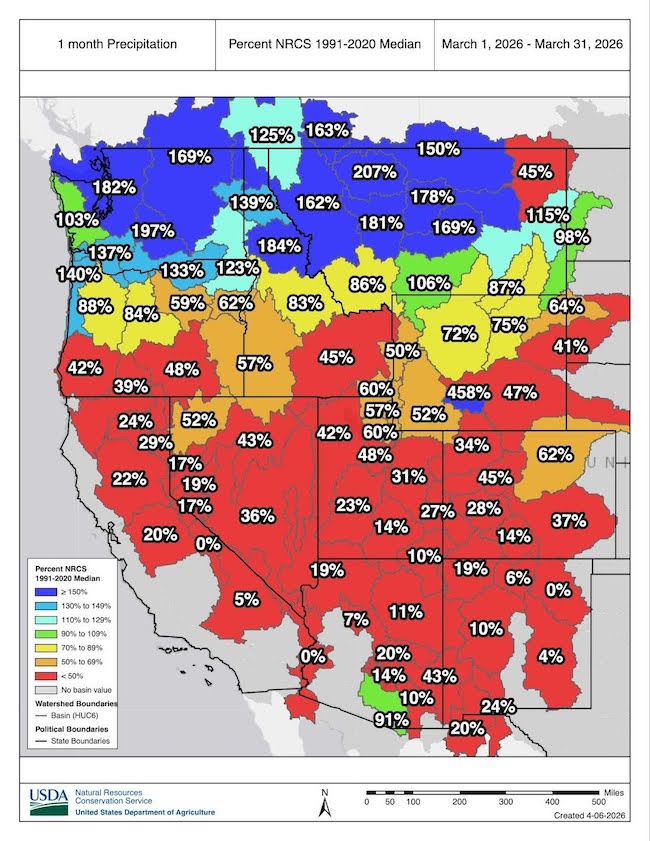
March Was Dry, Except in the Northwest
March Heat Wave Melts Snow
Most of the West Is Experiencing Record-Low Snow Water Equivalent
Meltout Begins Nearly a Month Early Across the West
Substantial Snow Water Equivalent (SWE) Deficits
Rocky Mountain Snow Conditions (Colorado, Idaho, Montana, Utah, Wyoming)
Northern Rocky Mountains
- 55% of stations in Montana are in snow drought
- 76% of stations in Idaho are in snow drought
- 82% of stations in Wyoming are in snow drought
March precipitation was much above normal in northern Idaho and most of Montana. However, the regional precipitation gradient was sharp: March was extremely dry in southern Idaho, southwest Montana, and much of Wyoming. The region also was impacted by the extensive March heat wave that led to early snowmelt. Snowpack is low in most places. Even in areas that received considerable precipitation, basin-level snow water equivalent (SWE) is generally 50-90% of median. No snow remains in the Belle Fourche and Cheyenne Basins in eastern Wyoming, where meltout occurred 12 and 25 days earlier than normal, respectively. The Powder, North Platte, Upper Bear, and Upper Green Basins in Wyoming and the Upper Snake and Middle Snake-Boise Basins in Idaho are in severe snow drought, with SWE at or less than 50% of median.
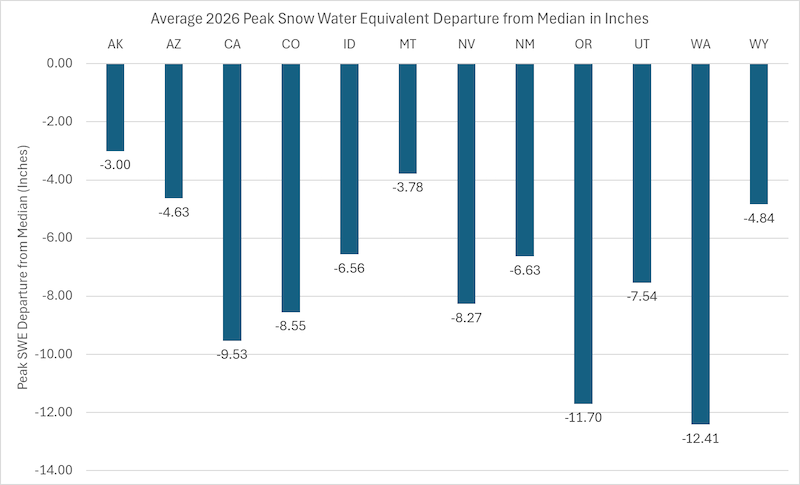
Statewide average SWE in Idaho is currently 11.2 inches, the second lowest on record (since 1982), or 52% of the median peak SWE. Peak SWE this year occurred about 23 days earlier than average. About 25% of SNOTEL stations have melted out already, and the meltout date ranged from 20 to 63 days early.
Montana statewide average SWE is 12.8 inches, or 72% percent of the median peak SWE. Peak SWE in Montana is about 30 days early, although it is possible that some basins have not reached peak yet. Snow has completely melted at about 16% of stations in Montana.
In Wyoming, statewide average SWE is the lowest on record (since 1981) at 8.8 inches and 49% of the median peak SWE> Peak SWE occurred about 29 days early. Meltout has occurred at about 25% of the state’s SNOTEL stations, 30 to 62 days early. April 1 SWE was the lowest on record (or tied for lowest) at 35 of 50 manual snow course sites.
Central Rocky Mountains
- 100% of stations in Utah are in snow drought
- 97% of stations in Colorado are in snow drought
Snowpack across Utah and Colorado was already historically low before the record-shattering March heat. Nearly every major long-term climate station in both states set all-time record high mean March temperatures. March was also dry. Precipitation at a vast majority of SNOTEL sites was less than 50% of normal, preventing the already-melting basins from accumulating any moisture.
Snow water equivalent (SWE) across all Hydrologic Unit Code (HUC) 6 basins in Utah is at less than 50% of median, with many experiencing record early meltout. No snow remains in the Upper Colorado-Dirty Devil Basin. This is the earliest meltout of the basin since records began in 1986, and five weeks earlier than the previous earliest meltout. Across the state, about 70% of all SNOTEL stations have melted out 30–50 days earlier than normal. Utah’s statewide SWE currently is the lowest on record (since 1981) at 3.2 inches and is at 20% of the median peak SWE, which occurred on April 2. Peak statewide SWE occurred about 29 days early.
In Colorado, SWE peaked on March 9, nearly a month earlier than average, at 8.55 inches. This was 51% of the median and the lowest Colorado peak SWE since SNOTEL recordkeeping began in the 1980s. As of April 5, mean SWE across the 115 SNOTEL stations in Colorado was 4.1 inches, only 24% of the 30-year median. Looking at the SWE for the previous lowest year on record, the amount of SWE present in 2026 is 50% less than that of the previous lowest-SWE year.
Arizona and New Mexico Snow Conditions
- 100% of stations in New Mexico are in snow drought
In Arizona and New Mexico, March was dry with record-shattering temperatures. The record low snow season continued, and snowpack disappeared at most SNOTEL stations. This is the warmest start to the water year (October 1, 2025–September 30, 2026) on record for both New Mexico and Arizona. The statewide average temperature for Arizona was 14 °F above normal for March.
Arizona’s statewide average snow water equivalent (SWE) is currently the lowest on record at 0.6 inch and 20% of median. Peak SWE in Arizona typically occurs in early March, and the majority of SNOTEL stations have a median SWE of zero by early April. Median April 5 SWE is greater than zero at only four SNOTEL stations. Currently, three of those stations have no snow, and the fourth (Snowslide Canyon) has 1.7 inches, the lowest on record. Most SNOTEL stations had a peak SWE less than 50% of median this year, and melted out three to six weeks early.
In New Mexico, statewide average SWE is also the lowest on record at 1.4 inches and 11% of the median peak SWE, which occurs on March 22. Similar to Arizona, SWE at most sites in New Mexico peaked at less than 50% of median. Most SNOTEL stations across the state melted out at least one month early. Snow remains at only 2 of 14 SNOTEL stations that have a median SWE greater than zero on April 5. As of April 5, SWE across the state was 58% lower than that of the previous lowest-SWE year. Record low SWE persists in the Rio Grande Basin, which is already facing multiple years of water shortages, and as a result, very low reservoirs.
* There was not enough data from Arizona SNOTEL stations to calculate snow drought statistics.
Oregon and Washington Snow Conditions
- 88% of stations in Washington are in snow drought
- 100% of stations in Oregon are in snow drought
In March, western and southeastern Washington were wetter than normal, and March was one of the top 10 wettest for some weather stations. Most of Oregon and eastern Washington were much drier than normal. Both states were less impacted by the March heat wave than the rest of the West, but temperatures were still above average, initiating early snowmelt throughout the region. Average temperatures over the last 30 days were 5–9 °F above average over most of Oregon and 1–4 °F above average over eastern Washington. In Oregon, the first half of the Water Year 2026 tied for the second warmest October–March on record, and winter (December-February) tied with 2015 as the second warmest on record at 4.8 °F above the 1991–2020 average. Despite some pockets of cooler-than-normal temperatures in March, the 2026 Water Year in Washington is the fourth warmest on record.
This record warmth was the primary contributor to Oregon’s poor snowpack. Across Oregon, snow water equivalent (SWE) is nearing or surpassing record lows at many locations. HUC 6 basin values range from 0% (John Day Basin) to 36% (Middle Columbia Basin) of median SWE. Nearly three-quarters of SNOTEL stations in the state have lost all snow over one month early. As of April 5, the statewide average SWE from 97 SNOTEL stations is 2.1 inches, 12% of the median peak SWE. This is the lowest SWE on record (since 1981), surpassing the previous low in 2015. SWE likely peaked in late February, about one month early.
Despite wet conditions in March and above-average water year to date precipitation in most of Washington, snow drought remains widespread across Washington due to warm temperatures bringing more rain than snow. Snowpack remains much below normal across the state except at a few higher-elevation stations in the northern Washington Cascade Range. Meltout has occurred at about 20% of SNOTEL stations, about a month early. The statewide average SWE from 91 SNOTEL stations is currently 15.8 inches, only 52% of the median peak. That means there is nearly half as much water in the snowpack than there would be in a normal year. Peak SWE this year likely occurred in mid-March, about three weeks early. On April 8, Washington declared a statewide drought due to dismal snowpack.
California and Nevada Snow Conditions
- 98% of stations in California are in snow drought
- 100% of stations in Nevada are in snow drought
A dry and warm March, with record-breaking heat, led to rapid snowmelt across California and Nevada. Both states are at or near record low snowpack for the beginning of April.
April 1 snow water equivalent (SWE) in California was the second lowest on record at 20% of median, lower than 1977 and 2014 (25% of median) but not as low as 2015 (5%). The date California reached statewide peak SWE, February 24, was the third earliest in the twenty-first century. SWE on that date was 61% of median April 1 SWE. As of April 6, data from SNOTEL and California Department of Water Resources stations show HUC 6 basin level SWE ranging from 5% (Upper Sacramento Basin) to 34% (Tulare-Buena Vista Lakes and Mono-Owens Lakes Basins) of median. About 50% of stations have already melted out, which is 17 to 78 days early. The California April 1 snow survey at the 237 locations with at least 50 years of data documented 9 locations with record low SWE and 82 locations where SWE was tied with one or more years for record low.
SWE in basins across Nevada ranges from just 1% (Humboldt Basin) to 38% (Walker Basin) of median. Essentially no snow remains at SNOTEL stations in the Humboldt Basin (just 0.2 inch of SWE), and the meltout this year will be the earliest since records started in 1981. Statewide SWE, averaged across 66 SNOTEL stations, was 2.6 inches, 13% of the median peak SWE and the lowest on record. SWE peaked in late February, over one month early. Only 4 of 27 SNOTEL stations in Nevada still have snow. Meltout at the other stations occurred 34 to 61 days early.
Alaska Snow Conditions
48% of stations in Alaska are in snow drought
Snow drought conditions are present throughout Southcentral Alaska and along the central-south slope of the Brooks Range. Much-below-normal precipitation is the main driver of low snowpack in Alaska; unlike the Western U.S., Alaska was not impacted by the March heat wave and early snowmelt. In fact, temperatures in March reached record lows in many locations, including Anchorage and Fairbanks.
Several locations in the Susitna River Basin, including the Fishhook Basin, Archangel Road, and Denali View snow courses and Tokositna Valley SNOTEL, set record low April 1 snow water equivalent (SWE) values. April 1 snow course and SNOTEL measurements also showed much-below-normal snowpack in the Cook Inlet, Kenai Peninsula, and Prince William Sound Basins, with SWE at 37%, 51%, and 60% of median, respectively. The Koyukuk River Basin along the south slope of the Brooks Range is at 66% of median SWE (based on an average of seven snow courses and SNOTEL stations). Early snowmelt is not yet being observed in Alaska due to the persistent cold temperatures.
Looking Ahead
Water Supply Forecasts
Water supply forecasts across the West demonstrate the impacts of the record low snow year. Many forecasts continue to trend towards record lows. Water supply forecasts from the Colorado Basin River Forecast Center are well-below average, with most sites forecast to see less than 30% of average season runoff. The forecast unregulated inflow into Lake Powell is only 22% of average, and the probability of record low April–July runoff volumes has increased. Forecast seasonal water supply volumes from the California-Nevada River Forecast Center have dropped; most locations are forecast to receive 50-75% of median April-July runoff. In the Northwest, April–September runoff volume forecasts are trending below normal, according to the Northwest River Forecast Center, with some exceptions in northern Washington. Forecasts from the Missouri River Basin Forecast Center range around 78% of average runoff for the Missouri Basin above Fort Peck, Montana. Water supply will continue to be a critical concern as the West heads into spring and summer, when there is stronger evaporative demand (thirst of the atmosphere) and human demand for water, which could further reduce water supplies.
Wildfire
Low snowpack and fire don't have a one-to-one relationship, but low snowpack can lead to an early start to the fire season. Local conditions - previous and current - will determine wildfire risk. The persistent record-breaking warmth this year has led to increased and rapid dry down of the landscape increasing fire concerns. An extended fire season is a critical concern, but these conditions do not guarantee fire activity, as ignition is required to generate large wildfires.
The National Interagency Fire Center (NIFC) outlooks reflect the impact of early snow loss, indicating the potential for an early start to the fire season for parts of the West. June outlooks show above-normal significant fire potential for most of the Four Corner states and parts of California, Washington, and Oregon. This is earlier than normal, especially in the higher elevations of the Sierra, Cascades, and Rocky Mountains.
Climate and Drought Outlooks
In the near term, a more active weather pattern is settling in over the West. The Sierra Nevada and Cascade mountain ranges are forecast to see fairly significant precipitation over the next 7 days. Any precipitation is beneficial, but will not offset the significant deficits that have accumulated. While temporary, this moisture could bolster the dwindling snowpack for some and prevent meltout from occurring as quickly as it has been. The Climate Prediction Center (CPC) outlooks for the rest of the month favor continued above-normal temperatures and the potential for below-normal precipitation for most of the West. Looking ahead to the summer, substantial relief appears unlikely. The CPC shows increased chances for continued warmth across the West and dryness for parts of the region. Much of the West is entering into its climatologically dry period, and any relief will depend on late spring storms and how active and widespread the monsoon season is. Drought conditions and impacts can be expected to deteriorate further.
For More Information, Contact:
Dan McEvoy
Desert Research Institute, Western Regional Climate Center
daniel.mcevoy@dri.edu
Jason Gerlich
University of Colorado Boulder Cooperative Institute for Research in Environmental Sciences / NOAA’s National Integrated Drought Information System
jason.gerlich@noaa.gov
Tony Bergantino
Wyoming State Climate Office, University of Wyoming
antonius@uwyo.edu
Amanda Sheffield
University of Colorado Boulder Cooperative Institute for Research in Environmental Sciences / NOAA’s National Integrated Drought Information System
amanda.sheffield@noaa.gov
NIDIS and its partners launched this snow drought effort in 2018 to provide data, maps, and tools for monitoring snow drought and its impacts as well as communicating the status of snow drought across the United States, including Alaska. NIDIS is an interagency program within the Climate Program Office, which is part of NOAA's Office of Oceanic and Atmospheric Research.
Thank you to our partners for your continued support of this effort and review of these updates. If you would like to report snow drought impacts, please use the link below. Information collected will be shared with the states affected to help us better understand the short- term, long- term, and cumulative impacts of snow drought to the citizens and the economy of the regions reliant on snowpack.
Report Your Snow Drought Impacts
Data and Maps | Snow Drought
Research and Learn | Snow Drought