Inconsistent Summer Precipitation Across the Southern Plains
Key Points
- Rainfall has been highly inconsistent across the Southern Plains this summer.
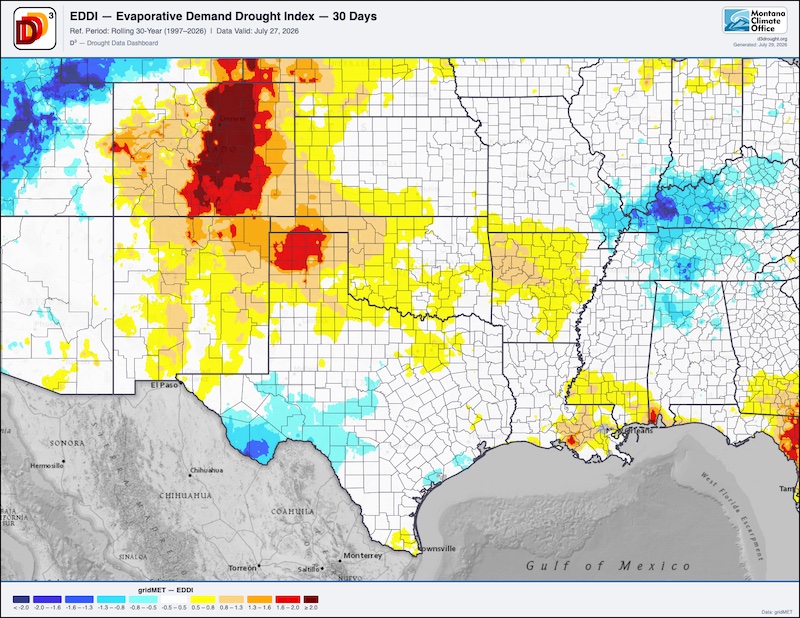
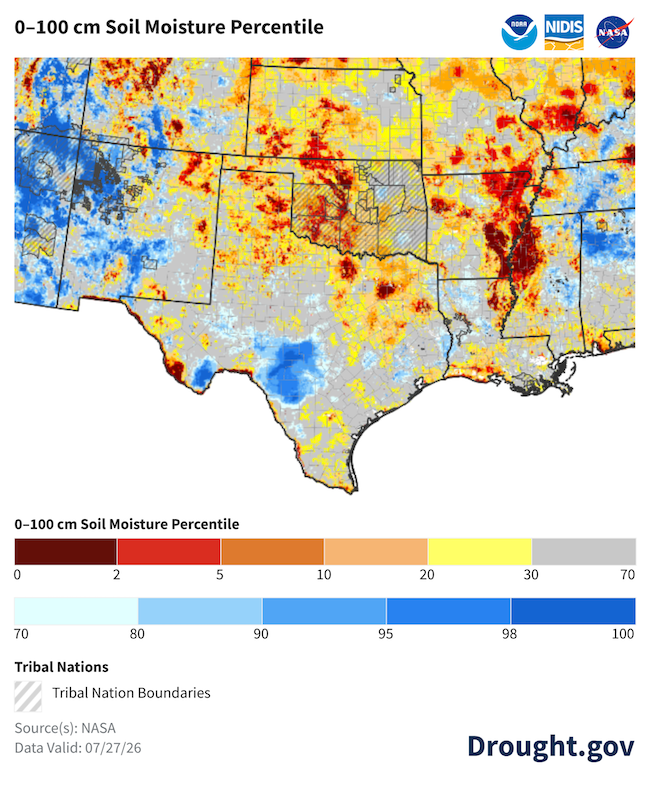
- High temperatures (in excess of 100ºF) and periods of high evaporation have reduced soil moisture across northern Texas and western Oklahoma.
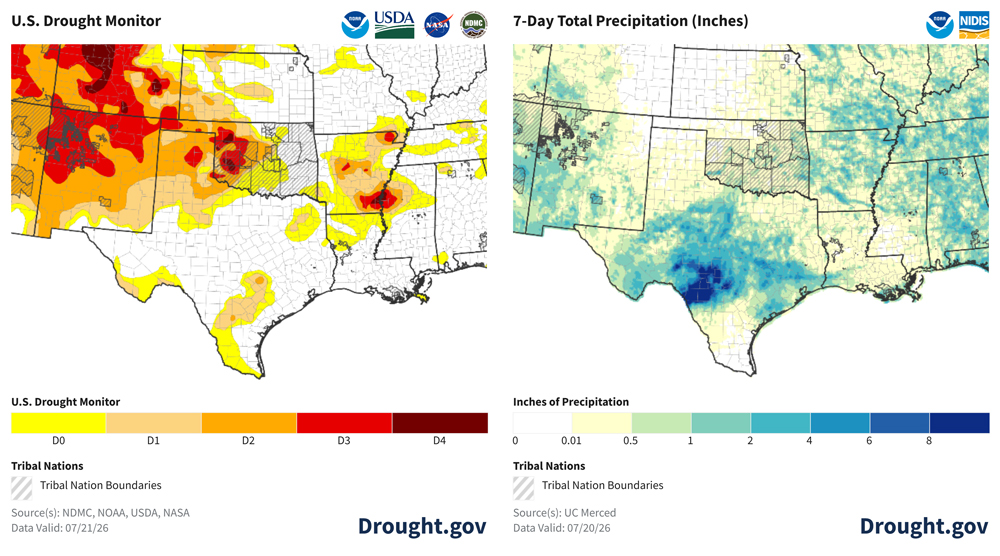
- Heavy rainfall and flooding in central Texas in mid-July mostly missed drought-affected areas.
- Southern Kansas had drought in May, floods in June, and then drought with intense heat in July, creating poor growing and harvesting conditions for spring wheat and other crops.
- Though drought conditions have improved in the Southern Plains overall since June, portions of Northern Texas, Oklahoma, and Kansas continue to face significant drought challenges, including increasing wildfire risk and harming crops, rangelands and water supplies.
- Long-range forecasts suggest high temperatures are likely to continue through August to October. There are near equal chances for above- or below-normal precipitation in this time.
- Long-term drought in eastern Texas is expected to improve. Long-term drought in western Oklahoma and Kansas will likely persist into early fall.
- A strong El Niño event is expected to bring a wetter and cooler winter to Texas.
This update is based on data available as of Tuesday, July 28, 2026 at 8:00 a.m. MT. We acknowledge that conditions are evolving.
30-day percent of average precipitation for June 24–July 24, 2026, compared to historical conditions from 1991–2020. Brown hues indicate below-normal precipitation, and blue/green hues indicate above-normal precipitation.
Drought is defined as the lack of precipitation over an extended period of time, usually for a season or more, that results in a water shortage. Changes in precipitation can substantially disrupt crops and livestock, influence the frequency and intensity of severe weather events, and affect the quality and quantity of water available for municipal and industrial use.
Learn MorePeriods of drought can lead to inadequate water supply, threatening the health, safety, and welfare of communities. Streamflow, groundwater, reservoir, and snowpack data are key to monitoring and forecasting water supply.
Learn MorePrecipitation Shown as a Percentage of Normal Conditions
<25% of Normal
Precipitation was only 0% to 25% of the historical average for this location, compared to the same date range from 1991–2020.
25%–50% of Normal
Precipitation was 25% to 50% of the historical average for this location, compared to the same date range from 1991–2020.
50%–75% of Normal
Precipitation was 50% to 75% of the historical average for this location, compared to the same date range from 1991–2020.
75%–100% of Normal
Precipitation was 75% to 100% of the historical average for this location, compared to the same date range from 1991–2020.
100%–150% of Normal
Precipitation was 100% to 150% of the historical average for this location, compared to the same date range from 1991–2020.
150%–200% of Normal
Precipitation was 150% to 200% of the historical average for this location, compared to the same date range from 1991–2020.
200%–300% of Normal
Precipitation was 200% to 300% of the historical average for this location, compared to the same date range from 1991–2020.
>300% of Normal
Precipitation was greater than 300% of the historical average for this location, compared to the same date range from 1991–2020.
30-day percent of average precipitation for June 24–July 24, 2026, compared to historical conditions from 1991–2020. Brown hues indicate below-normal precipitation, and blue/green hues indicate above-normal precipitation.
Precipitation data from GridMET are updated daily, with a delay of 3 to 4 days to allow for data collection and quality control.
Drought is defined as the lack of precipitation over an extended period of time, usually for a season or more, that results in a water shortage. Changes in precipitation can substantially disrupt crops and livestock, influence the frequency and intensity of severe weather events, and affect the quality and quantity of water available for municipal and industrial use.
Learn MorePeriods of drought can lead to inadequate water supply, threatening the health, safety, and welfare of communities. Streamflow, groundwater, reservoir, and snowpack data are key to monitoring and forecasting water supply.
Learn MoreCurrent Conditions and Impacts for the Southern Plains
- Rainfall has been highly inconsistent across the Southern Plains this summer.
- While some areas benefited from localized storms, high temperatures (reaching 100°F or higher) and strong winds rapidly depleted soil moisture, stressing crops and pastures.
- Intense rainfall in the Texas Hill Country led to flash floods. Month-to-date rainfall totals in excess of 20 inches north of Uvalde and near Kerrville, Texas. Most rain fell between July 12-18 with the heaviest rain on July 14-16.
- Texas Hill Country floodwaters moving downstream may provide some relief for drought-impacted Corpus Christi as surface reservoirs capture excess water.
- Exceptional Drought (D4) persists in western Oklahoma.
- Conditions are deteriorating near Tripton, Oklahoma, which has gone 33 days (as of July 22) since the last storm with rainfall at least 0.1 inches.
- The Vegetation Drought Response Index (VegDri) indicates Severe to Extreme Drought (D2-D3) across western Oklahoma.
- The Evaporative Demand Drought Index (EDDI) remained high for Oklahoma and Kansas from mid-April through mid-May. Unusually high evaporative demand (the “thirst of the atmosphere”) can lead to drying of the landscape, even when precipitation has been near normal.
- It’s been a quiet Atlantic hurricane season so far, with only two named tropical storms: Arthur in June and Bertha in July. Both brought some rain to the Gulf Coast, where overall precipitation totals for summer are near average.
- Soil moisture across most of northern Texas, Oklahoma, and western Kansas is below the 10th percentile.
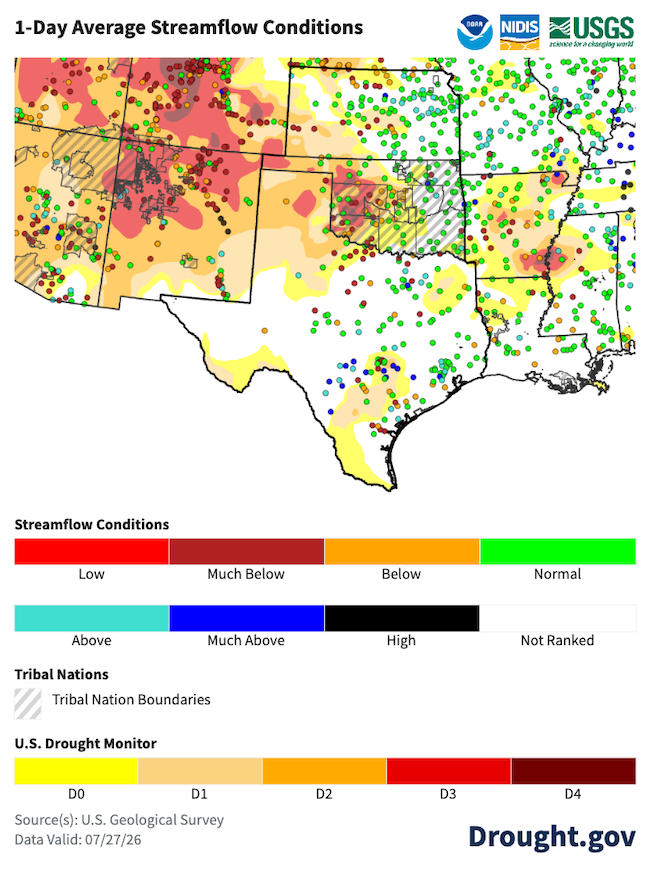
- Below-normal streamflows are generally present in areas that missed recent precipitation.
- Groundwater levels in the Edwards Aquifer recently increased, but remain below average. Groundwater conditions in this aquifer have been below-average since 2022.
Heavy Rainfall and Flooding Mostly Missed Drought-Affected Areas in Central Texas (July 13–20, 2026)
Thirsty Atmosphere: High Evaporative Demand Compounds Dry Conditions in Northern Texas
Soil Moisture Conditions Improved Across the Southern Plains, But Deficits Remain
Low Streamflow in Western Oklahoma and Kansas
Outlooks and Potential Impacts in the Southern Plains
- The National Weather Service Climate Prediction Center’s 6-10 and 8-14 day outlooks slightly favor below-normal or near-normal precipitation, with odds favoring above-normal temperatures across the Southern Plains.
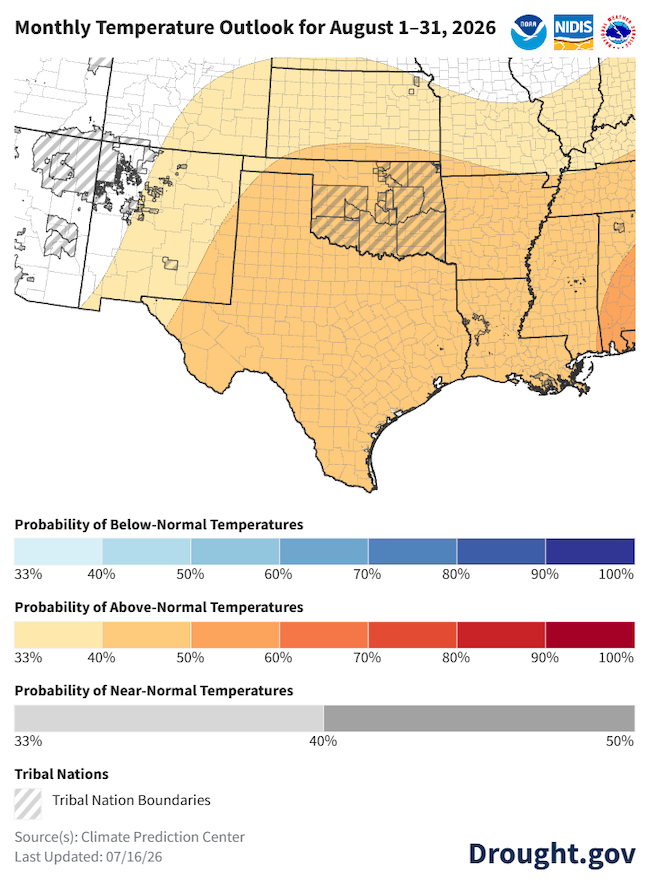
- The August to October outlooks show below-normal precipitation is most likely (33-40% chance) for coastal and eastern Texas, with odds favoring above-normal precipitation along the western edge of the region. Above-average temperatures are likely (more than 40% chance) for most of Texas with lower probabilities for Oklahoma and Kansas.
- El Niño is currently active
- El Niño conditions are usually associated with a cool, wet late-fall to winter for Texas. Historically, there is not a dominant summertime weather pattern during developing El Niños.
- Learn more about what El Niño could mean for drought in the Southern Plains.
August is Likely to Be Warmer than Normal
Additional Resources
Recent Reports
- New NOAA El Niño-Southern Oscillation Index Supports Drought Early Warning
- El Niño on the Horizon: Can the Warm Phase End Six Years of Drought in the Southern Plains of the U.S.?
- Measuring What Matters: Upper Missouri River Basin Studies Improve Drought and Flood Forecasts with Snow and Soil Moisture Data
Additional Resources by State
More local information is available from the following resources:
- Your state climatologist
- Your state page on Drought.gov:
- National Weather Service Drought Information Statements:
- Texas:
- July 6, 2026: Corpus Christi
- July 2, 2026: Austin/San Antonio
- July 2, 2026: El Paso/Santa Teresa
- July 2, 2026: Lubbock
- Texas:
- Oklahoma:
- July 2, 2026: Tulsa
- Kansas:
- July 6, 2026: Wichita
- July 5, 2026: Goodland
- June 29, 2026: Dodge City
More state and regional information is available from the following resources:
- Kansas: Climate and Drought in Kansas; Kansas Water Office; State Climate Office
- Oklahoma: Oklahoma Water Resources Board | Drought Monitoring; Oklahoma Mesonet Drought Tools; State Climate Office
- Texas: Texas Water Development Board | Drought; Texas Commission on Environmental Quality | Drought in Texas; Drought Dashboard: Water Data for Texas; Water Data for Texas | Texas Reservoirs; State Climate Office
- Regional: Southern Regional Climate Center, High Plains Regional Climate Center; Southern Climate Impacts Planning Program (SCIPP)
To report or view local drought impact information:
Prepared By
Joel Lisonbee
Cooperative Institute for Research in Environmental Sciences/University of Colorado Boulder and NOAA’s National Integrated Drought Information System, Southern Plains Drought Early Warning System
John Nielsen-Gammon and B.J. Baule
Office of the Texas State Climatologist, Southern Regional Climate Center, Texas A&M University
Matt Sittel
Kansas State Climate Office
Mack Morris
National Weather Service, Austin/San Antonio Weather Forecast Office
This Drought Status Update is issued in partnership between the National Oceanic and Atmospheric Administration (NOAA) and partners to communicate a potential area of concern for drought expansion and/or development within the Southern Plains Drought Early Warning System region based on recent conditions and the upcoming forecast. NIDIS and its partners will issue future Drought Status Updates as conditions evolve. NIDIS is an interagency program within the Climate Program Office, which is part of NOAA’s Office of Oceanic and Atmospheric Research.