A Parade of Atmospheric Rivers Continues to Dump Snow on California and Parts of the West.
Key Points:
- A continuous barrage of atmospheric rivers have made landfall in central and northern California, spreading copious amounts of mountain snowfall in the Sierra Nevada, Great Basin, and parts of the Upper Colorado River Basin.
- Snow water equivalent (SWE) is currently at 200% to over 300% of normal for much of this region, with record high SWE for this time of year at a number of SNOTEL sites in the Sierra Nevada.
- There are still small areas of snow drought in isolated regions, including the Sangre De Cristo Mountains, straddling the New Mexico-Colorado border.
- The northern Rockies is another region to keep an eye on, with many locations at near-to-slightly below normal SWE in northern Idaho, western Montana, and northern Wyoming.
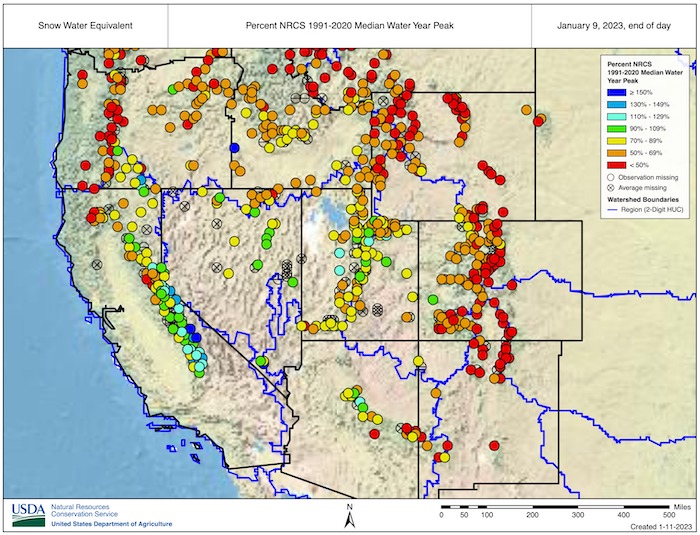
Snow Telemetry (SNOTEL) snow water equivalent (SWE) values for watersheds in the western U.S. as a percentage of the USDA Natural Resources Conservation Service (NRCS) 1991–2020 median. Only stations with at least 20 years of data are included in the station averages.
The SWE percent of normal represents the current SWE at selected SNOTEL stations in or near the basin compared to the median value for those stations on the same date. This map is valid as of January 9, 2023.
For an interactive version of this map, please visit NRCS.
Snow Telemetry (SNOTEL) snow water equivalent (SWE) values for watersheds in Alaska as a percentage of the USDA Natural Resources Conservation Service (NRCS) 1991–2020 median. Only stations with at least 20 years of data are included in the station averages.
The SWE percent of normal represents the current SWE at selected SNOTEL in or near the basin compared to the median value for those stations on the same date. This map is valid as of January 9, 2023.
For an interactive version of this map, please visit NRCS.
SWE Percent of NRCS 1991–2020 Median
SWE Percent of NRCS 1991–2020 Median
Snow Telemetry (SNOTEL) snow water equivalent (SWE) values for watersheds in the western U.S. as a percentage of the USDA Natural Resources Conservation Service (NRCS) 1991–2020 median. Only stations with at least 20 years of data are included in the station averages.
The SWE percent of normal represents the current SWE at selected SNOTEL stations in or near the basin compared to the median value for those stations on the same date. This map is valid as of January 9, 2023.
For an interactive version of this map, please visit NRCS.
Snow Telemetry (SNOTEL) snow water equivalent (SWE) values for watersheds in Alaska as a percentage of the USDA Natural Resources Conservation Service (NRCS) 1991–2020 median. Only stations with at least 20 years of data are included in the station averages.
The SWE percent of normal represents the current SWE at selected SNOTEL in or near the basin compared to the median value for those stations on the same date. This map is valid as of January 9, 2023.
For an interactive version of this map, please visit NRCS.
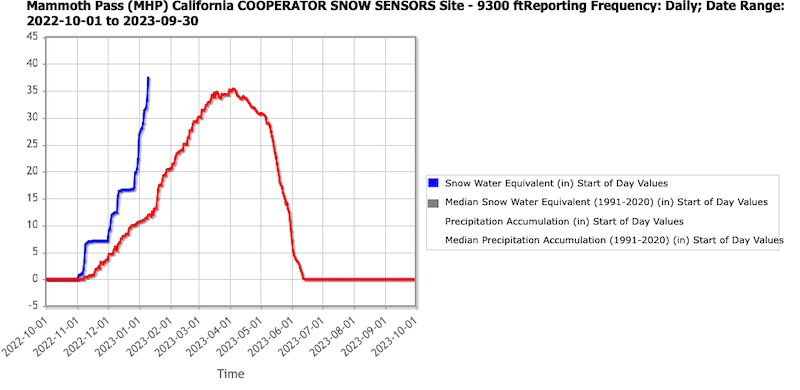
The big story at the moment is the abundance of snow, not the lack of snow, across a large swath of the West. An almost continuous barrage of atmospheric rivers, beginning in the last few days of December, have made landfall in central and northern California, spreading copious amounts of precipitation (including mountain snowfall) in the Sierra Nevada, Great Basin, and parts of the Upper Colorado River Basin. These storms have been largely beneficial for drought improvements, but excessive rainfall has caused major flooding in parts of California. Snow water equivalent (SWE) is currently at 200% to over 300% of normal for much of this region, with record high SWE for this time of year at a number of SNOTEL sites in the Sierra Nevada. Even more encouraging is that many locations, especially at higher elevations, have already exceeded water year peak SWE values that typically occur from mid-March to mid-April. One example is Mammoth Pass, California, in the eastern Sierra Nevada, which currently has 37.4 inches of SWE, 314% of median for the date, and 104% of median water year peak.
All that said, there is still a small spatial extent of snow drought in isolated regions. The Sangre De Cristo Mountains, straddling the New Mexico–Colorado border, is one of those regions. SWE at most SNOTEL sites in the Sangre De Cristo Mountains is in the range of about 40%–70% of normal. This area has been in the southeast of the storm track with minor impacts but not nearly the amounts of snow that have fallen further north and west. The snowpack in southeastern Arizona and southwestern New Mexico in the Gila Mountains has improved substantially since mid-December. The northern Rockies is another region to keep an eye on, with many locations at slightly below normal SWE (75%–90%) and a number of locations in northern Idaho, western Montana, and northern Wyoming in the 15th–30th percentile.
In Alaska, where observations are limited, most SNOTEL sites indicate that SWE is near normal to above normal, with very limited snow drought. An interesting pattern that set up in early December brought heavy snowfall to the Anchorage area but much less snow a short distance to the southeast around Turnagain Pass. SWE at the Anchorage Hillside SNOTEL site is currently 157% of normal SWE, whereas SWE at Mt. Aleyska, less than 50 miles away, is at just 71% of normal SWE. Snowpack is also below normal along the south side of the Alaska Range with very little snowfall since mid-December.
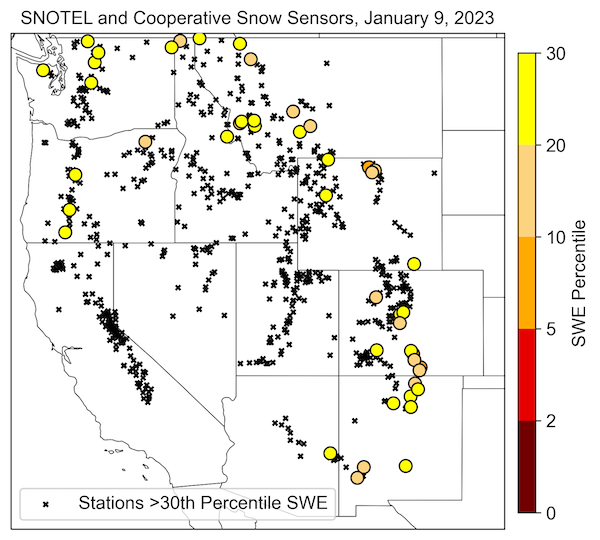
Stations with SWE Below the 30th Percentile
Snow Water Equivalent Percent of Water Year Peak
Daily SWE at Mammoth Pass, California
* Quantifying snow drought values is an ongoing research effort. Here we have used the 30th percentile as a starting point based on partner expertise and research. Get more information on the current definition of snow drought here.
For More Information, Please Contact:
Daniel McEvoy
Western Regional Climate Center
Daniel.McEvoy@dri.edu
Amanda Sheffield
NOAA/NIDIS California-Nevada Regional Drought Information Coordinator
Amanda.Sheffield@noaa.gov
Britt Parker
NOAA/NIDIS Pacific Northwest Regional Drought Information Coordinator
Britt.Parker@noaa.gov
NIDIS and its partners launched this snow drought effort in 2018 to provide data, maps, and tools for monitoring snow drought and its impacts as well as communicating the status of snow drought across the United States, including Alaska. Thank you to our partners for your continued support of this effort and review of these updates. If you would like to report snow drought impacts, please use the link below. Information collected will be shared with the states affected to help us better understand the short term, long term, and cumulative impacts of snow drought to the citizens and the economy of the regions reliant on snowpack.
Report Your Snow Drought Impacts Data and Maps | Snow Drought Research and Learn | Snow Drought

