The Deep Snowpack in California, the Great Basin, and Colorado River Basin Continues to Grow
Key Points
- While there has been minor geographic expansion of snow drought over the past month, the big story continues to be the deep snowpack that has accumulated and continues to grow in California, the Great Basin, and the Colorado River Basin.
- Following the strong atmospheric rivers earlier this winter, small-to-moderate storms with less moisture have resulted in smaller but continued snow water equivalent (SWE) gains.
- SWE at a subset of the SNOTEL stations in California, Nevada, Utah, Colorado, Wyoming, and Arizona is at record high or second highest for the date.
- SWE in much of Oregon, Washington, and Idaho grew relatively little over the last 30 days and is still well below the median water year peak at most SNOTEL stations. While most of these regions are not experiencing snow drought currently, the relatively dry January has left open the possibility of dry snow drought development in the coming months.
- SWE at several sites in the Sangre de Cristo Mountains in southern Colorado and northern New Mexico is about 45%–60% of normal for the date. A few other SNOTEL sites in New Mexico are also well below normal.
- SWE at most SNOTEL sites in Alaska is above normal. The exceptions are several sites on the Kenai peninsula, along the south slope of the Alaska Range and the Chulitna River, and along the south slope of the Brooks Range.
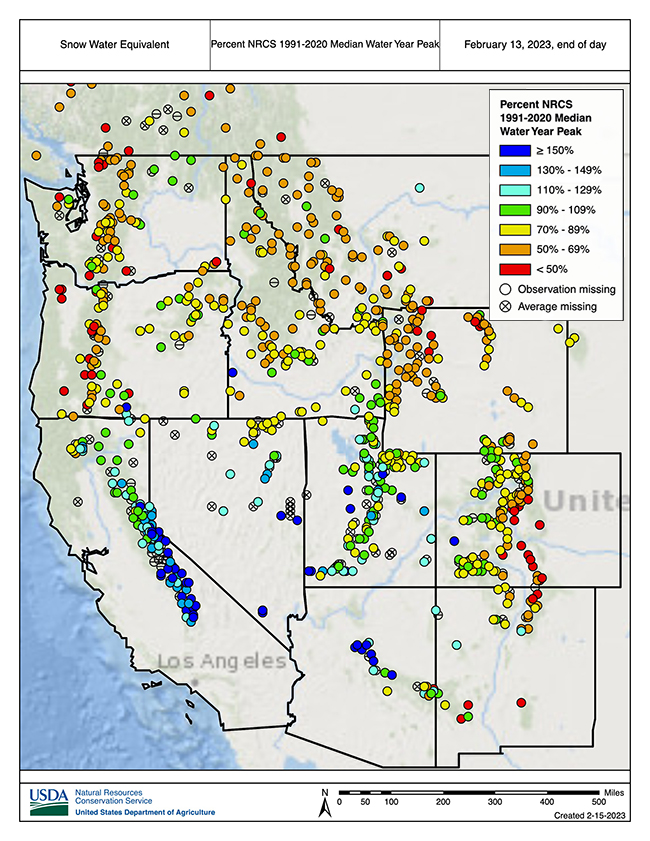
Snow Telemetry (SNOTEL) snow water equivalent (SWE) values for watersheds in the western U.S. as a percentage of the 1991–2020 median recorded by the USDA Natural Resources Conservation Service (NRCS). Only stations with at least 20 years of data are included in the station averages.
The SWE percent of normal represents the current SWE at selected SNOTEL stations in or near the basin compared to the median value for those stations on the same date from 1991–2020. This map is valid as of February 13, 2023.
For an interactive version of this map, please visit NRCS.
Snow Telemetry (SNOTEL) snow water equivalent (SWE) values for watersheds in Alaska as a percentage of the 1991–2020 median recorded by the USDA Natural Resources Conservation Service (NRCS). Only stations with at least 20 years of data are included in the station averages.
The SWE percent of normal represents the current SWE at selected SNOTEL stations in or near the basin compared to the median value for those stations on the same date. This map is valid as of February 13, 2023.
For an interactive version of this map, please visit NRCS.
SWE Percent of NRCS 1991–2020 Median
SWE Percent of NRCS 1991–2020 Median
Snow Telemetry (SNOTEL) snow water equivalent (SWE) values for watersheds in the western U.S. as a percentage of the 1991–2020 median recorded by the USDA Natural Resources Conservation Service (NRCS). Only stations with at least 20 years of data are included in the station averages.
The SWE percent of normal represents the current SWE at selected SNOTEL stations in or near the basin compared to the median value for those stations on the same date from 1991–2020. This map is valid as of February 13, 2023.
For an interactive version of this map, please visit NRCS.
Snow Telemetry (SNOTEL) snow water equivalent (SWE) values for watersheds in Alaska as a percentage of the 1991–2020 median recorded by the USDA Natural Resources Conservation Service (NRCS). Only stations with at least 20 years of data are included in the station averages.
The SWE percent of normal represents the current SWE at selected SNOTEL stations in or near the basin compared to the median value for those stations on the same date. This map is valid as of February 13, 2023.
For an interactive version of this map, please visit NRCS.
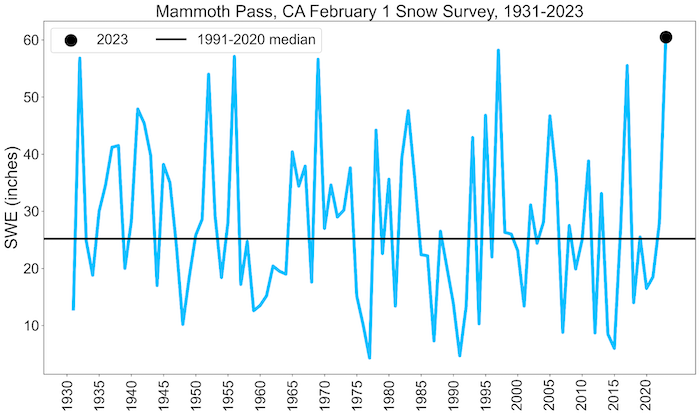
While there has been minor geographic expansion of snow drought over the past month, the big story continues to be the deep snowpack that has accumulated and continues to grow in California, the Great Basin, and the Colorado River Basin. The series of atmospheric rivers that impacted the region from late December through mid-January brought heavy precipitation and yielded increases in snow water equivalent (SWE). Since then, small-to-moderate storms with less moisture have resulted in smaller but continued SWE gains. SWE at many SNOTEL stations in this region is currently above 150% of the mid-February normal, and a considerable proportion of those stations have already exceeded the water year peak median SWE. SWE at a subset of the SNOTEL stations in California, Nevada, Utah, Colorado, Wyoming, and Arizona is at record high or second highest for the date. Furthermore, SWE at many of the long-term snow courses in the central and southern Sierra Nevada, California, that were completed around February 1 showed record high SWE over 60–90 years or more. For example, at Mammoth Pass, California, where records date back to 1929, 60.5 inches of SWE (240% of normal) was measured on February 1, breaking the previous record of 58.2 inches set in February 1997.
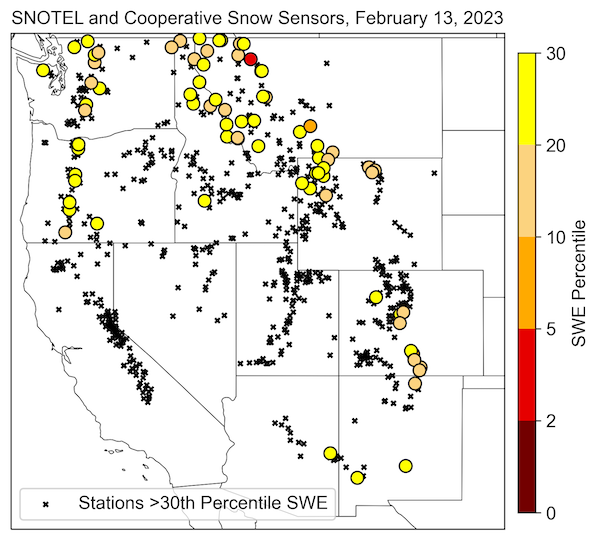
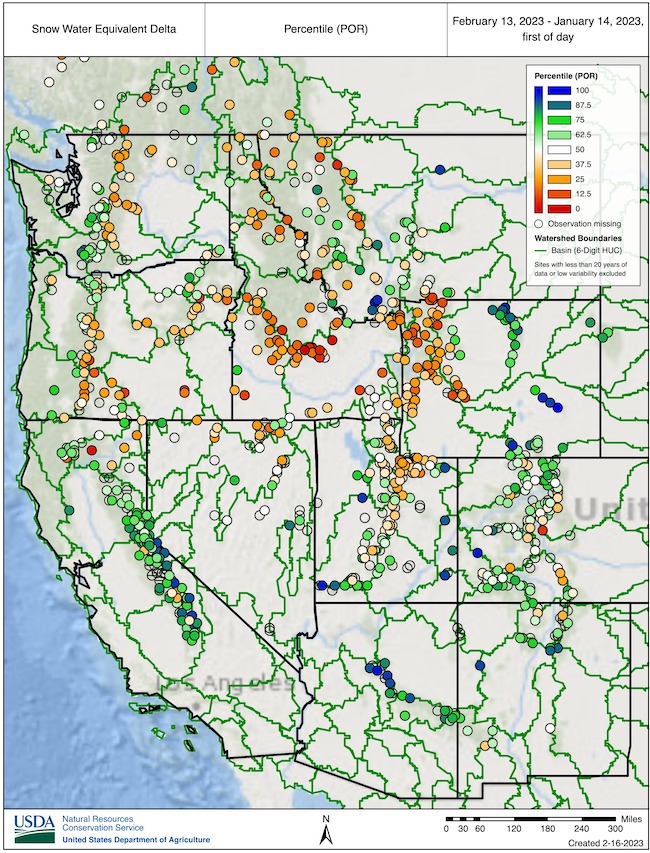
The past month has been dry in the Cascade Range. Precipitation has been below normal, and SWE at many SNOTEL sites is below the 30th percentile for this point of the season. Many higher elevation SNOTEL sites in the Oregon and Washington Cascades are only at 50%–70% median water year peak. Near-normal temperatures at high elevations have preserved the snowpack despite relatively dry conditions. Over the last 30 days, SWE accumulation was below median at several stations in the Cascades and along the Steens Mountains in southeastern Oregon. For instance, Silvies, Summer Rim, and New Crescent Lake were below the tenth percentile in SWE change over the last 30 days, which is climatologically the approximate period of maximum growth in high-elevation snowpack. Lack of snowpack growth in Oregon and Idaho is concerning given relatively low streamflows, water year runoff, and reservoir levels currently, and potential adverse impacts on summer water supply and wildfire risk. Storms passing through the region this week are forecast to increase SWE and somewhat improve snowpack conditions.
Another area of concern is the Sangre de Cristo Mountains in southern Colorado and northern New Mexico, part of the headwaters region for the Rio Grande and Arkansas Rivers. Across this area, SWE at several sites is about 45%–60% of normal for the date. A few other SNOTEL sites in New Mexico are also well below normal, including in the Sacramento Mountains. However, SWE spatial variability is high in these regions, and SWE at some sites is near normal.
SWE at most SNOTEL sites in Alaska is above normal. The exceptions are several sites on the Kenai peninsula at which SWE is 74%–95% of normal. Mt. Alyeska is currently reporting 15.4 inches of SWE, which is 74% of normal and the eighth lowest for the date since records began in 1973. The early February snow survey, with more extensive spatial coverage than SNOTEL, showed another area of below-normal SWE along the south slope of the Alaska Range and the Chulitna River. SWE at snow courses along the south slope of the Brooks Range is about 80%–85% of normal. SWE at several snow course sites in the Copper River Basin is at record high levels.
Stations with SWE Below the 30th Percentile
Snow Water Equivalent Percent of Median Water Year Peak
Change in Snow Water Equivalent from January 14–February 13
SWE at Mammoth Pass, California
* Quantifying snow drought values is an ongoing research effort. Here we have used the 30th percentile as a starting point based on partner expertise and research. Get more information on the current definition of snow drought here.
For More Information, Please Contact:
Daniel McEvoy
Western Regional Climate Center
Daniel.McEvoy@dri.edu
Amanda Sheffield
NOAA/NIDIS California-Nevada Regional Drought Information Coordinator
Amanda.Sheffield@noaa.gov
Britt Parker
NOAA/NIDIS Pacific Northwest Regional Drought Information Coordinator
Britt.Parker@noaa.gov
NIDIS and its partners launched this snow drought effort in 2018 to provide data, maps, and tools for monitoring snow drought and its impacts as well as communicating the status of snow drought across the United States, including Alaska. Thank you to our partners for your continued support of this effort and review of these updates. If you would like to report snow drought impacts, please use the link below. Information collected will be shared with the states affected to help us better understand the short term, long term, and cumulative impacts of snow drought to the citizens and the economy of the regions reliant on snowpack.
Report Your Snow Drought Impacts Data and Maps | Snow Drought Research and Learn | Snow Drought

