The faucet has been shut off across much of the West after a promising wet and snowy start to the season.
Key Points
- Well above-normal snow water equivalent (SWE) at the start of 2022 provided a buffer to mitigate the extreme dry spell over the past month—caused by a persistent ridge of high pressure off the West Coast—and avoid a rapid plunge into a snow drought across most of the region.
- The West as a whole is trending towards snow drought conditions with below-normal SWE at 62% of the SNOTEL sites on February 8 compared to 21% on January 10.
- The forecast includes a continued dry spell and above-normal temperatures. Along with increasing late winter sun angles, these conditions will work against snowpack accumulation.
Snow Telemetry (SNOTEL) snow water equivalent (SWE) values for watersheds in the western U.S. as a percent of the USDA Natural Resources Conservation Service (NRCS) 1991–2020 median. Only stations with at least 20 years of data are included in the station averages.
The SWE percent of normal represents the current SWE at selected SNOTEL stations in or near the basin compared to the average value for those stations on this day. This map is valid as of February 8, 2022.
For an interactive version of this map, please visit NRCS.
Snow Telemetry (SNOTEL) snow water equivalent (SWE) values in watersheds in Alaska as a percent of the USDA Natural Resources Conservation Service (NRCS) 1991–2020 median. Only stations with at least 20 years of data are included in the station averages.
The SWE percent of normal represents the current SWE at selected SNOTEL stations and Snow Course sites in or near the basin compared to the average value for those sites on this day. This map is valid as of February 8, 2022.
For an interactive version of this map, please visit NRCS.
SWE Percent of NRCS 1991-2020 Median
Snow Telemetry (SNOTEL) snow water equivalent (SWE) values for watersheds in the western U.S. as a percent of the USDA Natural Resources Conservation Service (NRCS) 1991–2020 median. Only stations with at least 20 years of data are included in the station averages.
The SWE percent of normal represents the current SWE at selected SNOTEL stations in or near the basin compared to the average value for those stations on this day. This map is valid as of February 8, 2022.
For an interactive version of this map, please visit NRCS.
Snow Telemetry (SNOTEL) snow water equivalent (SWE) values in watersheds in Alaska as a percent of the USDA Natural Resources Conservation Service (NRCS) 1991–2020 median. Only stations with at least 20 years of data are included in the station averages.
The SWE percent of normal represents the current SWE at selected SNOTEL stations and Snow Course sites in or near the basin compared to the average value for those sites on this day. This map is valid as of February 8, 2022.
For an interactive version of this map, please visit NRCS.
Snow Drought Update for February 10, 2022
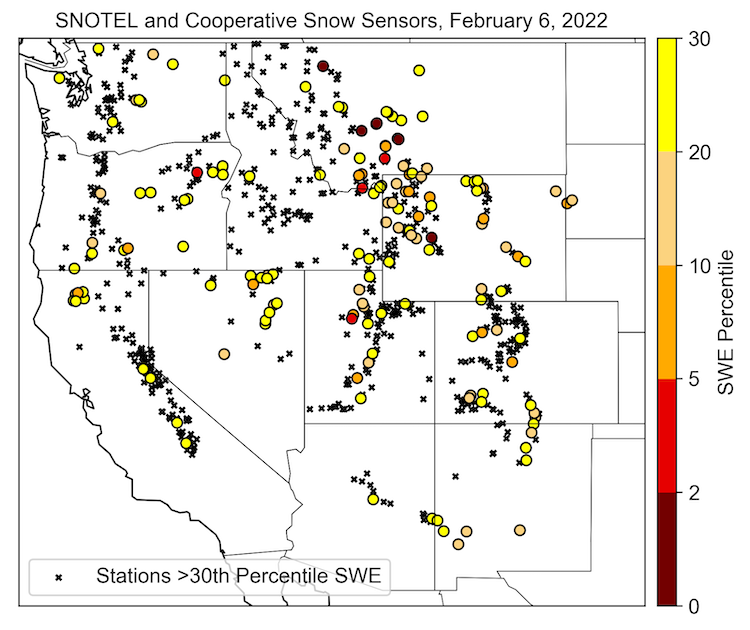
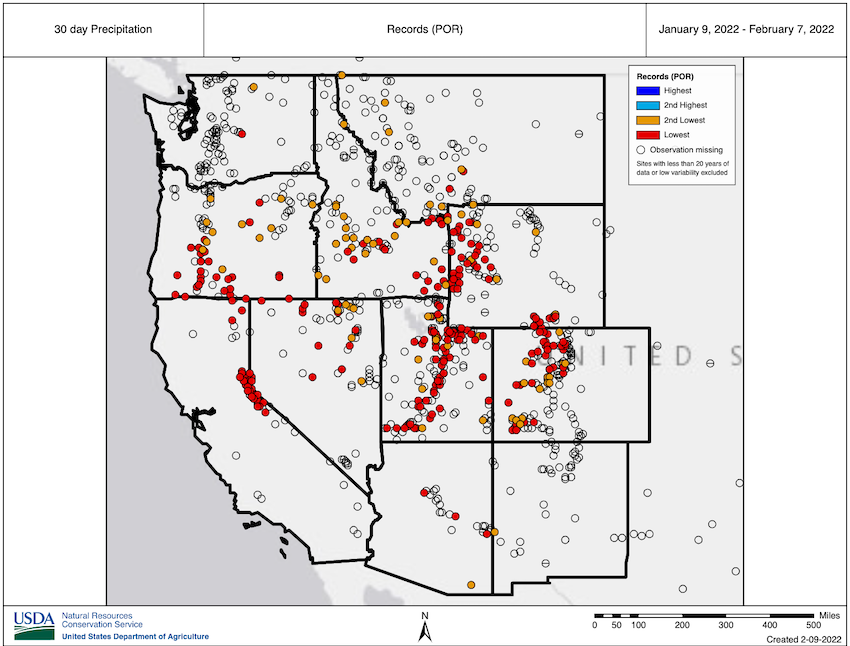
The faucet has been shut off across much of the West over the past month after a promising wet and snowy start to the season. Well above-normal snow water equivalent (SWE) at the start of 2022 provided the buffer needed to mitigate the extreme dry spell over the past month and avoid a rapid plunge into a snow drought across most of the region. A persistent ridge of high pressure has been parked off the West Coast since early January, leading to record-low precipitation totals at SNOTEL sites over the past 30 days in every western state except for New Mexico. Zero precipitation was observed over the past 30 days at many SNOTEL sites in northwest California, the Sierra Nevada, and the Great Basin. Remarkably, some of the sites at which zero snow fell in the past month still have slightly above-normal SWE thanks to major storms during the last two weeks of December and beginning of January. Still, the West as a whole is trending toward snow drought conditions, with below-normal SWE at 62% of the SNOTEL sites on February 8 compared to 21% on January 10
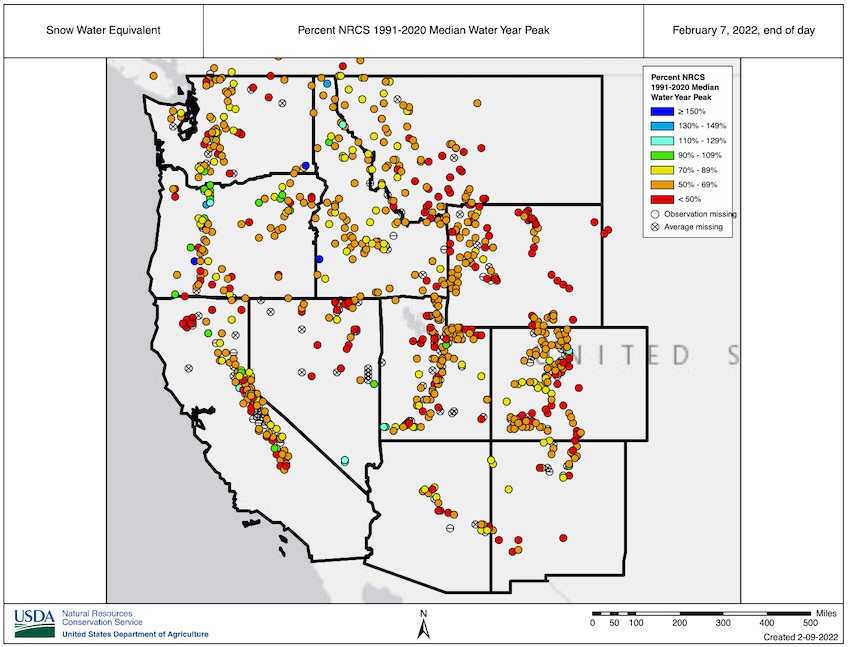
As we progress through the snow season, attention turns to spring runoff and summer water supply. Peak SWE is one of the metrics used to assess potential water supply outcomes. The timing of median peak SWE varies across the West, but generally occurs from late March through early April, with higher-elevation sites in the Rockies peaking the latest. With over a month left in the heart of the snow season, many areas have already exceeded 70% of median peak SWE thanks to the wet period in early winter. In the Cascade Range of northern Oregon, several SNOTEL sites, mostly at lower elevations, have already exceeded the median peak SWE, which is encouraging. Areas in which values of less than 50% of median peak SWE are widespread include northwest California, northeast Nevada, Utah, northwest Wyoming, and southwest Montana. Forecasts indicate that below-normal precipitation and snowfall is likely to continue during the next 1–2 weeks over most of the West. The continued dry spell, above-normal temperatures, and increasing late winter sun angles all will be working against snowpack accumulation, and the spatial extent of snow drought is likely to continue to increase.
Snowpack across most of Alaska (where there are observations) continues to be above normal, with a few exceptions. A cluster of four SNOTEL stations in the Kenai Mountains north of Seward have slightly below normal SWE (82%–96% of normal). SWE is also below normal in the Chugach Mountains near Thompson Pass as indicated by the Upper Tsaina River SNOTEL and several early February snow course readings in the area. Record high (40–60 year period of record in some cases) early February SWE was measured throughout the Central Interior and in the upper Susitna Basin near Lake Louise.
Stations with SWE Below the 30th Percentile
30-Day Precipitation Records: January 9–February 7
Percent of Median Water Year Peak Snow Water Equivalent
* Quantifying snow drought values is an ongoing research effort. Here we have used the 30th percentile as a starting point based on partner expertise. Get more information on the current definition of snow drought here.
For More Information, Please Contact:
Daniel McEvoy
Western Regional Climate Center
Daniel.McEvoy@dri.edu
Amanda Sheffield
NOAA/NIDIS California-Nevada Regional Drought Information Coordinator
Amanda.Sheffield@noaa.gov
Britt Parker
NOAA/NIDIS Pacific Northwest and Missouri River Basin Regional Drought Information Coordinator
Britt.Parker@noaa.gov
NIDIS and its partners launched this snow drought effort in 2018 to provide data, maps, and tools for monitoring snow drought and its impacts as well as communicating the status of snow drought across the United States, including Alaska. Thank you to our partners for your continued support of this effort and review of these updates. If you would like to report snow drought impacts, please use the link below. Information collected will be shared with the states affected to help us better understand the short term, long term, and cumulative impacts of snow drought to the citizens and the economy of the regions reliant on snowpack.
Report Your Snow Drought Impacts Data and Maps | Snow Drought Research and Learn | Snow Drought

