Drought expected to expand and intensify in the Ohio River and Lower Mississippi River basins.
Key Points
- Extremely dry conditions across the Ohio River Basin and southern portions of the Midwest since early August have led to the rapid expansion of drought and decreased flows on the Ohio River and portions of the Lower Mississippi River.
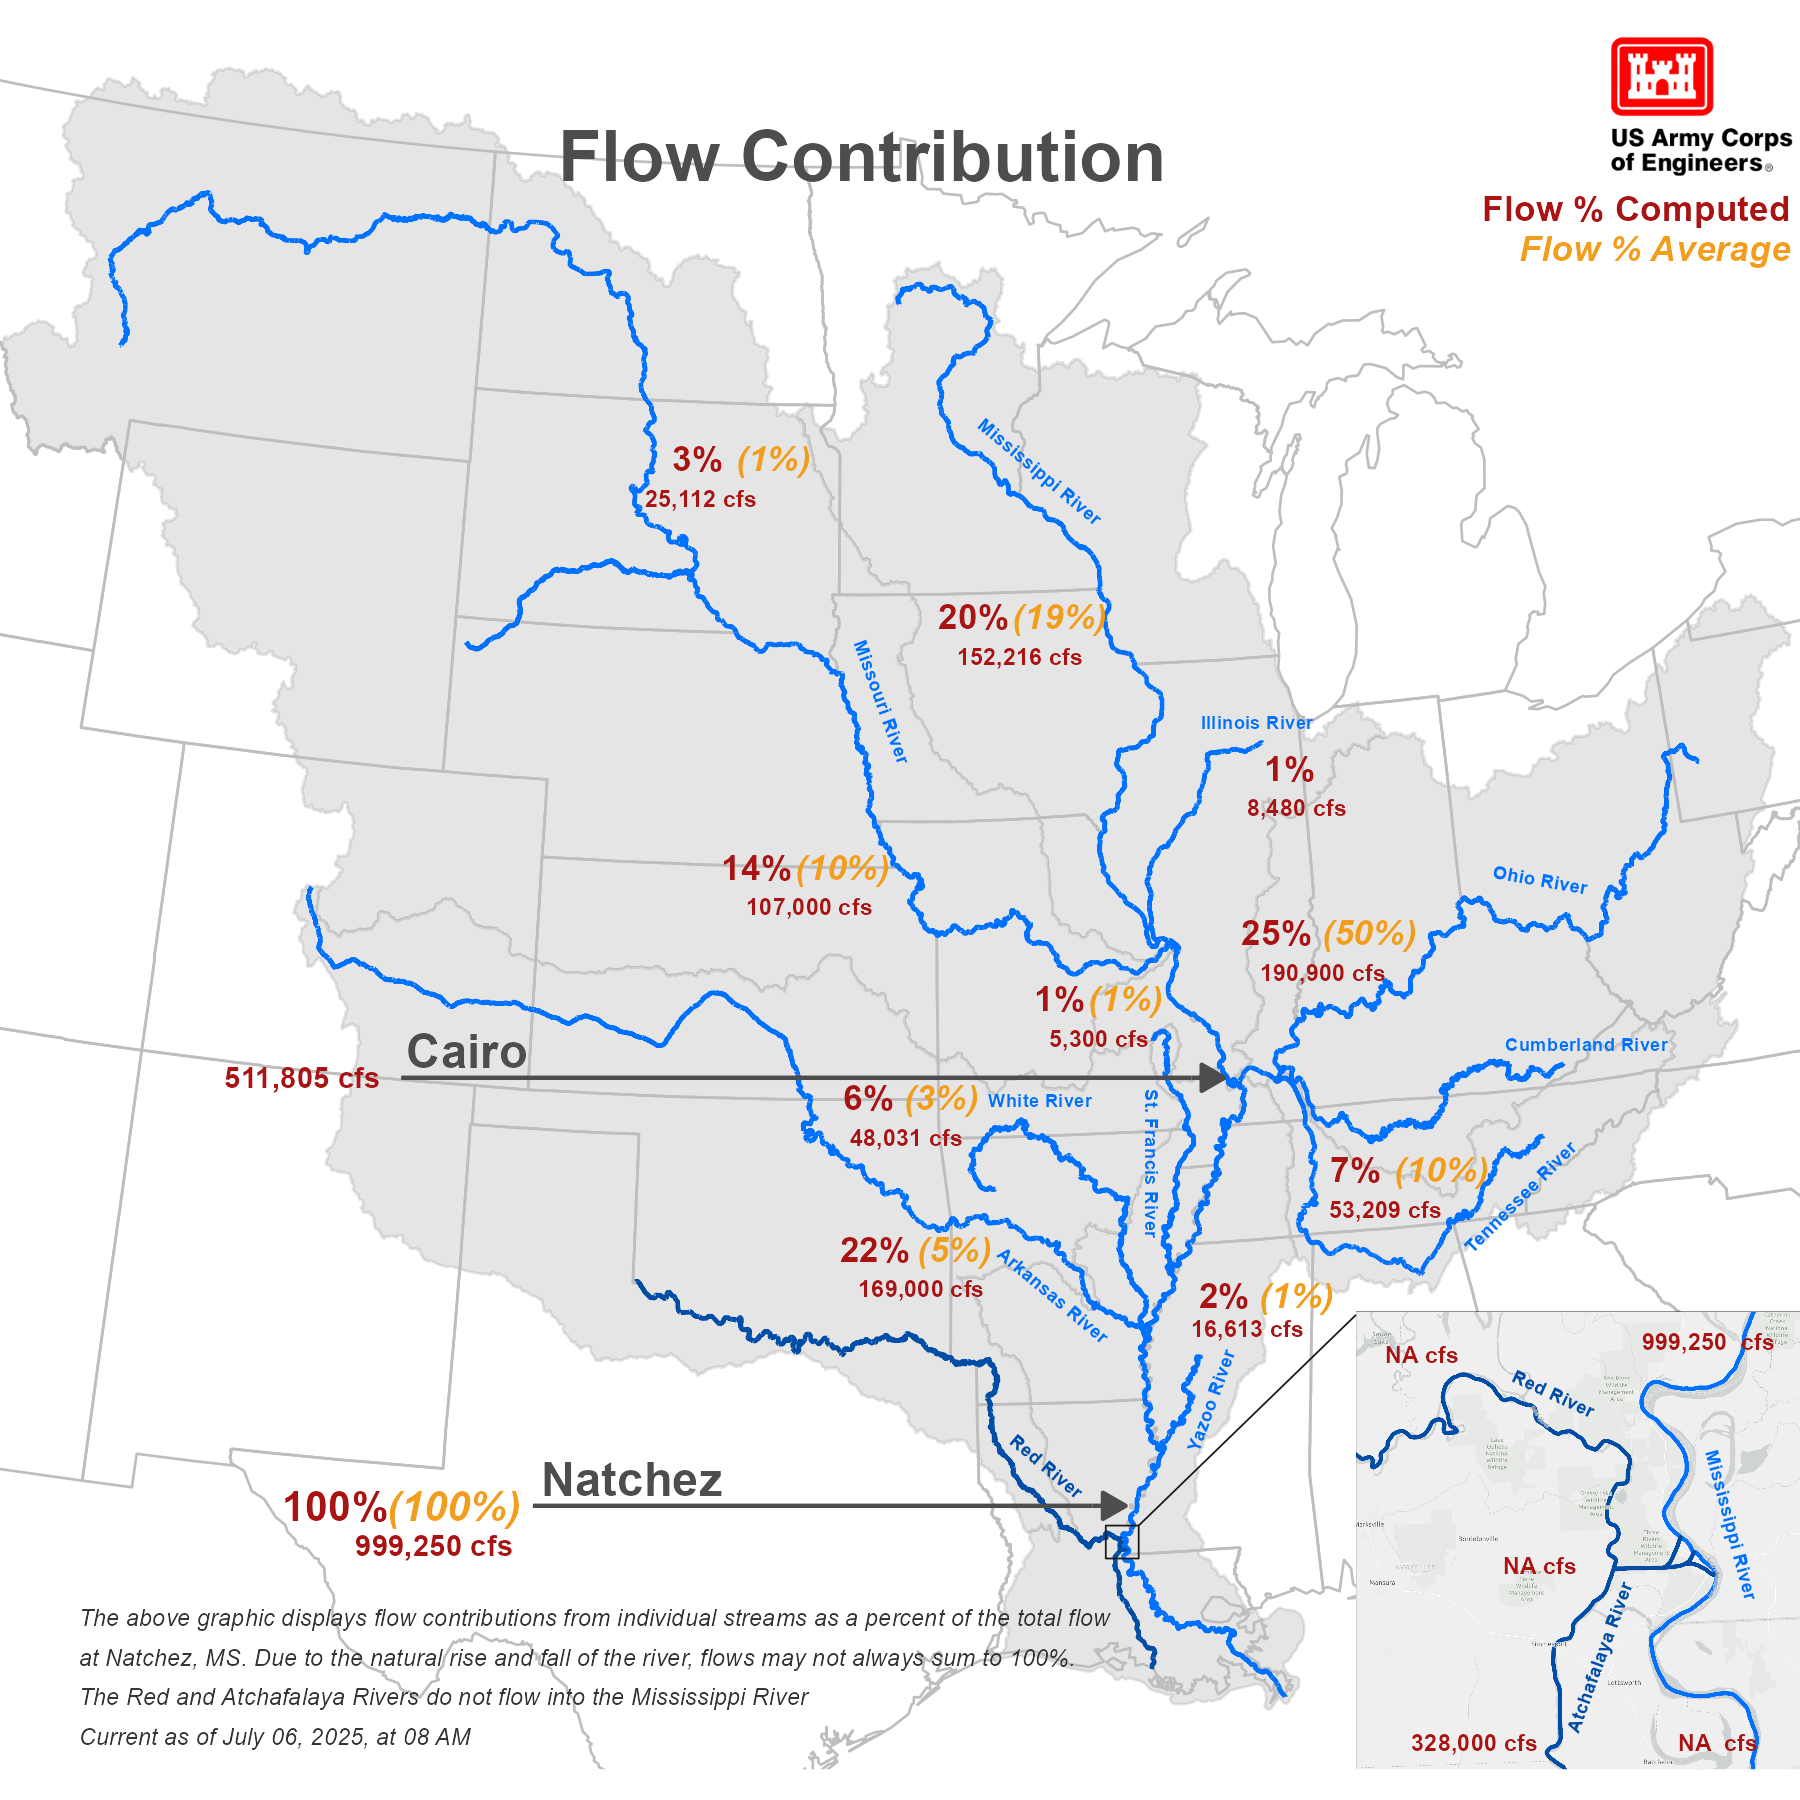
- As of September 18, the Ohio River is contributing only 8% of the overall water flow in the Lower Mississippi River, compared to its typical 50% contribution.
- The Ohio River at Cairo, Illinois (where the Ohio meets the Mississippi River) has dropped below 10 feet. It is forecasted to remain below 10 feet for at least the next 28 days without widespread precipitation relief in the forecast. The Mississippi River at Memphis, Tennessee is also forecasted to reach low water thresholds within the next 28 days, dropping below -8.0 feet by the end of the month and to -9.7 feet by mid-October.
- While lower water levels are typical this time of year, this is the fourth year in a row that river levels have reached low water thresholds on portions of the lower Ohio and Mississippi Rivers, driven primarily by drought and reduced flow contributions in the Ohio River Basin.
- The expected continuation of low water conditions triggered some navigation restrictions on the Mississippi River. South of Cairo, Illinois, the U.S. Coast Guard issued tow width and weight restrictions to avoid grounding issues.
- Above-normal temperatures have returned to the entire Basin and are forecast to remain through the end of September, which could intensify drought and low water concerns. The potential for significant fire conditions is at moderate risk over the next 7 days due to hot and dry conditions across much of the southeastern U.S.
- Large parts of the Mississippi River Basin are moving into a drier time of year. Without significant and widespread rainfall, drought is expected to persist and expand across a significant portion of the Mississippi River Basin by December 31, 2025.
- River flows in the Lower Mississippi Basin are currently within the normal range. However, persistent drought in the Ohio River Basin and adjacent areas will likely lead to further declines in flow from the Ohio River, potentially causing low water issues on the Lower Mississippi River.
Access the NEW Mississippi River Basin Drought and Water Dashboard:
This update is based on data available as of Thursday, September 18, 2025 at 9:00 a.m. CT. We acknowledge conditions are evolving.
Precipitation
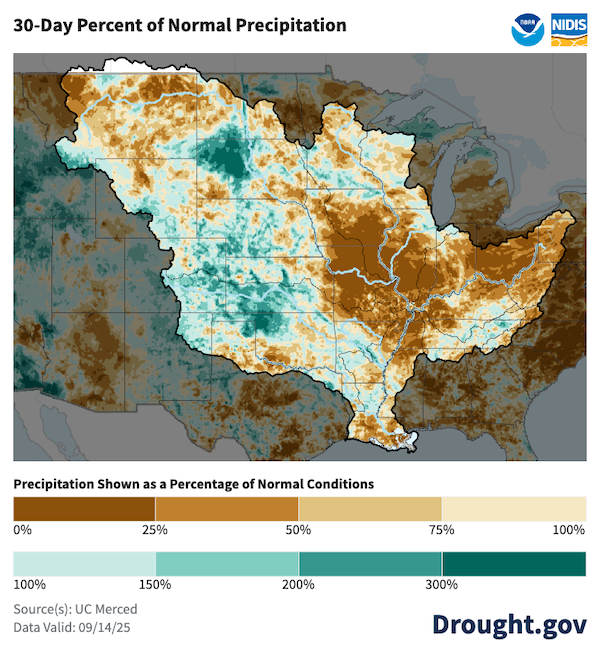
A significant portion of the Ohio River Basin and Lower Midwest states received only 0-25% of normal precipitation over the last 30 days. These extremely dry conditions have led to the expansion of drought and decreased flows from rivers across the Basin.
This map shows precipitation over the past 30 days as a percentage of the historical average (1991–2020) for the same time period. Green/blue shades indicate above-normal precipitation, while brown shades indicate below-normal precipitation.
U.S. Drought Monitor (USDM) Conditions
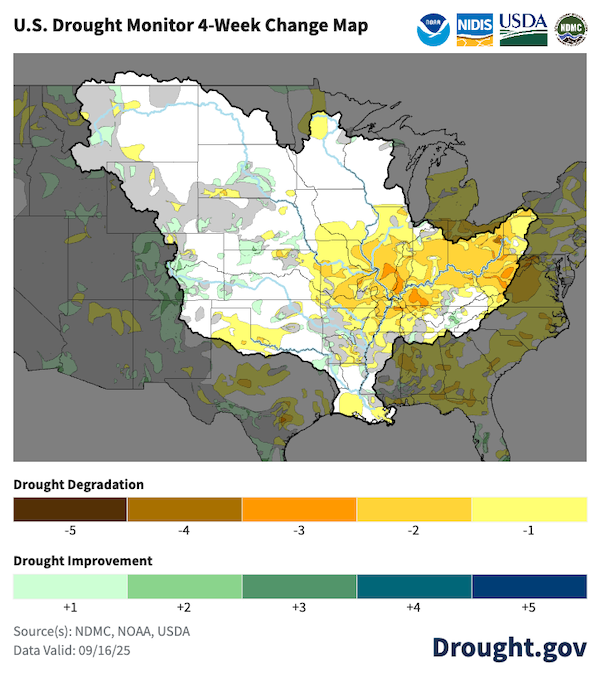
Portions of Arkansas, Illinois, Indiana, Kentucky, Missouri, Ohio, Tennessee, West Virginia, and Pennsylvania saw drought conditions worsen by two to three categories, with a small area in eastern Ohio worsening by four, on the U.S. Drought Monitor over the past four weeks.
The U.S. Drought Monitor is updated each Thursday to show the location and intensity of drought across the country. This map shows the change of drought coverage and severity classes over the past four weeks.
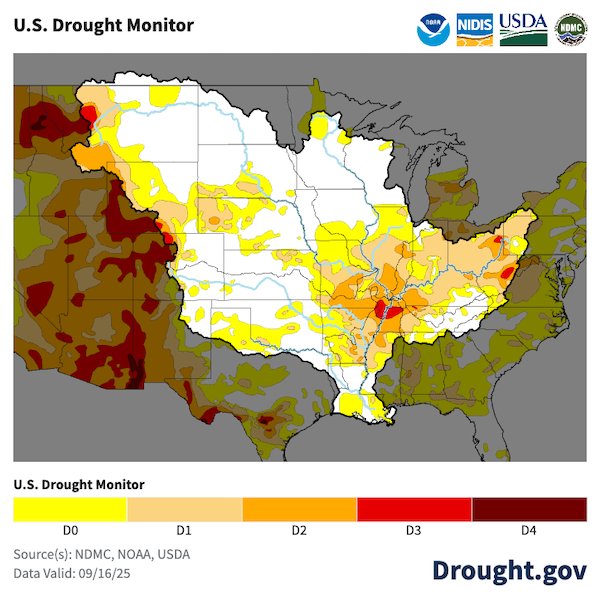
Drought has been developing and expanding in the Ohio River Basin and parts of the Tennessee, Arkansas-White-Red, and Lower Mississippi River Basins over the past 30 days.
According to the U.S. Drought Monitor, Severe to Extreme Drought (D2-D3) is now present in parts of Pennsylvania, West Virginia, Ohio, Kentucky, Illinois, Indiana, Missouri, Arkansas, Tennessee, and Mississippi.
The Extreme Drought (D3) that developed in Ohio this week is only the third time Ohio has had D3 in the last 25 years, but the second time in the last two years.
| River Basin | USDM Percent Land Area in Drought | Drought Severity |
|---|---|---|
| Ohio | 72% | Moderate to Extreme Drought [D1-D3] |
| Lower Mississippi | 44% | Moderate to Extreme Drought [D1-D3] |
| Missouri | 20% | Moderate to Extreme Drought [D1-D3] |
| Tennessee | 19% | Moderate to Extreme Drought [D1-D3] |
| Upper Mississippi | 18% | Moderate to Severe Drought [D1-D2] |
| Arkansas-White-Red | 11% | Moderate to Extreme Drought [D1-D3] |
The U.S. Drought Monitor depicts the location and intensity of drought across the country using 5 classifications: Abnormally Dry (D0), showing areas that may be going into or are coming out of drought, and four levels of drought (D1–D4).
Hydrologic Conditions
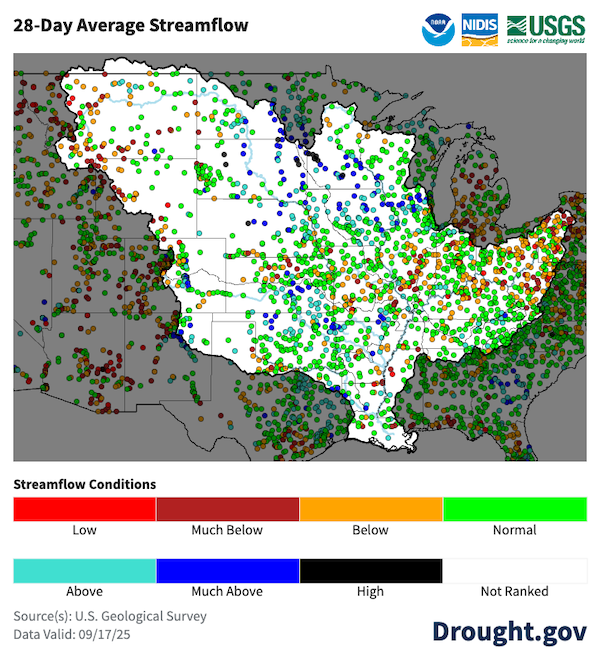
The below-normal precipitation totals over the last 30 days in the Ohio River Basin and Lower Midwest states have caused multiple stream gauges to fall into below-normal conditions.
The map above depicts 28-day average streamflow conditions as computed at U.S. Geological Survey (USGS) stream gauges. The colors represent 28-day average streamflow compared to percentiles of historical 28-day average streamflow for the day of the year.
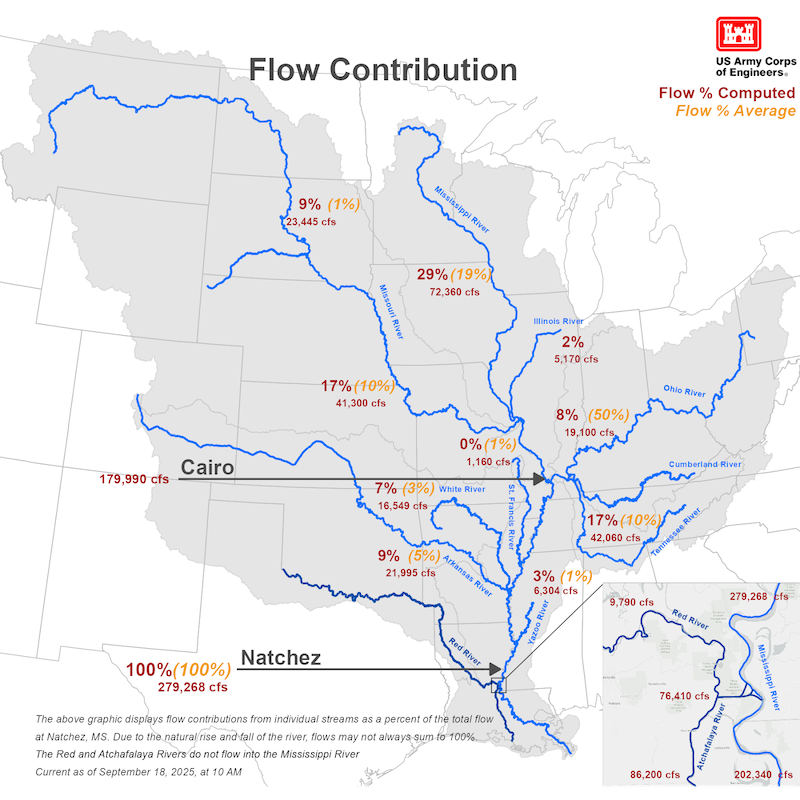
The Ohio River is currently contributing only 8% of the overall flow of the Lower Mississippi River Basin, as compared to its typical 50% contribution. Meanwhile, the Upper Mississippi and Missouri Rivers are contributing around 57% of the flow to the Lower Mississippi River compared to the typical 30%.
Sub-basins within the broader Mississippi Basin contribute different flow amounts to the normal water levels that are recorded at Natchez, Louisiana in the Lower Mississippi River Basin. In the image above, normal flow contribution is provided in orange, while the current flow contribution is provided in red.
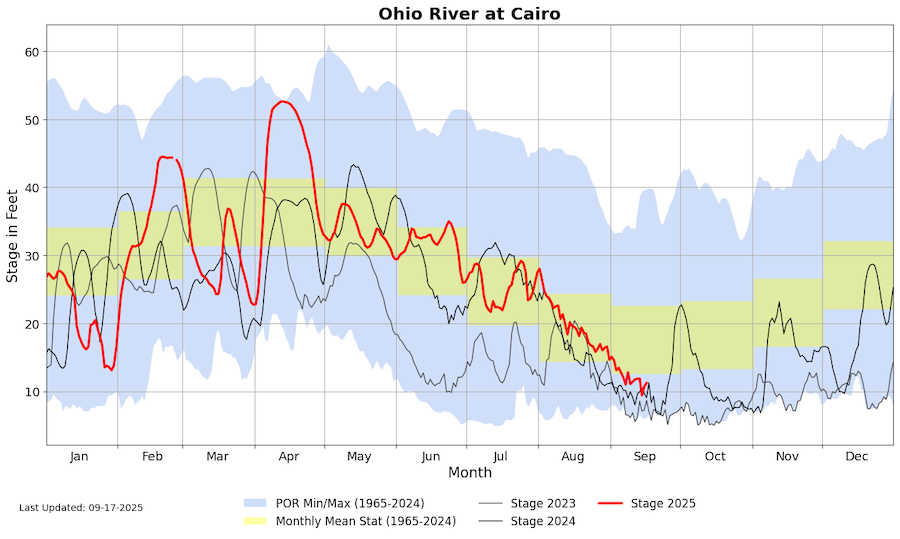
The current river stages at Cairo, Illinois (red) have been below the monthly mean for much of September. The current water levels at this location remain higher than they were at this time in 2022 and 2023. Since the Ohio River is a major contributor to flow on the Lower Mississippi River, decreased flows from the Ohio Basin often lead to low water conditions on the Lower Mississippi.
The U.S. Army Corps of Engineers creates these hydrographs at specific locations along the Mississippi River to monitor current flow values compared to historical values. The blue and green sections provide the maximum and minimum historical flows and the monthly mean flows, respectively. The grey line shows the daily flow values in 2023, the black line shows the daily flow values in 2024, and the red line shows daily flow values for 2025.
Looking Ahead
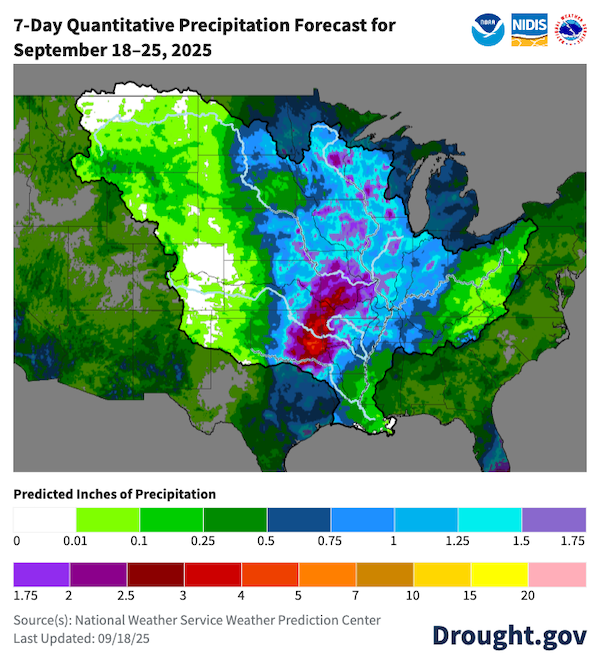
Much of the Mississippi River Basin is expected to see an inch or more precipitation in the next seven days. However, much of the Ohio River Basin will continue to see less than an inch of precipitation.
This map shows the amount of liquid precipitation (in inches) expected to fall over the next 7 days (September 18-25), according to the National Weather Service.
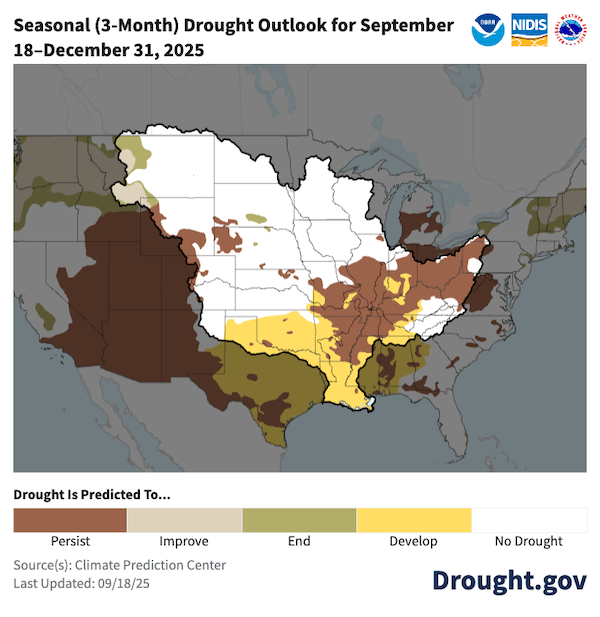
A widespread area of the Mississippi River Basin is expected to have drought persist (brown) or develop (yellow) by December 31, 2025.
The Climate Prediction Center issues a Seasonal Drought Outlook, which predicts whether drought will develop, remain, improve, or be removed over the next three months.
Follow Drought, Water and Climate Conditions
Basin Conditions
For drought and water information on the Mississippi River Basin, visit the Mississippi River Basin Drought and Water Dashboard. This NEW interagency resource provides a suite of curated and customized drought information, tools, and data to support communications and decision-making across the greater Mississippi River Basin (covering 40% of the contiguous U.S. and 31 states).
The Dashboard features:
- Timely drought and river conditions, with interactive maps automatically updated with the latest information, including current and forecast river conditions, drought conditions, outlooks, and interactive, historical drought data for the basin.
- Conditions for the entire Mississippi River Basin or a sub-basin—including the Upper Mississippi, Lower Mississippi, Missouri, Ohio, Tennessee, and Arkansas-White-Red River Basins.
- Customized and downloadable high-quality map images for easy sharing in newsletters, situational briefings, presentations, and more.
- Plain language educational content on drought and low water on the Lower Mississippi River, providing context for current and forecast conditions.
Learn more and explore the Dashboard on Drought.gov.
State, County, and Local Drought Conditions
Drill down to state, county, and/or local levels from the Location pages on the U.S. Drought Portal. Explore drought data and maps, historical information, outlooks, and more at various levels.
Sign Up for NIDIS Emails
Contributors
Molly Woloszyn, Adam Lang, and Kelsey Eigsti
Cooperative Institute for Research in Environmental Sciences (CIRES)/NOAA/NIDIS
Elliot Wickham
Cooperative Institute for Research in Operational Hydrology (CIROH)/NOAA/NIDIS
Meredith Muth
NOAA National Integrated Drought Information System (NIDIS)
Anna Wolverton
U.S. Army Corps of Engineers Mississippi Valley Division/NOAA National Weather Service (NWS)
David Welch and Matthew Wilson
NOAA NWS Lower Mississippi River Forecast Center
Jim Noel
NOAA NWS Ohio River Forecast Center
Brad Pugh
NOAA Climate Prediction Center

