Water Year 2026 Recap: Near-Normal Precipitation and a Warm Water Year Caused Mixed Drought Conditions
Key Points
- Near-normal precipitation across the region: When looking over Water Year 2026 as a whole, much of California and Nevada received near-normal precipitation. However, the wet months came early, and the year was divided into a wet start (October-December) and a dry end (January-March).
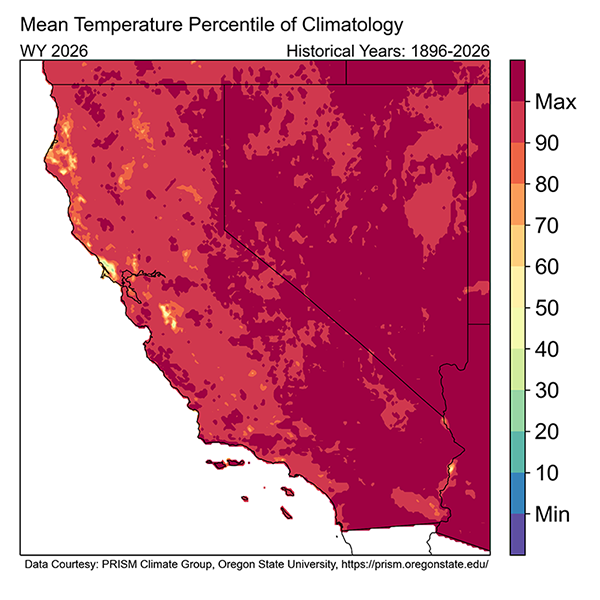
- Record warm conditions: Compared to all historical water years since 1896, temperatures were among the top 10% warmest across the region. Warm winter temperatures caused low snowpack and record-setting March temperatures caused a very early snowmelt.
- Drought degraded in northern California-Nevada: Drought worsened in northern Nevada this water year with Extreme (D3) and Exceptional (D4) Drought emerging, while central and southern California drought conditions improved.
- Tropical Storm Rachel: More recently, San Diego County received 9% and Clark County over 4% of normal total water year total precipitation from remnants of Tropical Storm Rachel.
- Potential impacts of El Niño: El Niño continues to strengthen and tilts the odds toward more precipitation, potentially improving drought across California-Nevada. How beneficial this precipitation is—such as for building snowpack and replenishing groundwater—will depend on temperatures, storm timing, and storm intensity.
This update is based on data available as of Friday, October 16, 2026 at 7:00 a.m. PT. We acknowledge that conditions are evolving.
The U.S. Drought Monitor depicts the location and intensity of drought across the country. The map uses 5 classifications: Abnormally Dry (D0), showing areas that may be going into or are coming out of drought, and four levels of drought (D1–D4).
The U.S. Drought Monitor is a joint effort of the National Oceanic and Atmospheric Administration, U.S. Department of Agriculture, National Aeronautics and Space Administration, and National Drought Mitigation Center.
The U.S. Drought Monitor Water Year 2026 change map shows where drought has improved, remained the same, or worsened over the last water year (October 1, 2025–September 30, 2026).
The U.S. Drought Monitor depicts the location and intensity of drought across the country, using 5 classifications (D0–D4). On this change map, green hues show where conditions improved, yellow/orange hues show where conditions worsened, and gray areas show where drought remained the same.
A drought index combines multiple drought indicators (e.g., precipitation, temperature, soil moisture) to depict drought conditions. For some products, like the U.S. Drought Monitor, authors combine their analysis of drought indicators with input from local observers. Other drought indices, like the Standardized Precipitation Index (SPI), use an objective calculation to describe the severity, location, timing, and/or duration of drought.
Learn MorePeriods of drought can lead to inadequate water supply, threatening the health, safety, and welfare of communities. Streamflow, groundwater, reservoir, and snowpack data are key to monitoring and forecasting water supply.
Learn MoreDrought can reduce the water availability and water quality necessary for productive farms, ranches, and grazing lands, resulting in significant negative direct and indirect economic impacts to the agricultural sector. Monitoring agricultural drought typically focuses on examining levels of precipitation, evaporative demand, soil moisture, and surface/groundwater quantity and quality.
Learn MoreA drought index combines multiple drought indicators (e.g., precipitation, temperature, soil moisture) to depict drought conditions. For some products, like the U.S. Drought Monitor, authors combine their analysis of drought indicators with input from local observers. Other drought indices, like the Standardized Precipitation Index (SPI), use an objective calculation to describe the severity, location, timing, and/or duration of drought.
Learn MorePeriods of drought can lead to inadequate water supply, threatening the health, safety, and welfare of communities. Streamflow, groundwater, reservoir, and snowpack data are key to monitoring and forecasting water supply.
Learn MoreDrought can reduce the water availability and water quality necessary for productive farms, ranches, and grazing lands, resulting in significant negative direct and indirect economic impacts to the agricultural sector. Monitoring agricultural drought typically focuses on examining levels of precipitation, evaporative demand, soil moisture, and surface/groundwater quantity and quality.
Learn MoreDrought & Dryness Categories
% AreaD0 – Abnormally Dry
Abnormally Dry (D0) indicates a region that is going into or coming out of drought.
D1 – Moderate Drought
Moderate Drought (D1) is the first of four drought categories (D1–D4), according to the U.S. Drought Monitor.
D2 – Severe Drought
Severe Drought (D2) is the second of four drought categories (D1–D4), according to the U.S. Drought Monitor.
D3 – Extreme Drought
Extreme Drought (D3) is the third of four drought categories (D1–D4), according to the U.S. Drought Monitor.
D4 – Exceptional Drought
Exceptional Drought (D4) is the most intense drought category, according to the U.S. Drought Monitor.
Total Area in Drought (D1–D4)
Percent area of the California–Nevada region that is currently in drought (D1–D4), according to the U.S. Drought Monitor.
Drought Degradation
5-Category Degradation
Drought/dryness has worsened by 5 categories, according to the U.S. Drought Monitor.
4-Category Degradation
Drought/dryness has worsened by 4 categories, according to the U.S. Drought Monitor.
3-Category Degradation
Drought/dryness has worsened by 3 categories, according to the U.S. Drought Monitor.
2-Category Degradation
Drought/dryness has worsened by 2 categories, according to the U.S. Drought Monitor.
1-Category Degradation
Drought/dryness has worsened by 1 category, according to the U.S. Drought Monitor.
Drought Improvement
1-Category Improvement
Drought/dryness has improved by 1 category, according to the U.S. Drought Monitor.
2-Category Improvement
Drought/dryness has improved by 2 categories, according to the U.S. Drought Monitor.
3-Category Improvement
Drought/dryness has improved by 3 categories, according to the U.S. Drought Monitor.
4-Category Improvement
Drought/dryness has improved by 4 categories, according to the U.S. Drought Monitor.
5-Category Improvement
Drought/dryness has improved by 5 categories, according to the U.S. Drought Monitor.
The U.S. Drought Monitor depicts the location and intensity of drought across the country. The map uses 5 classifications: Abnormally Dry (D0), showing areas that may be going into or are coming out of drought, and four levels of drought (D1–D4).
The U.S. Drought Monitor is a joint effort of the National Oceanic and Atmospheric Administration, U.S. Department of Agriculture, National Aeronautics and Space Administration, and National Drought Mitigation Center.
The U.S. Drought Monitor Water Year 2026 change map shows where drought has improved, remained the same, or worsened over the last water year (October 1, 2025–September 30, 2026).
The U.S. Drought Monitor depicts the location and intensity of drought across the country, using 5 classifications (D0–D4). On this change map, green hues show where conditions improved, yellow/orange hues show where conditions worsened, and gray areas show where drought remained the same.
This U.S. Drought Monitor is released every Thursday morning, with data valid through Tuesday at 7 a.m. ET.
U.S. Drought Monitor change maps are released every Thursday morning, with data valid through Tuesday at 7 a.m. ET.
A drought index combines multiple drought indicators (e.g., precipitation, temperature, soil moisture) to depict drought conditions. For some products, like the U.S. Drought Monitor, authors combine their analysis of drought indicators with input from local observers. Other drought indices, like the Standardized Precipitation Index (SPI), use an objective calculation to describe the severity, location, timing, and/or duration of drought.
Learn MorePeriods of drought can lead to inadequate water supply, threatening the health, safety, and welfare of communities. Streamflow, groundwater, reservoir, and snowpack data are key to monitoring and forecasting water supply.
Learn MoreDrought can reduce the water availability and water quality necessary for productive farms, ranches, and grazing lands, resulting in significant negative direct and indirect economic impacts to the agricultural sector. Monitoring agricultural drought typically focuses on examining levels of precipitation, evaporative demand, soil moisture, and surface/groundwater quantity and quality.
Learn MoreA drought index combines multiple drought indicators (e.g., precipitation, temperature, soil moisture) to depict drought conditions. For some products, like the U.S. Drought Monitor, authors combine their analysis of drought indicators with input from local observers. Other drought indices, like the Standardized Precipitation Index (SPI), use an objective calculation to describe the severity, location, timing, and/or duration of drought.
Learn MorePeriods of drought can lead to inadequate water supply, threatening the health, safety, and welfare of communities. Streamflow, groundwater, reservoir, and snowpack data are key to monitoring and forecasting water supply.
Learn MoreDrought can reduce the water availability and water quality necessary for productive farms, ranches, and grazing lands, resulting in significant negative direct and indirect economic impacts to the agricultural sector. Monitoring agricultural drought typically focuses on examining levels of precipitation, evaporative demand, soil moisture, and surface/groundwater quantity and quality.
Learn MoreRecent Drought Conditions and Impacts: Looking Back at Water Year 2026
- Near normal precipitation: Much of California and Nevada received 70%-130% of normal precipitation in Water Year 2026 (October 1, 2025–September 30, 2026).
- Atmospheric rivers divided the wet season: More atmospheric rivers made landfall along the California coast between October and December than later in the season, dividing the wet months into a wet start (October-December) and a dry end (January- March).
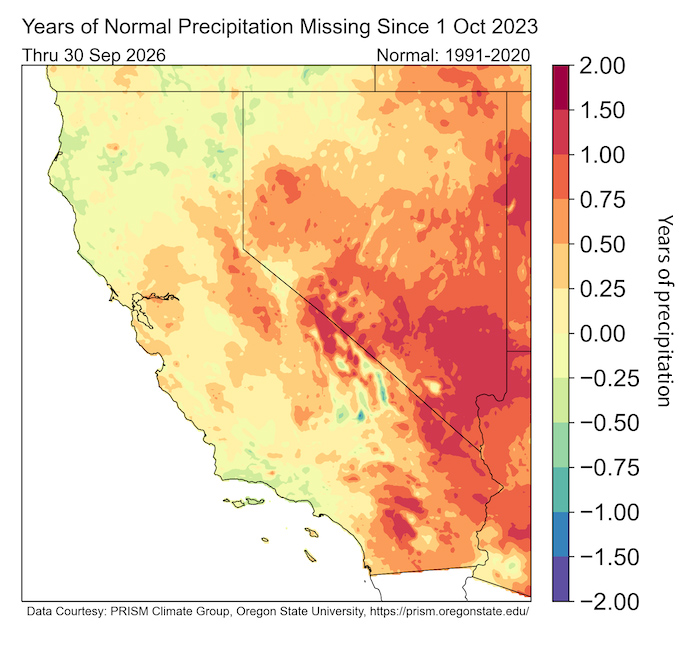
- Precipitation deficits remain: Much of Nevada, interior southern California, and the central Sierra Nevada are missing at least 50% of a normal water year’s worth of precipitation since the start of Water Year 2024 (October 1, 2023). The largest deficits exceed a full water year’s worth of precipitation, particularly over southeastern Nevada.
- Warm water year: Compared to all historical water years since 1896, Water Year 2026 was among the top 10% warmest in nearly the entire region. Temperatures were above normal (3–5°F) across interior California and Nevada, and slightly above normal (1–3°F) over the rest of California. Much of Nevada and interior central and southern California experienced its warmest water year on record.
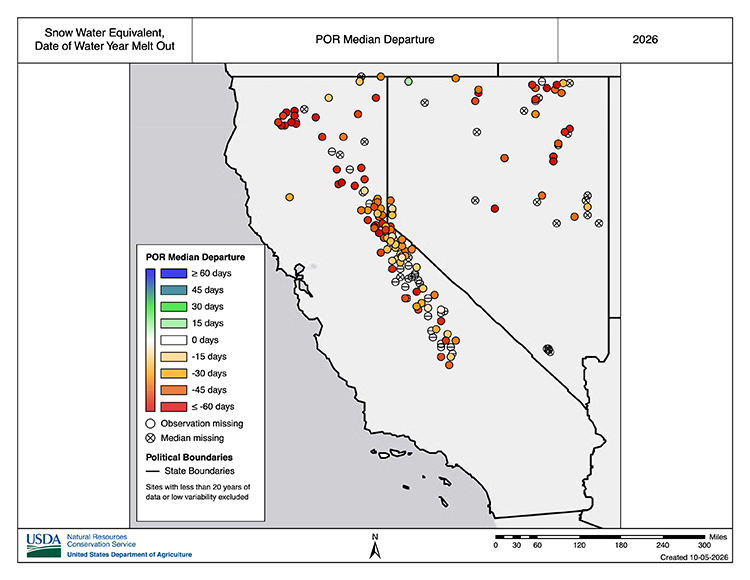
- Record low snowpack and early snowmelt: Record-breaking warmth in March resulted in rapid melting of an already anomalously low snowpack. Both states were at or near record low snowpack for the beginning of April. Most SNOTEL and snow survey stations saw their snow water equivalent fall to zero 30-60 days before their historical median melt out date.
- Fire season was elevated in Nevada: In Nevada 9% more acres burned compared to all of 2025. Drier conditions in western Nevada mean live fuel moisture levels across are still 60–90% at most stations, which correlates with extreme fire behavior. The 2026 fire season thus far is below recent averages in California.
- Reservoirs near or average: Major California water supply reservoirs remain near or above their historical averages. Most reservoirs in Nevada have storage comparable to 2025 levels, except for the Lower Humboldt, Owhyee, and Snake, which are lower.
- Drought persists in the Colorado River basin: Hotter than normal conditions, low snowpack, record-breaking summer heat and an uneven monsoon has resulted in widespread drought across the Intermountain West. This has implications for water resources in California-Nevada as Lake Powell and Lake Mead remain near historic lows.
Precipitation Deficits Remain from the Past 3 Water Years
Water Year 2026 Among the Top 10% Warmest in Nearly the Entire Region
Water Year 2026 Snow Melts Out 30-60 Days Early
Looking Forward to Water Year 2027: Forecasts and Potential Impacts
- El Niño & Potential Impacts:
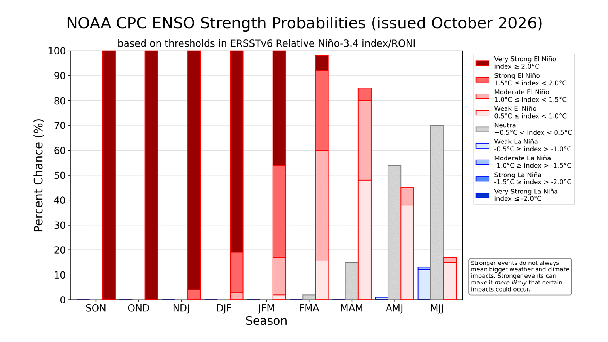
- NOAA’s National Weather Service (NWS) official outlook shows El Niño continuing to strengthen, with a strong-to-very strong El Niño likely through January-March 2027 (remaining greater than an 83% chance).
- Stronger El Niño events shift the odds toward more precipitation for the southern portion of the region, including more extreme precipitation. Local weather depends on how individual storms line up, so winter outlooks are about changing odds—not guarantees. In recent NIDIS webinars, both California State Climatologist Mike Anderson and the NWS echoed that caution that the powerful ocean does guarantee specific strom track of drought relief.
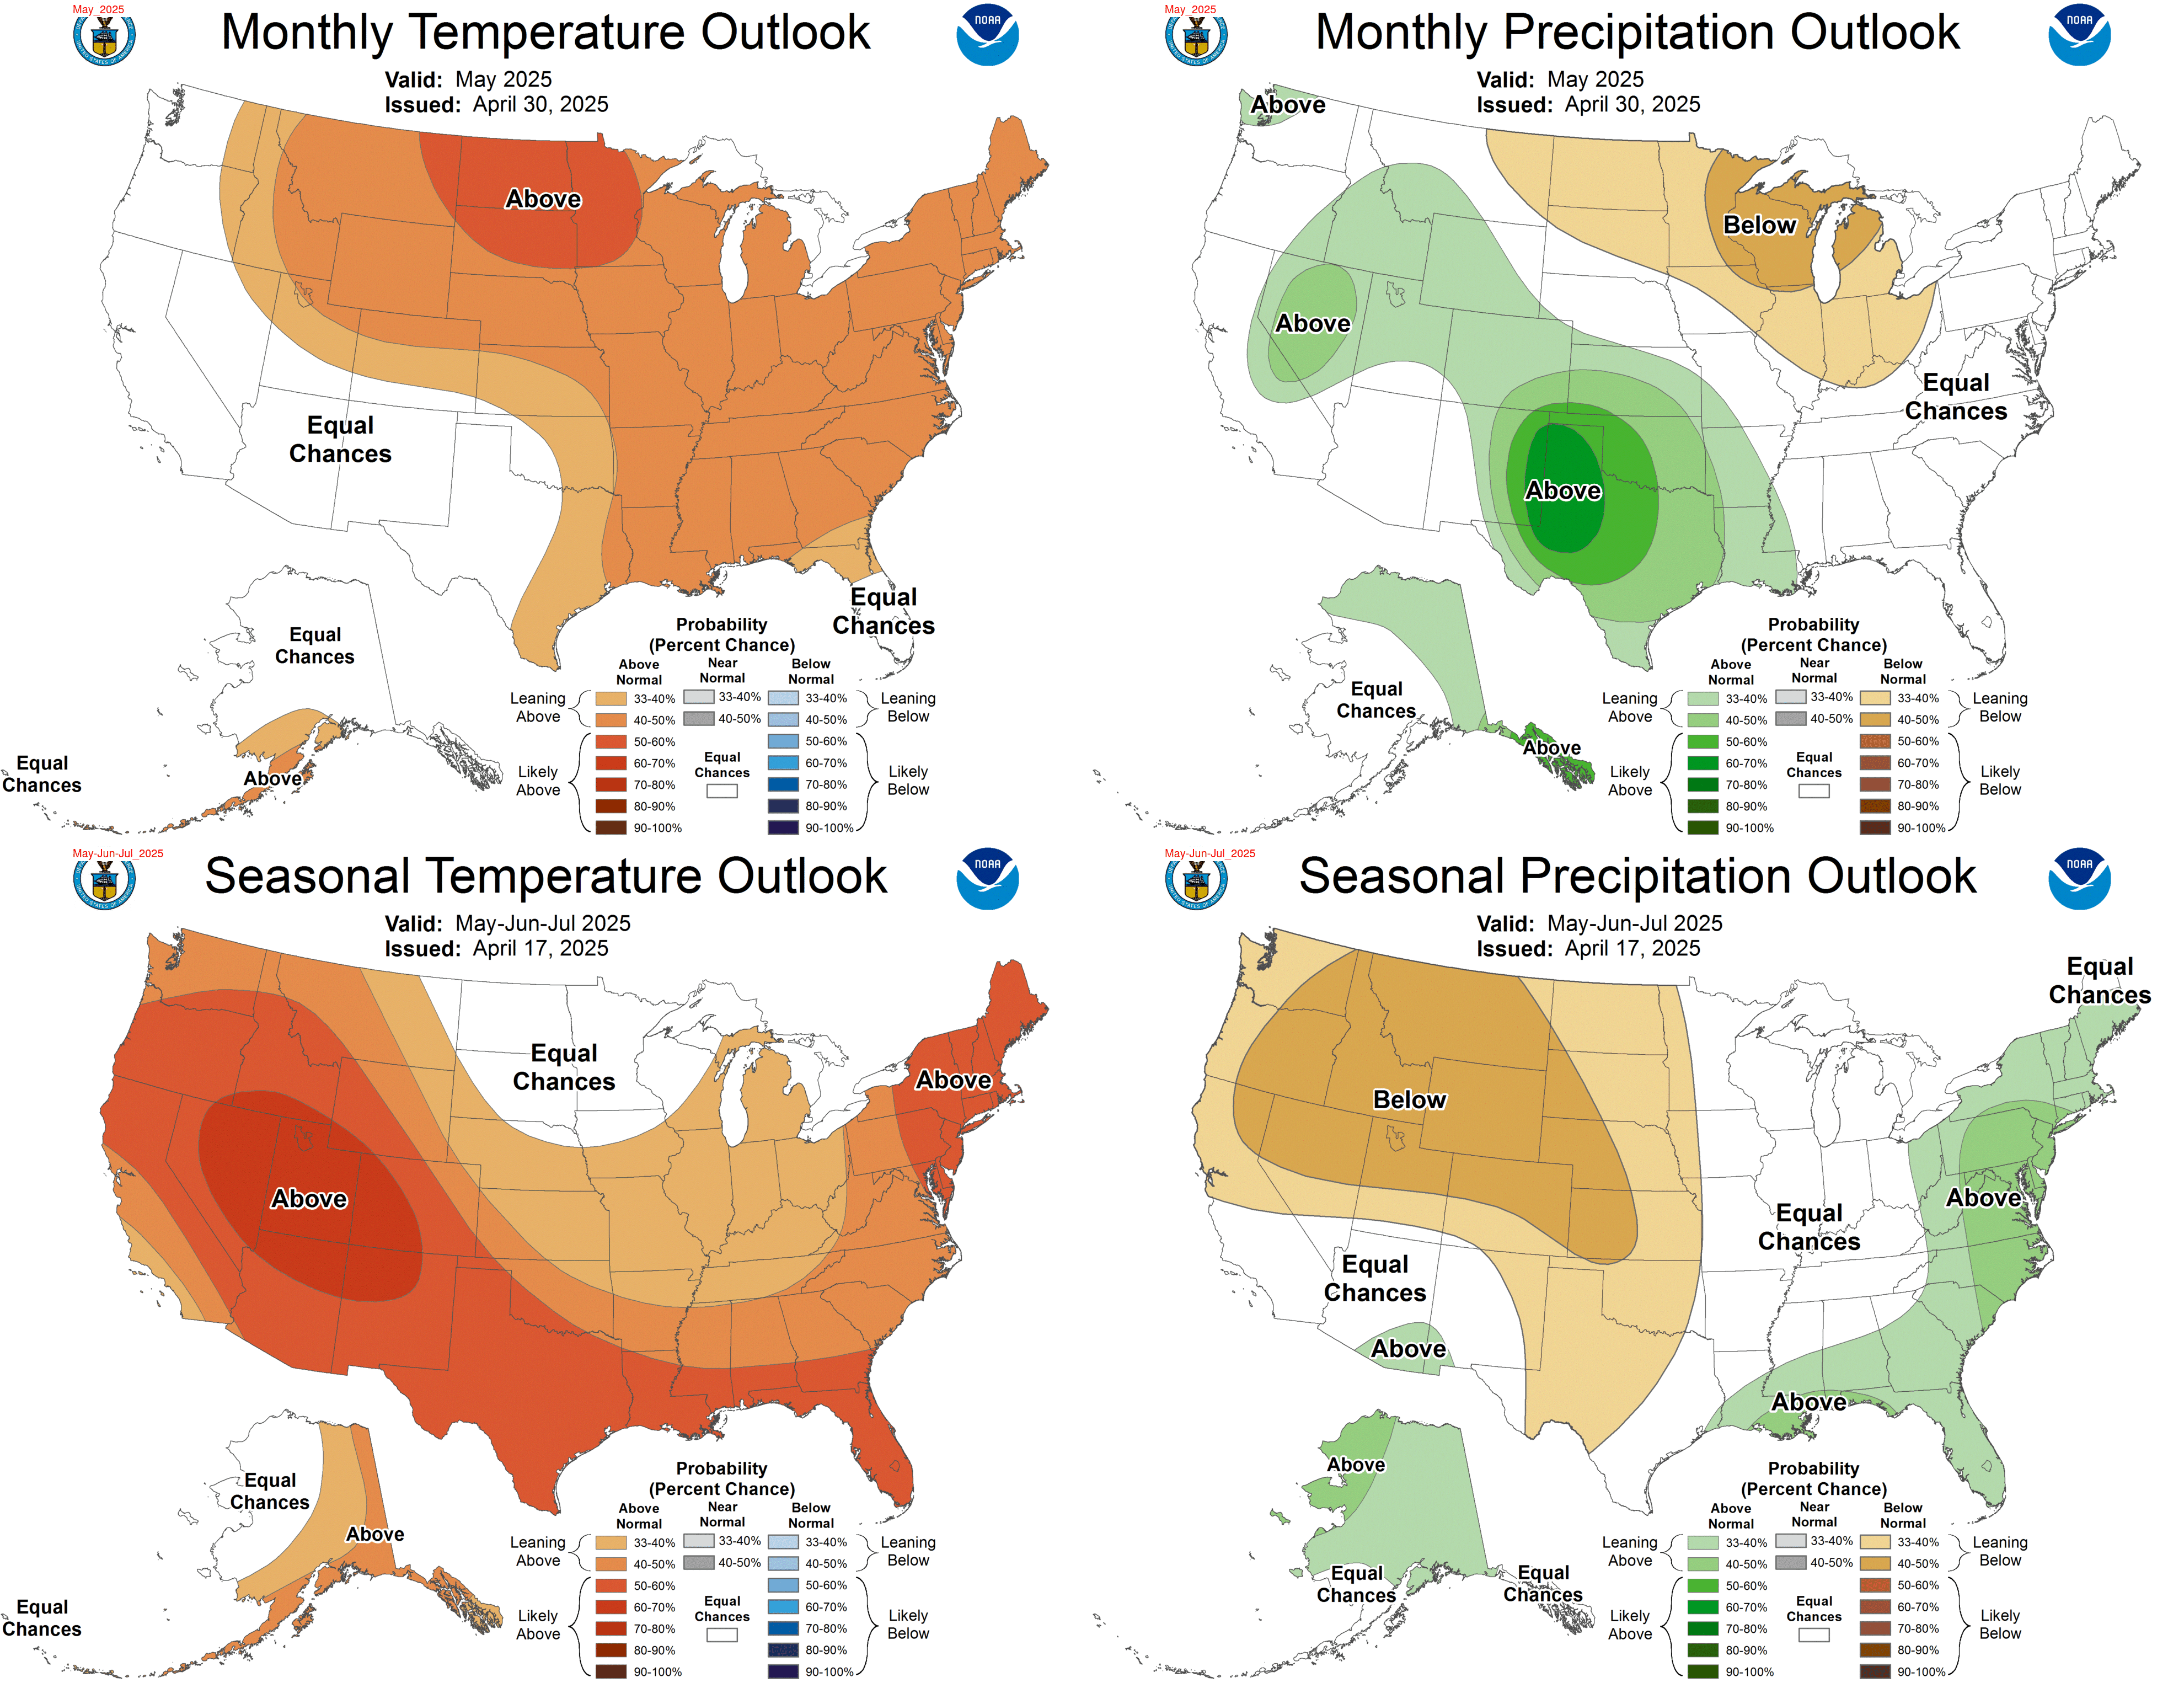
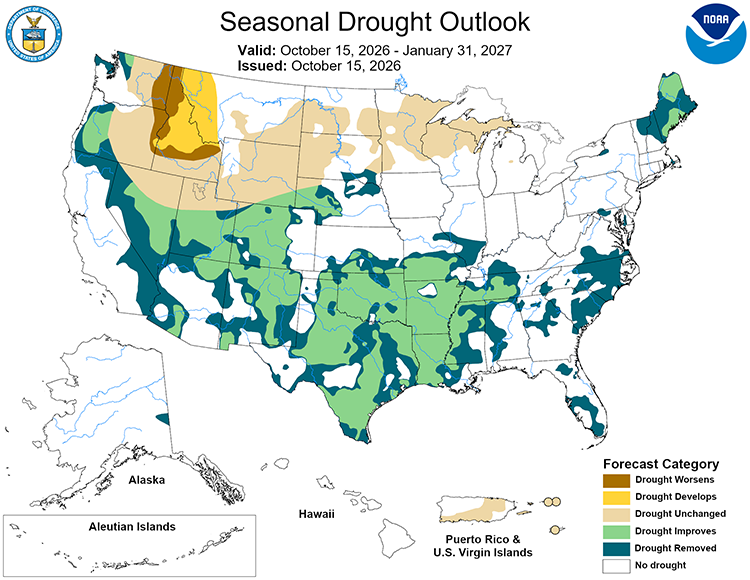
- Warm and wet likely over the next three months: October–December outlooks from the NWS lean toward above-normal precipitation for southern Nevada and California, with above-normal temperatures are likely for much of the region. Drought is expected to improve or be removed in much of the region, with the exception of North/Northeastern Nevada.
- Wildfire fire potential remains: The National Interagency Coordination Center forecasts above-normal significant wildland fire potential for parts of western Nevada around Washoe County in October, with fire potential decreasing later to normal throughout the region after October.
- What does this mean for drought?: California and Nevada are preparing for the winter while also looking at opportunities to take advantage of precipitation that may come. For example, while no single wet winter can resolve long-term groundwater challenges, every opportunity to replenish groundwater basins for future water supplies matters.
NOAA Forecasts Predict Strong El Niño During Fall and Winter
Seasonal (3-Month) Drought Outlook Forecasts Regional Improvement, Except in Northern Nevada
Resources
- Explore regional and state drought information:
- NIDIS and partners are piloting a series of Southern California Sector-Specific Drought Early Warning Outlooks in Water Year 2025-2027. Learn more and get involved by contacting Amanda Sheffield (amanda.sheffield@noaa.gov). View the latest update from September 24.
Prepared By
Amanda Sheffield
California-Nevada DEWS Regional Drought Information Coordinator
Cooperative Institute for Research in Environmental Sciences (CIRES), University of Colorado Boulder
NOAA’s National Integrated Drought Information System
Julie Kalansky
Principal Investigator
California-Nevada Adaptation Program (a NOAA RISA team)
This Drought Status Update is issued in partnership between the National Oceanic and Atmospheric Administration (NOAA), the California-Nevada Adaptation Program (a NOAA RISA team), and the Western Regional Climate Center at the Desert Research Institute to communicate a potential area of concern for drought expansion and/or development within the California-Nevada DEWS region based on recent conditions and the upcoming forecast. NIDIS and its partners will issue future Drought Status Updates as conditions evolve. NIDIS is an interagency program within the Climate Program Office, which is part of NOAA's Office of Oceanic and Atmospheric Research.