Hydrologic and Agricultural Drought Impacts Persist in Portions of Lower and Upper Midwest
Rainfall in the Late June Forecasts
Key Points
- Drought remains a concern across parts of the Midwest, with 13% of the region in Moderate to Extreme Drought (D1–D3), with the greatest extent across Kentucky, southeast Missouri, and Minnesota.
- Recent precipitation patterns have been highly variable, with improvements in Kentucky but continued dryness in Missouri's Bootheel. Historically dry conditions across the Upper Midwest drove drought expansion in parts of Minnesota, northern Iowa, and Wisconsin.
- Hydrologic and agricultural impacts persist in Kentucky and southeast Missouri, including low soil moisture, groundwater and streamflow deficits, low reservoir and stock pond levels, poor pasture conditions, and reduced hay production. Emerging drought issues in north central Minnesota include low soil moisture and surface water, including low flows in the Upper Mississippi River headwaters.
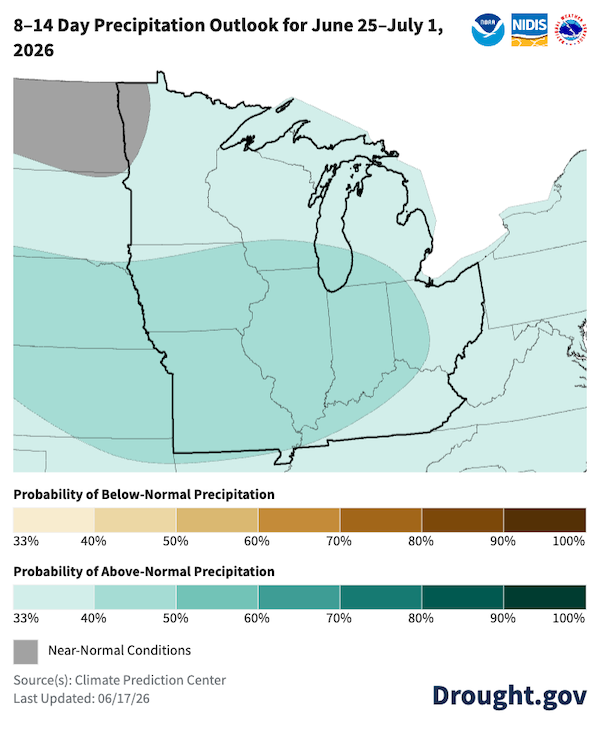
- Forecasts favor above-normal precipitation and below-normal temperatures across the Midwest through the end of June, reducing the likelihood of drought expansion.
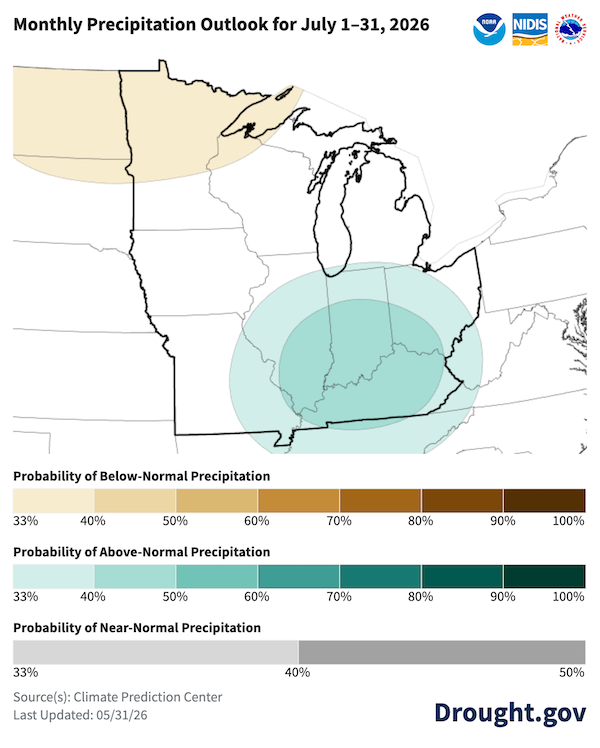
- The July precipitation outlook favors above-normal precipitation across the Ohio River Basin, including Kentucky and southeast Missouri, which could improve drought conditions. In contrast, northern Minnesota has increased chances of below-normal precipitation, limiting potential drought improvement.
This update is based on data available as of Thursday, June 18, 2026 at 8:00 a.m. CT. We acknowledge that conditions are evolving.
The U.S. Drought Monitor depicts the location and intensity of drought across the country. The map uses 5 classifications: Abnormally Dry (D0), showing areas that may be going into or are coming out of drought, and four levels of drought (D1–D4).
The U.S. Drought Monitor is a joint effort of the National Oceanic and Atmospheric Administration, U.S. Department of Agriculture, National Aeronautics and Space Administration, and National Drought Mitigation Center.
A drought index combines multiple drought indicators (e.g., precipitation, temperature, soil moisture) to depict drought conditions. For some products, like the U.S. Drought Monitor, authors combine their analysis of drought indicators with input from local observers. Other drought indices, like the Standardized Precipitation Index (SPI), use an objective calculation to describe the severity, location, timing, and/or duration of drought.
Learn MorePeriods of drought can lead to inadequate water supply, threatening the health, safety, and welfare of communities. Streamflow, groundwater, reservoir, and snowpack data are key to monitoring and forecasting water supply.
Learn MoreDrought can reduce the water availability and water quality necessary for productive farms, ranches, and grazing lands, resulting in significant negative direct and indirect economic impacts to the agricultural sector. Monitoring agricultural drought typically focuses on examining levels of precipitation, evaporative demand, soil moisture, and surface/groundwater quantity and quality.
Learn MoreU.S. Drought Monitor Categories
D0 - Abnormally Dry
Abnormally Dry (D0) indicates a region that is going into or coming out of drought. View typical impacts by state.
D1 - Moderate Drought
Moderate Drought (D1) is the first of four drought categories (D1–D4), according to the U.S. Drought Monitor. View typical impacts by state.
D2 - Severe Drought
Severe Drought (D2) is the second of four drought categories (D1–D4), according to the U.S. Drought Monitor. View typical impacts by state.
D3 - Extreme Drought
Extreme Drought (D3) is the third of four drought categories (D1–D4), according to the U.S. Drought Monitor. View typical impacts by state.
D4 - Exceptional Drought
Exceptional Drought (D4) is the most intense drought category, according to the U.S. Drought Monitor. View typical impacts by state.
Total Area in Drought (D1–D4)
Percent area of the Midwest that is currently in drought (D1–D4), according to the U.S. Drought Monitor.
The U.S. Drought Monitor depicts the location and intensity of drought across the country. The map uses 5 classifications: Abnormally Dry (D0), showing areas that may be going into or are coming out of drought, and four levels of drought (D1–D4).
The U.S. Drought Monitor is a joint effort of the National Oceanic and Atmospheric Administration, U.S. Department of Agriculture, National Aeronautics and Space Administration, and National Drought Mitigation Center.
The U.S. Drought Monitor is released every Thursday morning, with data valid through the previous Tuesday at 7 a.m. ET.
A drought index combines multiple drought indicators (e.g., precipitation, temperature, soil moisture) to depict drought conditions. For some products, like the U.S. Drought Monitor, authors combine their analysis of drought indicators with input from local observers. Other drought indices, like the Standardized Precipitation Index (SPI), use an objective calculation to describe the severity, location, timing, and/or duration of drought.
Learn MorePeriods of drought can lead to inadequate water supply, threatening the health, safety, and welfare of communities. Streamflow, groundwater, reservoir, and snowpack data are key to monitoring and forecasting water supply.
Learn MoreDrought can reduce the water availability and water quality necessary for productive farms, ranches, and grazing lands, resulting in significant negative direct and indirect economic impacts to the agricultural sector. Monitoring agricultural drought typically focuses on examining levels of precipitation, evaporative demand, soil moisture, and surface/groundwater quantity and quality.
Learn MoreCurrent Conditions and Impacts for the Midwest
- Drought persists across southern portions of the Midwest, particularly in Kentucky, southeast Missouri, and southern Illinois.
- According to the U.S. Drought Monitor, 13% of the Midwest is in Moderate to Extreme Drought (D1–D3), with the largest coverage in Kentucky (45%), Minnesota (38%), and Missouri (12%).
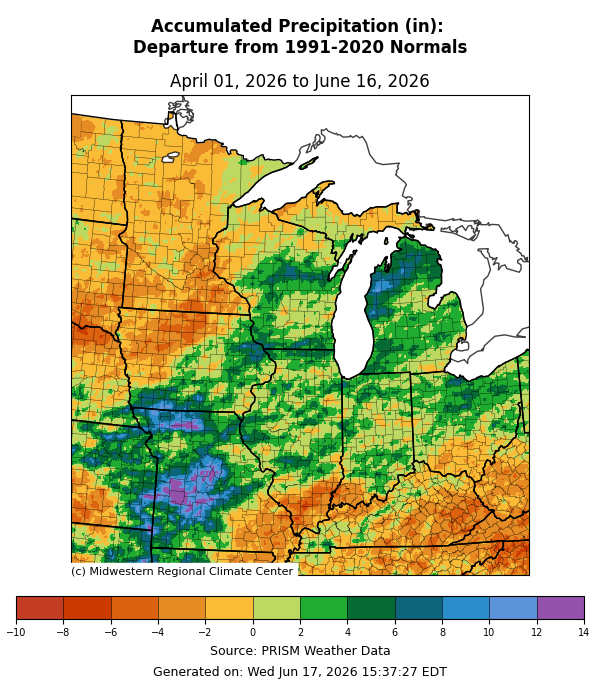
- Over the past 90 days, precipitation has varied across the region with above-normal rainfall across the central Midwest and below-normal rainfall to the north and south.
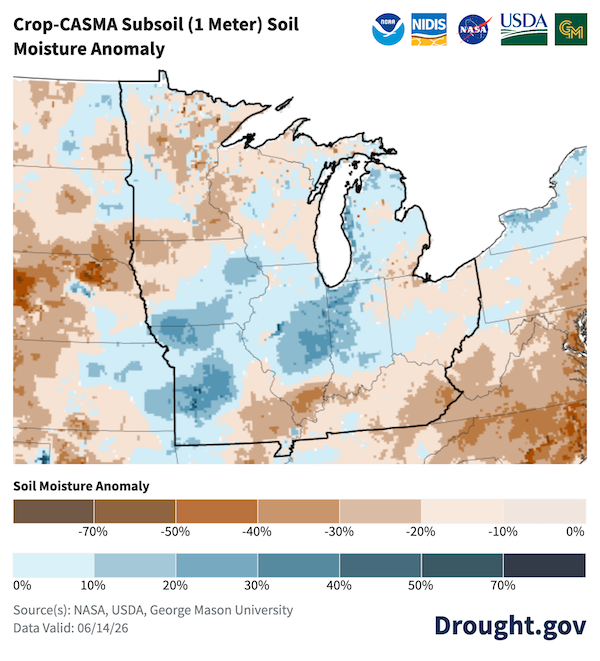
- Despite above-normal precipitation across much of Missouri, the Bootheel remains dry, resulting in low soil moisture, streamflow, and groundwater levels as drought continues to persist since early December.
- Following rapid drought expansion in late March, conditions have improved in Kentucky, though impacts remain, including low reservoir and stock pond levels, reduced streamflow, below-normal hay production, and poor pasture conditions. On June 15, a state of emergency was declared in Liberty in south central Kentucky as the local lake, the town’s water supply, was very low due to extreme drought.
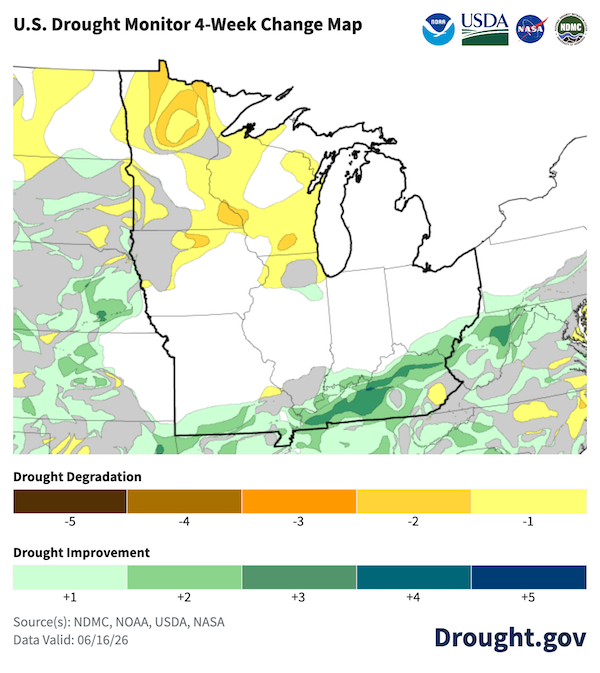
- May was historically dry for the Upper Midwest; Wisconsin, Minnesota, and Michigan all recorded one of their top 10 driest Mays (4th, 8th, 9th, respectively) since 1895. This, in combination with above-normal temperatures, led to the expansion of drought conditions in north-central Minnesota, and portions of northern Iowa and Wisconsin.
- Low flow conditions are a concern in the headwaters of the Mississippi River above the Twin Cities, where two locations are below their low flow thresholds (Brainerd, Minnesota and Grand Rapids, Minnesota).
Precipitation Varied Across Midwest Since April 1
Drought Expanded Across the Upper Midwest Over the Last Four Weeks
Low Soil Moisture Across Lower and Upper Midwest
Outlooks and Potential Impacts in the Midwest
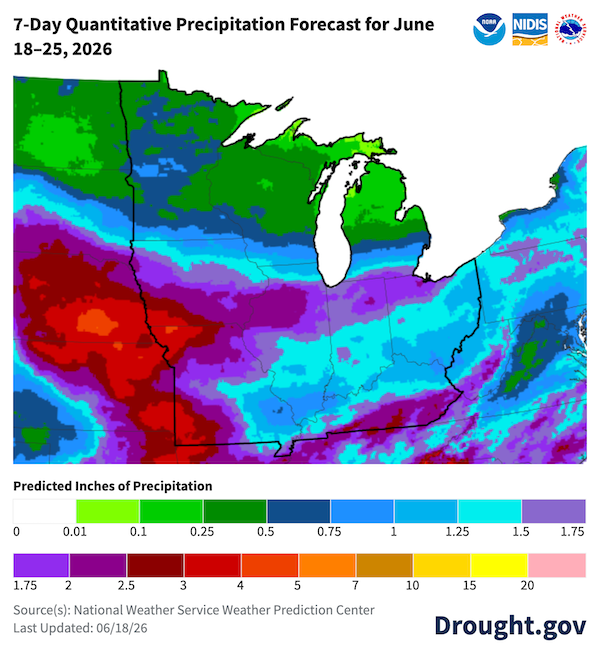
- The next seven days (through June 25) are forecast to bring significant rainfall (3 to 7 inches) to western portions of the region, including Missouri and southwest Iowa. However, the Upper Midwest, where drought recently expanded, is forecast to receive much less (0.01 to 1.25 inches).
- A wet and cooler pattern is expected for the June 25–July 1 time frame across much of the Midwest, with the highest chances for above-normal precipitation over southwest Missouri and the highest chances for below-normal temperatures over the central Midwest and Great Lakes region.
- The July precipitation outlook shows the chance for above-normal precipitation over the Ohio River Basin, including Kentucky and southeast Missouri, which could improve drought conditions in these areas. However, there are greater chances for below-normal precipitation over northern Minnesota, which would minimize drought improvement.
- El Niño conditions have developed in the tropical Pacific Ocean, and NOAA has issued an El Niño Advisory. El Niño, the warm phase of the El Niño Southern Oscillation (ENSO), is currently gaining strength and predicted to intensify to a moderate or strong level this fall. There is a 99% chance of El Niño persisting into the winter, which is when El Niño impacts are typically strongest in the Midwest.
- An El Niño summer could bring more moderate temperatures, but the connection between El Niño and weather in the Midwest is generally weak in the summer. Also, there are other variables in addition to El Niño that impact the region’s weather patterns (e.g., teleconnections in North Atlantic Ocean, natural variability).
Significant Rainfall Expected Across Portions of the Midwest Through June 25
Above-Normal Precipitation Through the End of June
Above-Normal Precipitation Over Ohio River Basin Expected in July
Resources
- More local information is available from the following resources:
- To report or view local drought impact information:
Prepared By
Molly Woloszyn
Cooperative Institute for Research in Environmental Sciences/NOAA National Integrated Drought Information System (NIDIS)
Dennis Todey
USDA Midwest Climate Hub
Melissa Widhalm
Midwestern Regional Climate Center/Purdue University
Molly Peters and James Noel
NOAA National Weather Service North Central and Ohio River Forecast Centers
Denise Gutzmer
National Drought Mitigation Center
A special thank you to the state climate offices and National Weather Service offices in the Midwest region for providing local information on drought conditions and impacts included in this Drought Status Update.
This Drought Status Update is issued in partnership between the National Oceanic and Atmospheric Administration (NOAA), U.S. Department of Agriculture (USDA), U.S. Army Corps of Engineers (USACE), and the National Drought Mitigation Center to communicate a potential area of concern for drought expansion and/or development within the Midwest region based on recent conditions and the upcoming forecast. NIDIS and its partners will issue future Drought Status Updates as conditions evolve. NIDIS is an interagency program within the Climate Program Office, which is part of NOAA's Office of Oceanic and Atmospheric Research.


