Recent storms bring some snow drought relief, but below-normal snowpack remains.
Key Points
- Snow drought remains across the western U.S. even as recent atmospheric rivers and storminess improved snowpack in some areas, such as the Sierra Nevada.
- As of early February, dry snow drought conditions are focused in northeast Nevada, Utah, and western Colorado, and a warm snow drought signal is emerging in parts of Oregon.
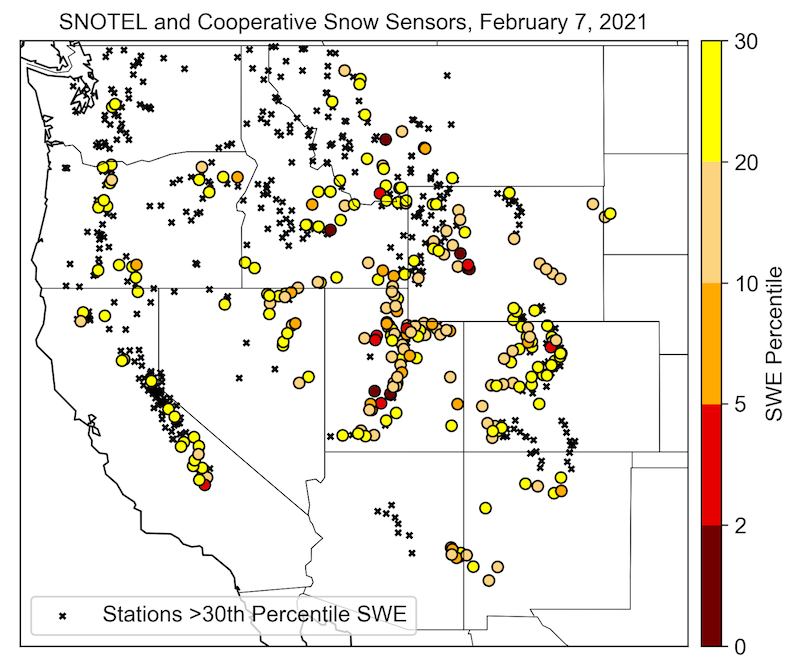
This USDA Natural Resources Conservation Service (NRCS) map shows Snow Telemetry (SNOTEL) snow water equivalent (SWE) basin values over the western U.S. as a percent of the NRCS 1981–2010 median. Only stations with at least 20 years of data are included in the station averages.
The SWE percent of normal represents the current snow water equivalent found at selected SNOTEL sites in or near the basin compared to the average value for those sites on this day. This map is valid as of February 7, 2021.
For an interactive version of this map please visit NRCS.
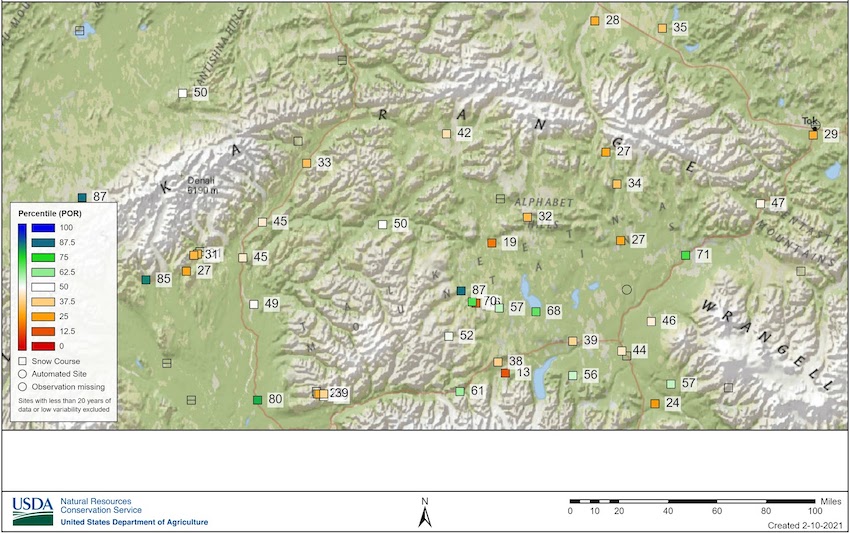
This USDA Natural Resources Conservation Service (NRCS) map shows Snow Telemetry (SNOTEL) snow water equivalent (SWE) basin values throughout Alaska as a percent of the NRCS 1981–2010 median. Only stations with at least 20 years of data are included in the station averages.
The SWE percent of normal represents the current snow water equivalent found at selected SNOTEL sites in or near the basin compared to the average value for those sites on this day. This map is valid as of February 7, 2021.
For an interactive version of this map please visit NRCS.
SWE Percent of NRCS 1981-2010 Median
This USDA Natural Resources Conservation Service (NRCS) map shows Snow Telemetry (SNOTEL) snow water equivalent (SWE) basin values over the western U.S. as a percent of the NRCS 1981–2010 median. Only stations with at least 20 years of data are included in the station averages.
The SWE percent of normal represents the current snow water equivalent found at selected SNOTEL sites in or near the basin compared to the average value for those sites on this day. This map is valid as of February 7, 2021.
For an interactive version of this map please visit NRCS.
This USDA Natural Resources Conservation Service (NRCS) map shows Snow Telemetry (SNOTEL) snow water equivalent (SWE) basin values throughout Alaska as a percent of the NRCS 1981–2010 median. Only stations with at least 20 years of data are included in the station averages.
The SWE percent of normal represents the current snow water equivalent found at selected SNOTEL sites in or near the basin compared to the average value for those sites on this day. This map is valid as of February 7, 2021.
For an interactive version of this map please visit NRCS.
Current Conditions
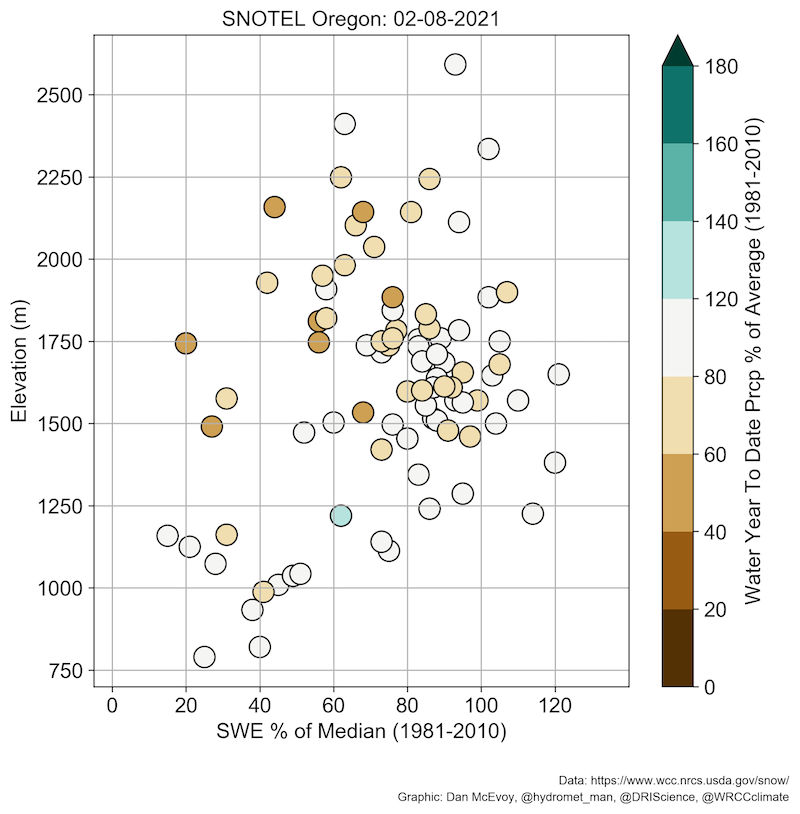
Widespread below-normal snowpack has persisted into February across the Western U.S. with the exception of parts of Washington, Montana, and parts of southern Colorado. The greatest changes in snow drought (improvements in this case) since early January were found throughout the Sierra Nevada and the mountains of Central Arizona. An atmospheric river impacted the region during the last week of January, bringing heavy mountain snowfall and substantial snow water equivalent (SWE) increases. This single storm system brought most of the central and northern Sierra Nevada as well as all SNOTEL stations in central Arizona out of snow drought (defined here as SWE below the 30th percentile*) but with conditions remaining below median values. Mountains along the Arizona-New Mexico border received some precipitation and snow from these storms, but prior to the storm had little-to-no snowpack and were not able to recover above the 30th percentile snow drought threshold. As of early February, the heart of the snow drought conditions are focused in northeast Nevada, Utah, and western Colorado. While most of the snow drought signal in the West is due a general lack of precipitation since the start of the water year, a warm snow drought signal is emerging throughout Oregon. This can be seen by a cluster of SNOTEL stations all below 1,200 m (~4,000 feet) that are between 20%-60% of median SWE despite receiving near-normal precipitation, while most of the higher elevation stations (~1,200-1,800 m) are at 60%-100% of median SWE.
SNOTEL observations in Alaska, albeit quite limited in spatial distribution for much of the state, show below-normal snowpack for the south slope of the central Brooks Range. Snow course measurements from early February, which greatly expand the coverage of SWE observations beyond the SNOTEL network, show an additional area of below-normal SWE covering the south slope of the Alaska Range and also the southwest Talkeetna Mountains. Meanwhile, SWE in the Kenai Peninsula is at near record values for early February. Three snow courses (Bertha Creek, Kenai Summit, and Moose Pass), each with 52 years of data, are all reporting 98th percentile SWE with the early February snow survey.
Alaska Snow Course Snow Water Equivalent Percentiles: February 1, 2021
Snow Water Equivalent (SWE) Values in the West: 30th Percentile or Lower
Oregon Water Year to Date Precipitation Percent of Average: February 8, 2021
*Quantifying snow drought values is an ongoing research effort. Here we have used the 30th percentile as a starting point based on partner expertise. Get more information on the current definition of snow drought here.
For More Information, Please Contact:
Daniel McEvoy
Western Regional Climate Center
Daniel.McEvoy@dri.edu
Amanda Sheffield
NOAA/NIDIS California-Nevada Regional Drought Information Coordinator
Amanda.Sheffield@noaa.gov
Britt Parker
NOAA/NIDIS Pacific Northwest and Missouri River Basin Regional Drought Information Coordinator
Britt.Parker@noaa.gov
NIDIS and its partners launched this snow drought effort in 2018 to provide data, maps, and tools for monitoring snow drought and its impacts as well as communicating the status of snow drought across the United States, including Alaska. Thank you to our partners for your continued support of this effort and review of these updates. If you would like to report snow drought impacts, please use the link below. Information collected will be shared with the states affected to help us better understand the short-term, long-term, and cumulative impacts of snow drought to the citizens and the economy of the regions reliant on snowpack.
Report your Snow Drought Impacts Data and Maps | Snow Drought Research and Learn | Snow Drought

