While the Snow Piles Up Across California and the Great Basin, Snow Drought Concerns Have Popped Up in Parts of the Northwest and Southern Colorado
Key Points
- South and south-central Colorado snowpack in basins draining into the Arkansas, White, and Red Rivers is of concern with snow water equivalent (SWE) currently in the 10th to 20th percentile for the period of record in the Sangre De Cristo Mountains.
- Across the Pacific Northwest, SWE ranges from 82%–133% of normal, but with dry soil moisture profiles, low streamflows, low water levels in many reservoirs, and below-normal water year precipitation, there is concern that drought conditions will continue or worsen. The ultimate outcome will depend on spring precipitation and the timing of spring meltout.
- SWE across Alaska is near to above normal with the exception of portions of the Kenai Peninsula, the North Slope, and the southwest coast west of Bethel, where levels are below normal.
- The deepest snowpacks are currently found in California and the Great Basin. This raises concerns for flooding, particularly in California, due to potential warmer storms with high-elevation rain, as well as spring runoff.
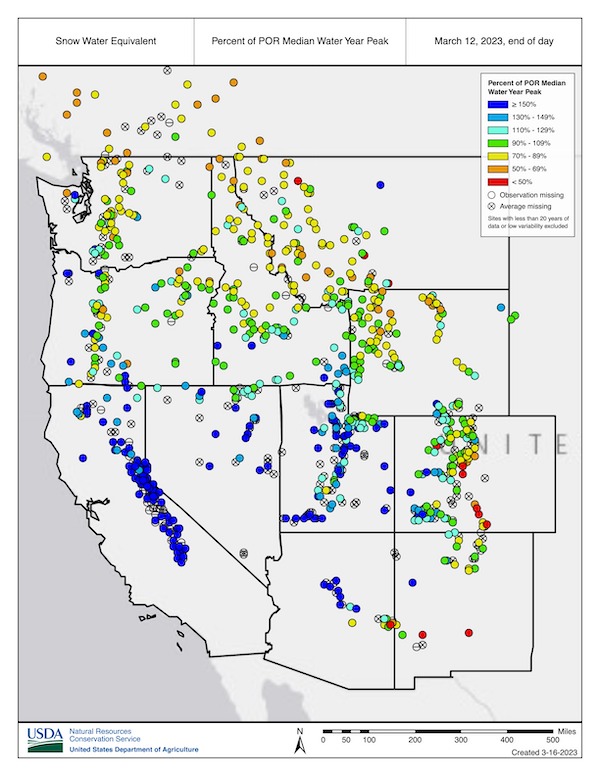
Snow Telemetry (SNOTEL) snow water equivalent (SWE) values for watersheds in the western U.S. as a percentage of the 1991–2020 median recorded by the USDA Natural Resources Conservation Service (NRCS). Only stations with at least 20 years of data are included in the station averages.
The SWE percent of normal represents the current SWE at selected SNOTEL stations in or near the basin compared to the median value for those stations on the same date from 1991–2020. This map is valid as of March 12, 2023.
For an interactive version of this map, please visit NRCS.
Snow Telemetry (SNOTEL) snow water equivalent (SWE) values for watersheds in Alaska as a percentage of the 1991–2020 median recorded by the USDA Natural Resources Conservation Service (NRCS). Only stations with at least 20 years of data are included in the station averages.
The SWE percent of normal represents the current SWE at selected SNOTEL stations in or near the basin compared to the median value for those stations on the same date. This map is valid as of March 12, 2023.
For an interactive version of this map, please visit NRCS.
SWE Percent of NRCS 1991–2020 Median
SWE Percent of NRCS 1991–2020 Median
Snow Telemetry (SNOTEL) snow water equivalent (SWE) values for watersheds in the western U.S. as a percentage of the 1991–2020 median recorded by the USDA Natural Resources Conservation Service (NRCS). Only stations with at least 20 years of data are included in the station averages.
The SWE percent of normal represents the current SWE at selected SNOTEL stations in or near the basin compared to the median value for those stations on the same date from 1991–2020. This map is valid as of March 12, 2023.
For an interactive version of this map, please visit NRCS.
Snow Telemetry (SNOTEL) snow water equivalent (SWE) values for watersheds in Alaska as a percentage of the 1991–2020 median recorded by the USDA Natural Resources Conservation Service (NRCS). Only stations with at least 20 years of data are included in the station averages.
The SWE percent of normal represents the current SWE at selected SNOTEL stations in or near the basin compared to the median value for those stations on the same date. This map is valid as of March 12, 2023.
For an interactive version of this map, please visit NRCS.
The active storm track trend of this snow season continued over the past month with deep snowpacks continuing to grow across the Sierra Nevada, Great Basin, and Colorado River Basin. The snowpack in parts of the Pacific Northwest and northern Rockies (northern Idaho and northwest Montana) is below normal.
At the river basin extent (HUC6), snow water equivalent (SWE) in nearly all basins is currently above 90% of median. However, SWE is currently low at some clusters of stations in northern Washington, northern Idaho, and northwest Montana; in the Sangre De Cristo Mountains in southern Colorado, SWE is currently in the 10th–20th percentile for the period of record. Most of the stations in south-central Colorado with snow drought concerns drain in the Arkansas, White, and Red Rivers. Snowpack in basins that drain into the Rio Grande and Colorado Rivers is much higher. SWE in the Arkansas-White-Red HUC2 (large river basin) is currently at 85% of median for the date and at 74% of peak median for late March.
Across the Pacific Northwest, SWE at the river basin extent (HUC6) ranges from 82%–133% of median. However, given very dry soil moisture profiles (including some record lows in the Cascade Range in Oregon and Washington); low streamflows; low reservoir levels, especially in Oregon; and low water year precipitation, there is a concern that the snowpack will not be sufficient to alleviate drought conditions across the region this spring. There are also concerns about similar conditions in northern Idaho and the Upper Snake River. Spring temperatures and precipitation will determine when and how quickly snowmelt occurs. A cool, wet spring, such as that in 2022, could mitigate some of these concerns. Alternatively, a dry and warm spring, such as that in 2021, could lead to widespread worsening of drought despite the current condition of the mountain snowpack.
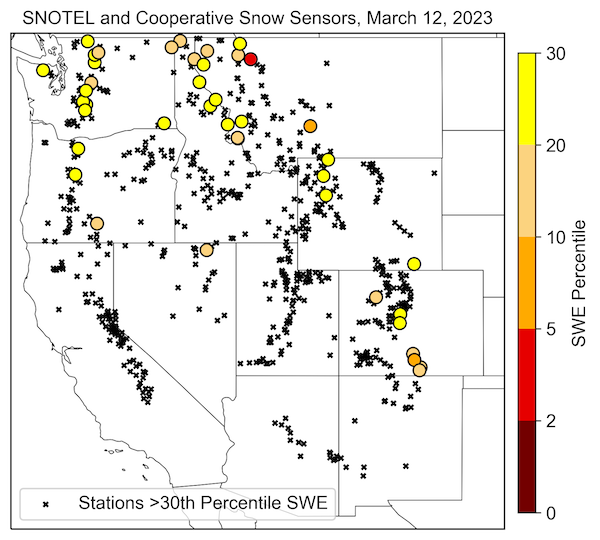
A lull in strong storms occurred across much of the West in the middle of February, but another long-duration storm cycle began toward the end of the month. SWE at about 14% of all SNOTEL and Cooperative Snow Sensor stations in the western United States is at record high for this time of year. The majority of these record highs are in the Sierra Nevada, northern Nevada, and Utah. The deepest snowpacks right now are largely in the Sierra Nevada, where SWE at a number of stations is greater than 60 inches and at some stations is approaching 100 inches. A few locations in the eastern Sierra with 35–45 years of record have reached their highest SWE not just for the current date but for any date. The swing this year from severe drought to extreme wet may test water management in the San Joaquin Valley.
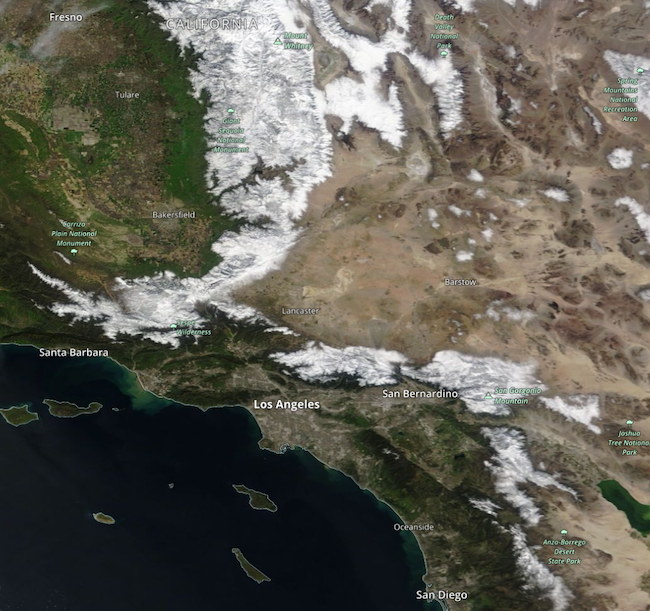
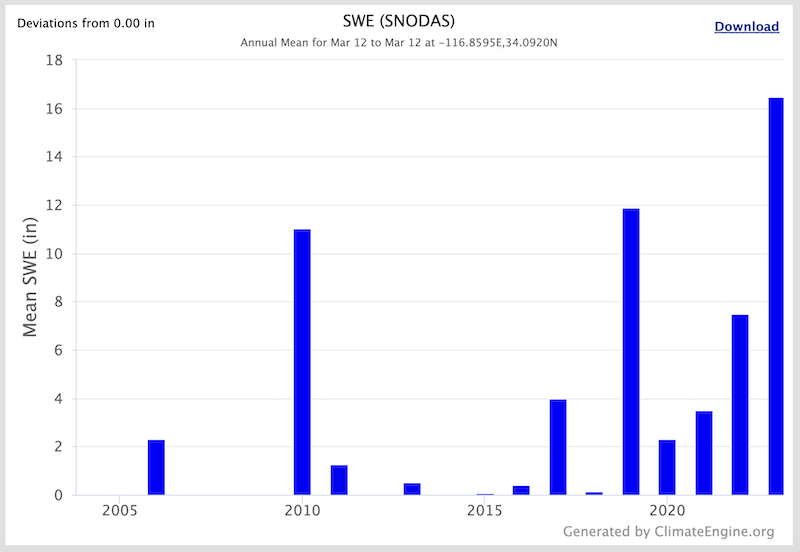
Storms in late February and early March that impacted central and northern California also heavily impacted southern California. The National Weather Service’s San Diego office issued their first-ever blizzard warning as unusually cold temperatures, high winds, and extreme snowfall were forecast to occur in the Transverse Ranges. The National Weather Service’s Los Angeles office posted storm total snowfall reports of 3–6 feet at several locations and the highest snowfall total report, 93 inches, at Mountain High. Few SWE measurements are available from this region, but modeled SWE from NOAA’s Snow Data Assimilation System (SNODAS) indicates that the snowpack in the Transverse Ranges this year is the deepest, and by a large margin, since records began in 2004. In the San Bernardino Mountains, SWE in high-elevation 1-km SNODAS grid cells was estimated to be greater than 20 inches, which is about double the previous SNODAS record from April 2020. The snowpack is great news for the local water supply, but raises concerns about flooding following potentially warmer spring storms with high-elevation rain and spring runoff.
Most SNOTEL sites in Alaska indicate near-to-above normal snowpack with the exception of the Kenai Peninsula, where SWE at a cluster of three stations near the east end of the Turnagain Arm ranges from 63%–75% of median. This low snowpack is due to a localized lack of precipitation in this region this winter. SWE at nearby sites to the west and southwest is much higher. Modeled SWE from ERA5 Land, which is particularly useful where no observations exist, indicates below-normal SWE along parts of the North Slope and west of Bethel on the southwest coast. SWE is relatively high (122%–147% of median) in the Yukon-Tanana uplands to the northeast of Fairbanks. March 1 snow survey data indicated record high SWE throughout the Copper River Basin, which continues the regional trend of high snowpack since early February.
Snow Water Equivalent Percent of Median Water Year Peak
Stations with SWE Below the 30th Percentile
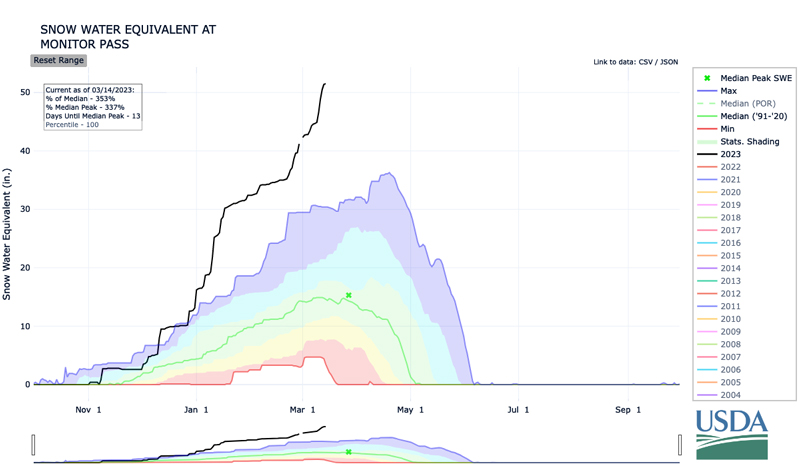
SWE at Monitor Pass, California
Satellite Image: Snowpack in the San Bernardino Mountains
Annual Mean SWE for March 12: San Bernardino Mountains
* Quantifying snow drought values is an ongoing research effort. Here we have used the 30th percentile as a starting point based on partner expertise and research. Get more information on the current definition of snow drought here.
For More Information, Please Contact:
Daniel McEvoy
Western Regional Climate Center
Daniel.McEvoy@dri.edu
Amanda Sheffield
NOAA/NIDIS California-Nevada Regional Drought Information Coordinator
Amanda.Sheffield@noaa.gov
Britt Parker
NOAA/NIDIS Pacific Northwest Regional Drought Information Coordinator
Britt.Parker@noaa.gov
NIDIS and its partners launched this snow drought effort in 2018 to provide data, maps, and tools for monitoring snow drought and its impacts as well as communicating the status of snow drought across the United States, including Alaska. Thank you to our partners for your continued support of this effort and review of these updates. If you would like to report snow drought impacts, please use the link below. Information collected will be shared with the states affected to help us better understand the short term, long term, and cumulative impacts of snow drought to the citizens and the economy of the regions reliant on snowpack.
Report Your Snow Drought Impacts Data and Maps | Snow Drought Research and Learn | Snow Drought