Low Precipitation and Warm Temperatures Drive Western Snow Drought Risk
Key Points
- Snow drought is most prevalent in the Northern Rockies, Sierra Nevada, and parts of the southern Intermountain West. Low precipitation is driving snow drought in the Rockies and southern Intermountain West, while the Sierra Nevada is experiencing low precipitation and warm temperatures.
- An area of concern includes snow drought in the Rio Grande Basin headwaters and north-central New Mexico, where Extreme Drought (D3) is already present due to a weak monsoon.
- Early December storms benefitted the Pacific Northwest and Great Basin, but did not improve snow drought in the remaining regions. Ongoing high-elevation rain is reversing gains in the Cascade Range.
- Temperature will play a key role in snow drought development. Current National Weather Service seasonal outlooks favor above-normal temperatures for most Western states through the Northern Rockies. With a strong El Niño likely this winter, outlooks show increased odds of above-normal precipitation centered over California and below normal centered over Montana.
- Snow drought conditions will continue to evolve throughout winter. Early in the season, snow drought recovery can happen quickly. Recovery from snow drought in late winter and early spring, when snowpack is typically near peak, can be more difficult.
Snow Telemetry (SNOTEL) snow water equivalent (SWE) values for watersheds in the western U.S. as a percentage of the 1991–2020 median recorded by the USDA Natural Resources Conservation Service (NRCS). Only stations with at least 20 years of data are included in the station averages.
The SWE percent of normal, in this figure and in the text, represents the current SWE at selected SNOTEL stations in or near the basin compared to the median value for those stations on the same date from 1991–2020. This map is valid through the end of the day December 3, 2023.
For an interactive version of this map, please visit NRCS.
Snow Telemetry (SNOTEL) and snow course snow water equivalent (SWE) values for watersheds in Alaska as a percentage of the 1991–2020 median recorded by the USDA Natural Resources Conservation Service (NRCS). Only stations with at least 20 years of data are included in the station averages.
The SWE percentage of normal, in this figure and in the text, represents the current SWE at selected SNOTEL stations in or near the basin compared to the median value for those stations on the same date. This map is valid through the end of the day on December 3, 2023.
For an interactive version of this map, please visit NRCS.
Percent of Median Snow Water Equivalent
< 50% of Median
Current snow water equivalent (SWE) is less than 50% of the median SWE value for this day of the year, compared to historical conditions from 1991–2020.
50%–70% of Median
Current snow water equivalent (SWE) is between 50%–70% of the median SWE value for this day of the year, compared to historical conditions from 1991–2020.
70%–90% of Median
Current snow water equivalent (SWE) is between 70%–90% of the median SWE value for this day of the year, compared to historical conditions from 1991–2020.
90%–110% of Median
Current snow water equivalent (SWE) is between 90%–110% of the median SWE value for this day of the year, compared to historical conditions from 1991–2020.
110%–130% of Median
Current snow water equivalent (SWE) is between 110%–130% of the median SWE value for this day of the year, compared to historical conditions from 1991–2020.
130%–150% of Median
Current snow water equivalent (SWE) is between 130%–150% of the median SWE value for this day of the year, compared to historical conditions from 1991–2020.
>150% of Median
Current snow water equivalent (SWE) is greater than 150% of the median SWE value for this day of the year, compared to historical conditions from 1991–2020.
Snow Telemetry (SNOTEL) snow water equivalent (SWE) values for watersheds in the western U.S. as a percentage of the 1991–2020 median recorded by the USDA Natural Resources Conservation Service (NRCS). Only stations with at least 20 years of data are included in the station averages.
The SWE percent of normal, in this figure and in the text, represents the current SWE at selected SNOTEL stations in or near the basin compared to the median value for those stations on the same date from 1991–2020. This map is valid through the end of the day December 3, 2023.
For an interactive version of this map, please visit NRCS.
Snow Telemetry (SNOTEL) and snow course snow water equivalent (SWE) values for watersheds in Alaska as a percentage of the 1991–2020 median recorded by the USDA Natural Resources Conservation Service (NRCS). Only stations with at least 20 years of data are included in the station averages.
The SWE percentage of normal, in this figure and in the text, represents the current SWE at selected SNOTEL stations in or near the basin compared to the median value for those stations on the same date. This map is valid through the end of the day on December 3, 2023.
For an interactive version of this map, please visit NRCS.
An updated, interactive version of this map is available through the USDA's Natural Resources Conservation Service.
An updated, interactive version of this map is available through the USDA's Natural Resources Conservation Service.
Snow Drought Conditions Summary
Water Year 2024 (which began October 1, 2023) started on the dry side for much of the West, leading to widespread snow drought conditions through the end of November. November storms in both the Sierra Nevada and the Cascade Range had high snow levels that contributed to warm snow drought conditions at lower elevations. A series of strong storms impacted the Pacific Northwest, northern Great Basin, and central Rockies during the first several days of December and greatly improved snowpack conditions.
Snow drought is an evolving process, not a static state. Early in the season, snow drought recovery can happen quickly following one or two heavy winter storms. Recovery from snow drought during late winter and early spring, when snowpack is typically near peak, can be more difficult due to months of low or melted snow.
Jump to conditions for your region:
- Rocky Mountain Snow Conditions
- New Mexico and Arizona Snow Conditions
- Cascade Range Snow Conditions
- Sierra Nevada and Great Basin Snow Conditions
- Alaska Snow Conditions
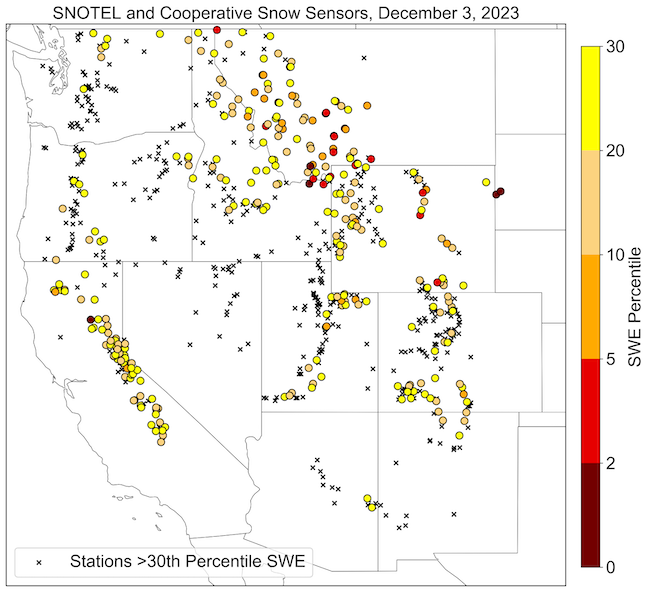
Stations with SWE Below the 30th Percentile
Key Takeaway: Early December storms improved some Western U.S. snowpack conditions, but snow drought (shown here as SWE below the 30th percentile) remains prevalent in the Northern Rocky Mountains, Sierra Nevada, and parts of the Lower Colorado River Basin and Rio Grande River Basin.
Rocky Mountain Snow Conditions
The northern Rocky Mountains in Montana and Idaho are experiencing snow drought conditions, with snow water equivalent (SWE) generally 30%–70% of normal. November was extremely dry in this region, and an early December storm resulted in only minor snowpack improvements. Dry autumn soil moisture in northwest Montana and northern Idaho could impact runoff efficiency come spring.
Further south, snow drought conditions in Utah and Colorado are mixed, but generally better than in the north. The Wasatch and northern Utah mountains received heavy snowfall from December 1–3 (for example, Alta ski area reported a 49-inch storm total), with most of the SNOTEL stations reporting above-normal SWE.
Central and northern Colorado SWE currently ranges from 78%–100% of normal following the early December storm. The San Juan and Sangre de Cristo mountains in southern Colorado have been drier, with SWE generally 60%–90% of normal and 30%–70% of normal, respectively. The Rio Grande Basin is one area of concern given the current Extreme (D3) and Exceptional (D4) drought conditions depicted by the U.S. Drought Monitor and a poor start to the snow season.
New Mexico and Arizona Snow Conditions
SNOTEL observations across the southern portion of the Intermountain West are variable across different mountain ranges. While some basins in western New Mexico are reporting above-normal SWE, the north-central region of New Mexico is between 45%–67% of normal. This is the headwaters region for the Rio Grande basin and is an area of concern coming off a weak 2023 monsoon. The U.S. Drought Monitor currently reports Extreme Drought (D3) in this part of New Mexico.
Arizona SNOTEL sites show more variability. For example, SWE in the San Francisco Peaks is currently 93% of normal, the Verde Basin sits at 79% of normal, and the Salt Basin is 67% of normal.
Cascade Range Snow Conditions
SNOTEL observations throughout the Cascade Range in Washington and Oregon indicate mixed snowpack conditions, but SWE in many locations is near normal as of the end of the day on December 3.
December 1–3 storms created major improvements to the snowpack, with SNOTEL sites throughout the Cascade Range reporting 4–8 inches of accumulated precipitation. These storms began cold, with snow falling even at low elevations. Temperatures rapidly increased on the morning of December 3, with snow levels rising above 8,000 feet and rain falling on all but the highest peaks. The snowpack initially absorbed the rain, increasing SWE, but persistent heavy rain then began to melt the snowpack and reduce SWE.
SWE at the Mount Hood Test Site SNOTEL, one the highest-elevation sites in northern Oregon at 5,370 feet, increased from about 2 inches on November 30 to a peak of 7.5 inches on the morning of December 3. SWE then declined over the next 24 hours to 6.3 inches on the morning of December 4, when the air temperature was in the low 40s (°F). At the end of the day on December 3, SWE at Mount Hood SNOTEL was at 59% of normal.
Snow levels rising above 8,000 feet and rain-on-snow are not uncommon in the Cascade Range, but contribute to the development of warm snow drought conditions if the snowpack is marginal. High-elevation rain throughout December 4–5 has contributed to substantial snowmelt and further transition to warm snow drought conditions.
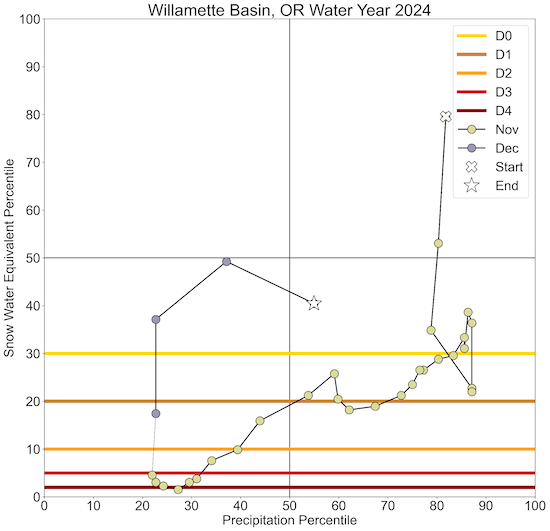
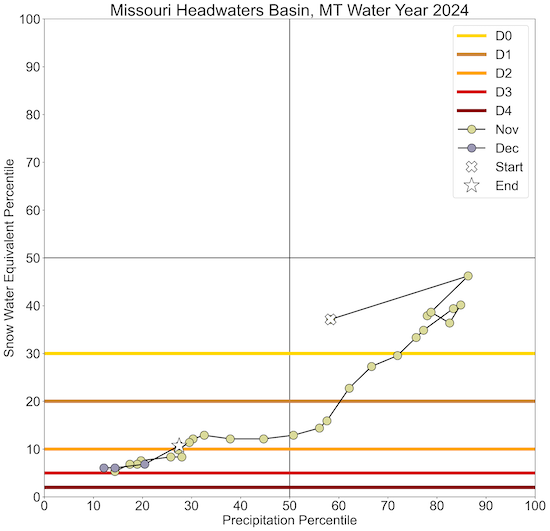
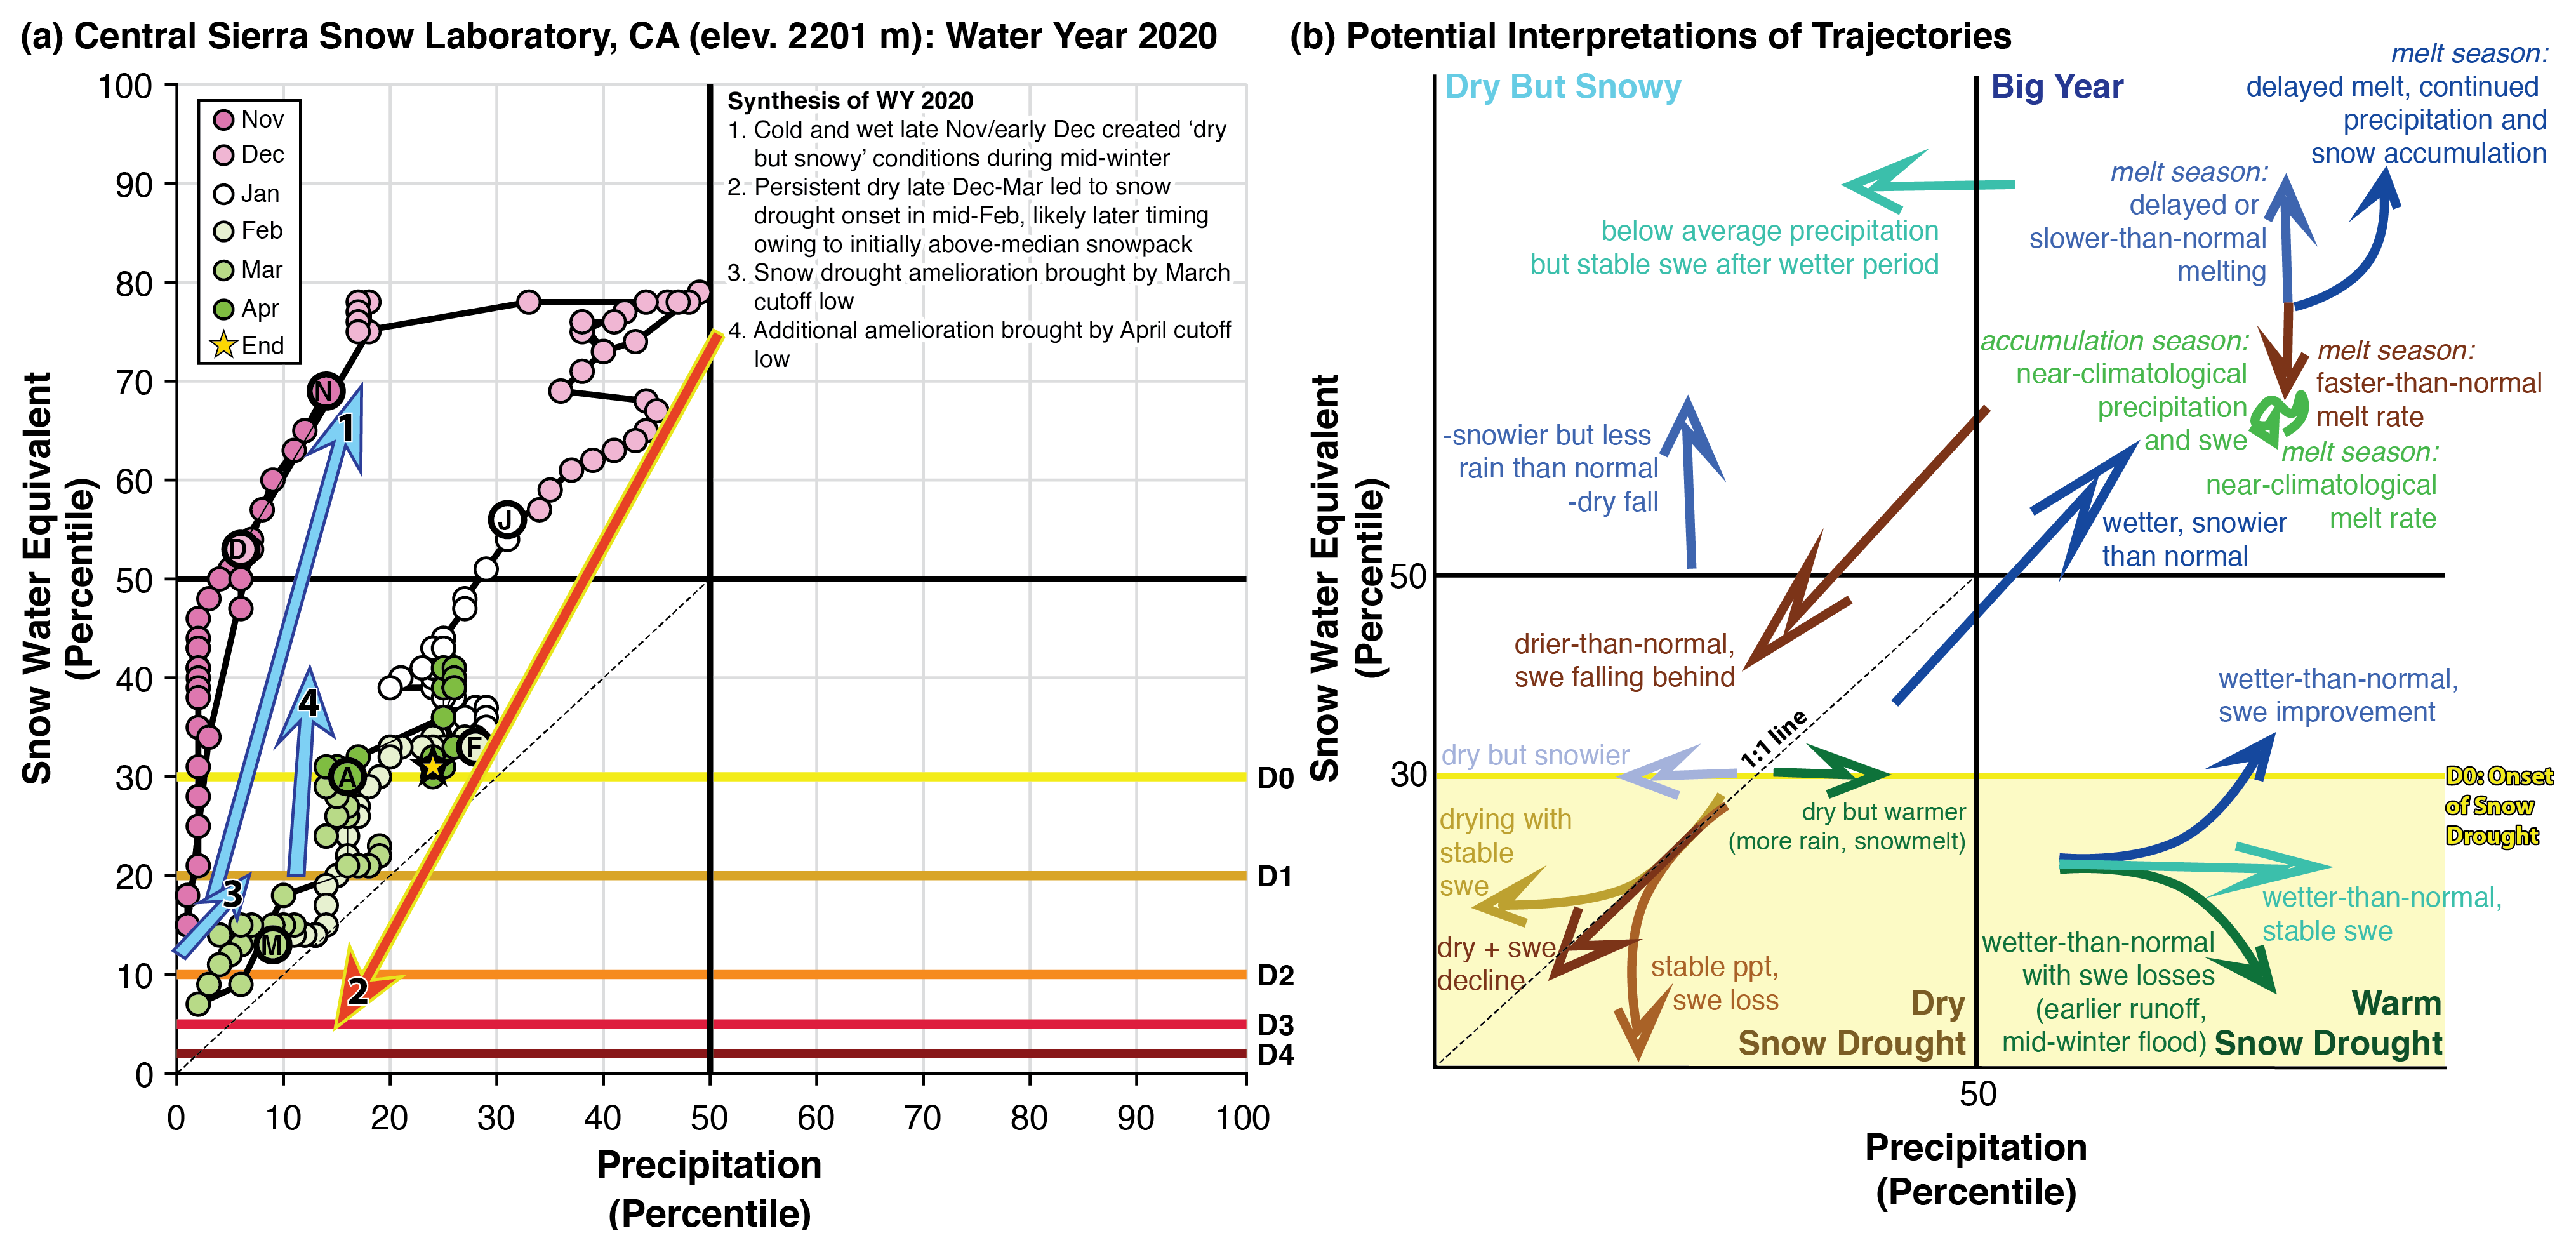
Snow Drought Phase Diagrams for Locations each in the Pacific Northwest and Northern Rocky Mountains
Key Takeaway: Snow drought conditions evolve throughout winter. The water year in the Willamette Basin, Oregon, began as a warm snow drought (lower right quadrant), transitioned to dry snow drought (lower left quadrant), and then emerged from snow drought following early December storms. The Missouri Headwaters Basin, Montana, began with a similar snow drought trajectory, but remains in dry snow drought.
Sierra Nevada and Great Basin Snow Conditions
A combination of warm and dry early season snow drought conditions are present in the Sierra Nevada of California and Nevada. Autumn was relatively dry, and the few small storms were accompanied by warm temperatures and high snow levels.
A thin snowpack exists at high elevations in this region, with SWE generally ranging from 0% to less than 50% of normal. Most of the region was too far south to benefit from the early December storms that impacted the Cascade Range. However, the higher latitudes of the northern Great Basin benefitted from the northwest flow of the storm track. The mountains of eastern Oregon, southern Idaho, and northern Nevada are all reporting SWE ranging from about 150%–250% of normal.
Alaska Snow Conditions
Most SNOTEL observations across Alaska indicate above-normal SWE, with record-breaking November snowpack in some locations. Snowfall in October was near to above normal in the interior, but little snow fell at low to moderate elevations south of the Alaska Range.
A major storm cycle impacted parts of the state in early to mid-November. Anchorage Airport recorded its greatest November snowfall on record (since 1954), 39.3 inches, most of which fell from November 5–13. South-central Alaska currently has the most anomalous snowpack: SWE in the Kenai Peninsula Basin is 162% of normal, and SWE in the Knik Arm Basin is 161% of normal.
SWE at the Mt. Eyak SNOTEL station, near Cordova, is currently at 55% of normal. Several warm precipitation events in November brought heavy rainfall and reduced SWE. For example, 4.7 inches of precipitation on November 8 reduced snow depth from 8 inches to 0 in one day. Webcams in the southern Southeast Alaska mountains suggest that little or no snow is present, but such conditions are not especially unusual for this point in the season (there are no in situ observations).
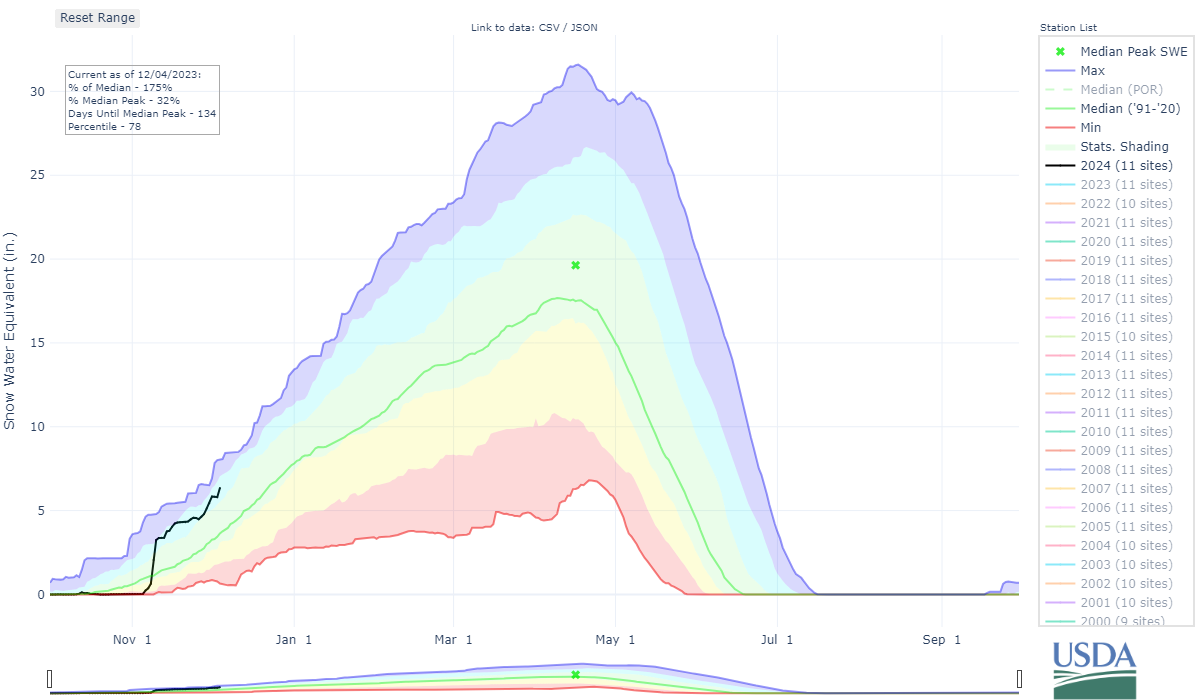
Snow Water Equivalent through time for Kenai Peninsula, Alaska
Key takeaway: SNOTEL observations across Alaska indicate well-above normal SWE for most locations. October was relatively dry, but then a major storm cycle impacted much of the state in early to mid-November.
* Quantifying snow drought values is an ongoing research effort. Here we have used the 30th percentile as a starting point based on partner expertise and research. Get more information on the current definition of snow drought.
For More Information, Please Contact:
Daniel McEvoy
Western Regional Climate Center
Daniel.McEvoy@dri.edu
Amanda Sheffield
NOAA/NIDIS/CIRES California-Nevada Regional Drought Information Coordinator
Amanda.Sheffield@noaa.gov
Britt Parker
NOAA/NIDIS Pacific Northwest Regional Drought Information Coordinator
Britt.Parker@noaa.gov
Gretel Follingstad
NOAA/NIDIS/CIRES Intermountain West Regional Drought Information Coordinator
Gretel.Follingstad@noaa.gov
NIDIS and its partners launched this snow drought effort in 2018 to provide data, maps, and tools for monitoring snow drought and its impacts as well as communicating the status of snow drought across the United States, including Alaska. Thank you to our partners for your continued support of this effort and review of these updates. If you would like to report snow drought impacts, please use the link below. Information collected will be shared with the states affected to help us better understand the short term, long term, and cumulative impacts of snow drought to the citizens and the economy of the regions reliant on snowpack.
Report Your Snow Drought Impacts
Data and Maps | Snow Drought
Research and Learn | Snow Drought

