Storms improved conditions in much of the West. However, snow drought lingers in the Northern Rockies and parts of the Northwest.
Key Points
- Above-normal precipitation in the form of heavy mountain snowfall improved snow drought in much of the West.
- A major 4-day blizzard in early March brought significant snowpack improvements to the Sierra Nevada, leaving the entire region free of snow drought.
- Parts of Washington, northern Wyoming, western Montana, and northern Idaho remain in snow drought because of snowfall and snowpack deficits.
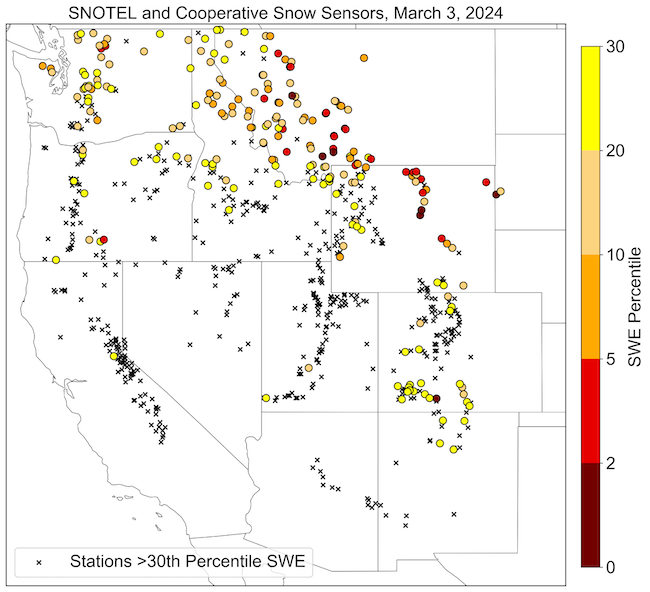
Snow Telemetry (SNOTEL) snow water equivalent (SWE) values for watersheds in the western U.S. as a percentage of the 1991–2020 median recorded by the USDA Natural Resources Conservation Service (NRCS). Only stations with at least 20 years of data are included in the station averages.
The SWE percent of median, in this figure and in the text, represents the current SWE at selected SNOTEL stations in or near the basin compared to the median value for those stations on the same date from 1991–2020. This map is valid through the end of the day March 3, 2024.
For an interactive version of this map, please visit NRCS.
Snow Telemetry (SNOTEL) and snow course snow water equivalent (SWE) values for watersheds in Alaska as a percentage of the 1991–2020 median recorded by the USDA Natural Resources Conservation Service (NRCS). Only stations with at least 20 years of data are included in the station averages.
The SWE percentage of median, in this figure and in the text, represents the current SWE at selected SNOTEL stations in or near the basin compared to the median value for those stations on the same date. This map is valid through the end of the day on March 3, 2024.
For an interactive version of this map, please visit NRCS.
Percent of Median Snow Water Equivalent
< 50% of Median
Current snow water equivalent (SWE) is less than 50% of the median SWE value for this day of the year, compared to historical conditions from 1991–2020.
50%–70% of Median
Current snow water equivalent (SWE) is between 50%–70% of the median SWE value for this day of the year, compared to historical conditions from 1991–2020.
70%–90% of Median
Current snow water equivalent (SWE) is between 70%–90% of the median SWE value for this day of the year, compared to historical conditions from 1991–2020.
90%–110% of Median
Current snow water equivalent (SWE) is between 90%–110% of the median SWE value for this day of the year, compared to historical conditions from 1991–2020.
110%–130% of Median
Current snow water equivalent (SWE) is between 110%–130% of the median SWE value for this day of the year, compared to historical conditions from 1991–2020.
130%–150% of Median
Current snow water equivalent (SWE) is between 130%–150% of the median SWE value for this day of the year, compared to historical conditions from 1991–2020.
>150% of Median
Current snow water equivalent (SWE) is greater than 150% of the median SWE value for this day of the year, compared to historical conditions from 1991–2020.
Snow Telemetry (SNOTEL) snow water equivalent (SWE) values for watersheds in the western U.S. as a percentage of the 1991–2020 median recorded by the USDA Natural Resources Conservation Service (NRCS). Only stations with at least 20 years of data are included in the station averages.
The SWE percent of median, in this figure and in the text, represents the current SWE at selected SNOTEL stations in or near the basin compared to the median value for those stations on the same date from 1991–2020. This map is valid through the end of the day March 3, 2024.
For an interactive version of this map, please visit NRCS.
Snow Telemetry (SNOTEL) and snow course snow water equivalent (SWE) values for watersheds in Alaska as a percentage of the 1991–2020 median recorded by the USDA Natural Resources Conservation Service (NRCS). Only stations with at least 20 years of data are included in the station averages.
The SWE percentage of median, in this figure and in the text, represents the current SWE at selected SNOTEL stations in or near the basin compared to the median value for those stations on the same date. This map is valid through the end of the day on March 3, 2024.
For an interactive version of this map, please visit NRCS.
An updated, interactive version of this map is available through the USDA's Natural Resources Conservation Service.
An updated, interactive version of this map is available through the USDA's Natural Resources Conservation Service.
Snow Drought Conditions Summary for March 3
This update is based on data available up to Sunday, March 3, 2024 at 12:00 a.m. We acknowledge that conditions are evolving.
Snow drought conditions have improved over the past month for most of the West as a result of an active storm track, above-normal precipitation, and heavy snowfall in many mountain locations. However, parts of northern Wyoming, western Montana, northern Idaho, and most of Washington still remain in snow drought due to the large snowfall and snowpack deficits that were present at the beginning of February. A recent 4-day blizzard in the Sierra Nevada brought rapid snowpack improvements: the region now has near- to above-normal snow water equivalent (SWE).
Jump to conditions for your region:
- Rocky Mountain Snow Conditions
- New Mexico and Arizona Snow Conditions
- Cascade Range Snow Conditions
- Sierra Nevada and Great Basin Snow Conditions
- Alaska Snow Conditions
Stations with SWE Below the 30th Percentile in the Western U.S.
Key Takeaway: Snow water equivalent (SWE) remains below the 30th percentile at 54% of stations in the western contiguous U.S. The worst snow drought conditions are in parts of Washington, northern Wyoming, western Montana, and northern Idaho.
Rocky Mountain Snow Conditions
Following the trend for much of this snow season, the northern Rocky Mountains remain largely in a snow drought. However, near-to-above normal SWE occurs in much of the southern portion of the region. Hydrologic Unit Code (HUC) 6 basins indicate 59%–80% of normal SWE in northern Idaho, Montana, and northeastern Wyoming, with many individual SNOTEL stations in this area reporting SWE below the 15th percentile. Montana and Wyoming each have three SNOTEL stations reporting record-low SWE. This includes Shower Falls, Montana, which has a very long period of record from 1964 to the present. February and early March storms improved conditions, but did not erase snow drought. For example, SWE in the Missouri River Headwaters HUC 6 basin increased from the 3rd percentile in early February to the 14th percentile on March 4.
In Colorado, SWE in HUC 6 basins ranges from 86%–108% of normal. SWE in the Rio Grande Headwaters is the lowest in the state. SWE at a number of stations in the San Juan Mountains and the Sangre de Cristo Mountains is below the 30th percentile. Snow drought concerns are limited in Utah, with most locations well above 100% of normal SWE.
New Mexico and Arizona Snow Conditions
SWE throughout Arizona and southern New Mexico is variable, with SNOTEL stations ranging from 11%–127% of normal SWE. Peak SWE in this region generally occurs from early February to early March depending on elevation and aspect. It appears that snowpack in many locations peaked in mid-February at 69%–172% of normal SWE during this time period. Substantial snowmelt in many lower-elevation locations during the last week of February drastically lowered the percent of normal SWE. Accordingly, current SWE is not necessarily indicative of low seasonal peak SWE, though it highlights that melt has started earlier than usual in several locations.
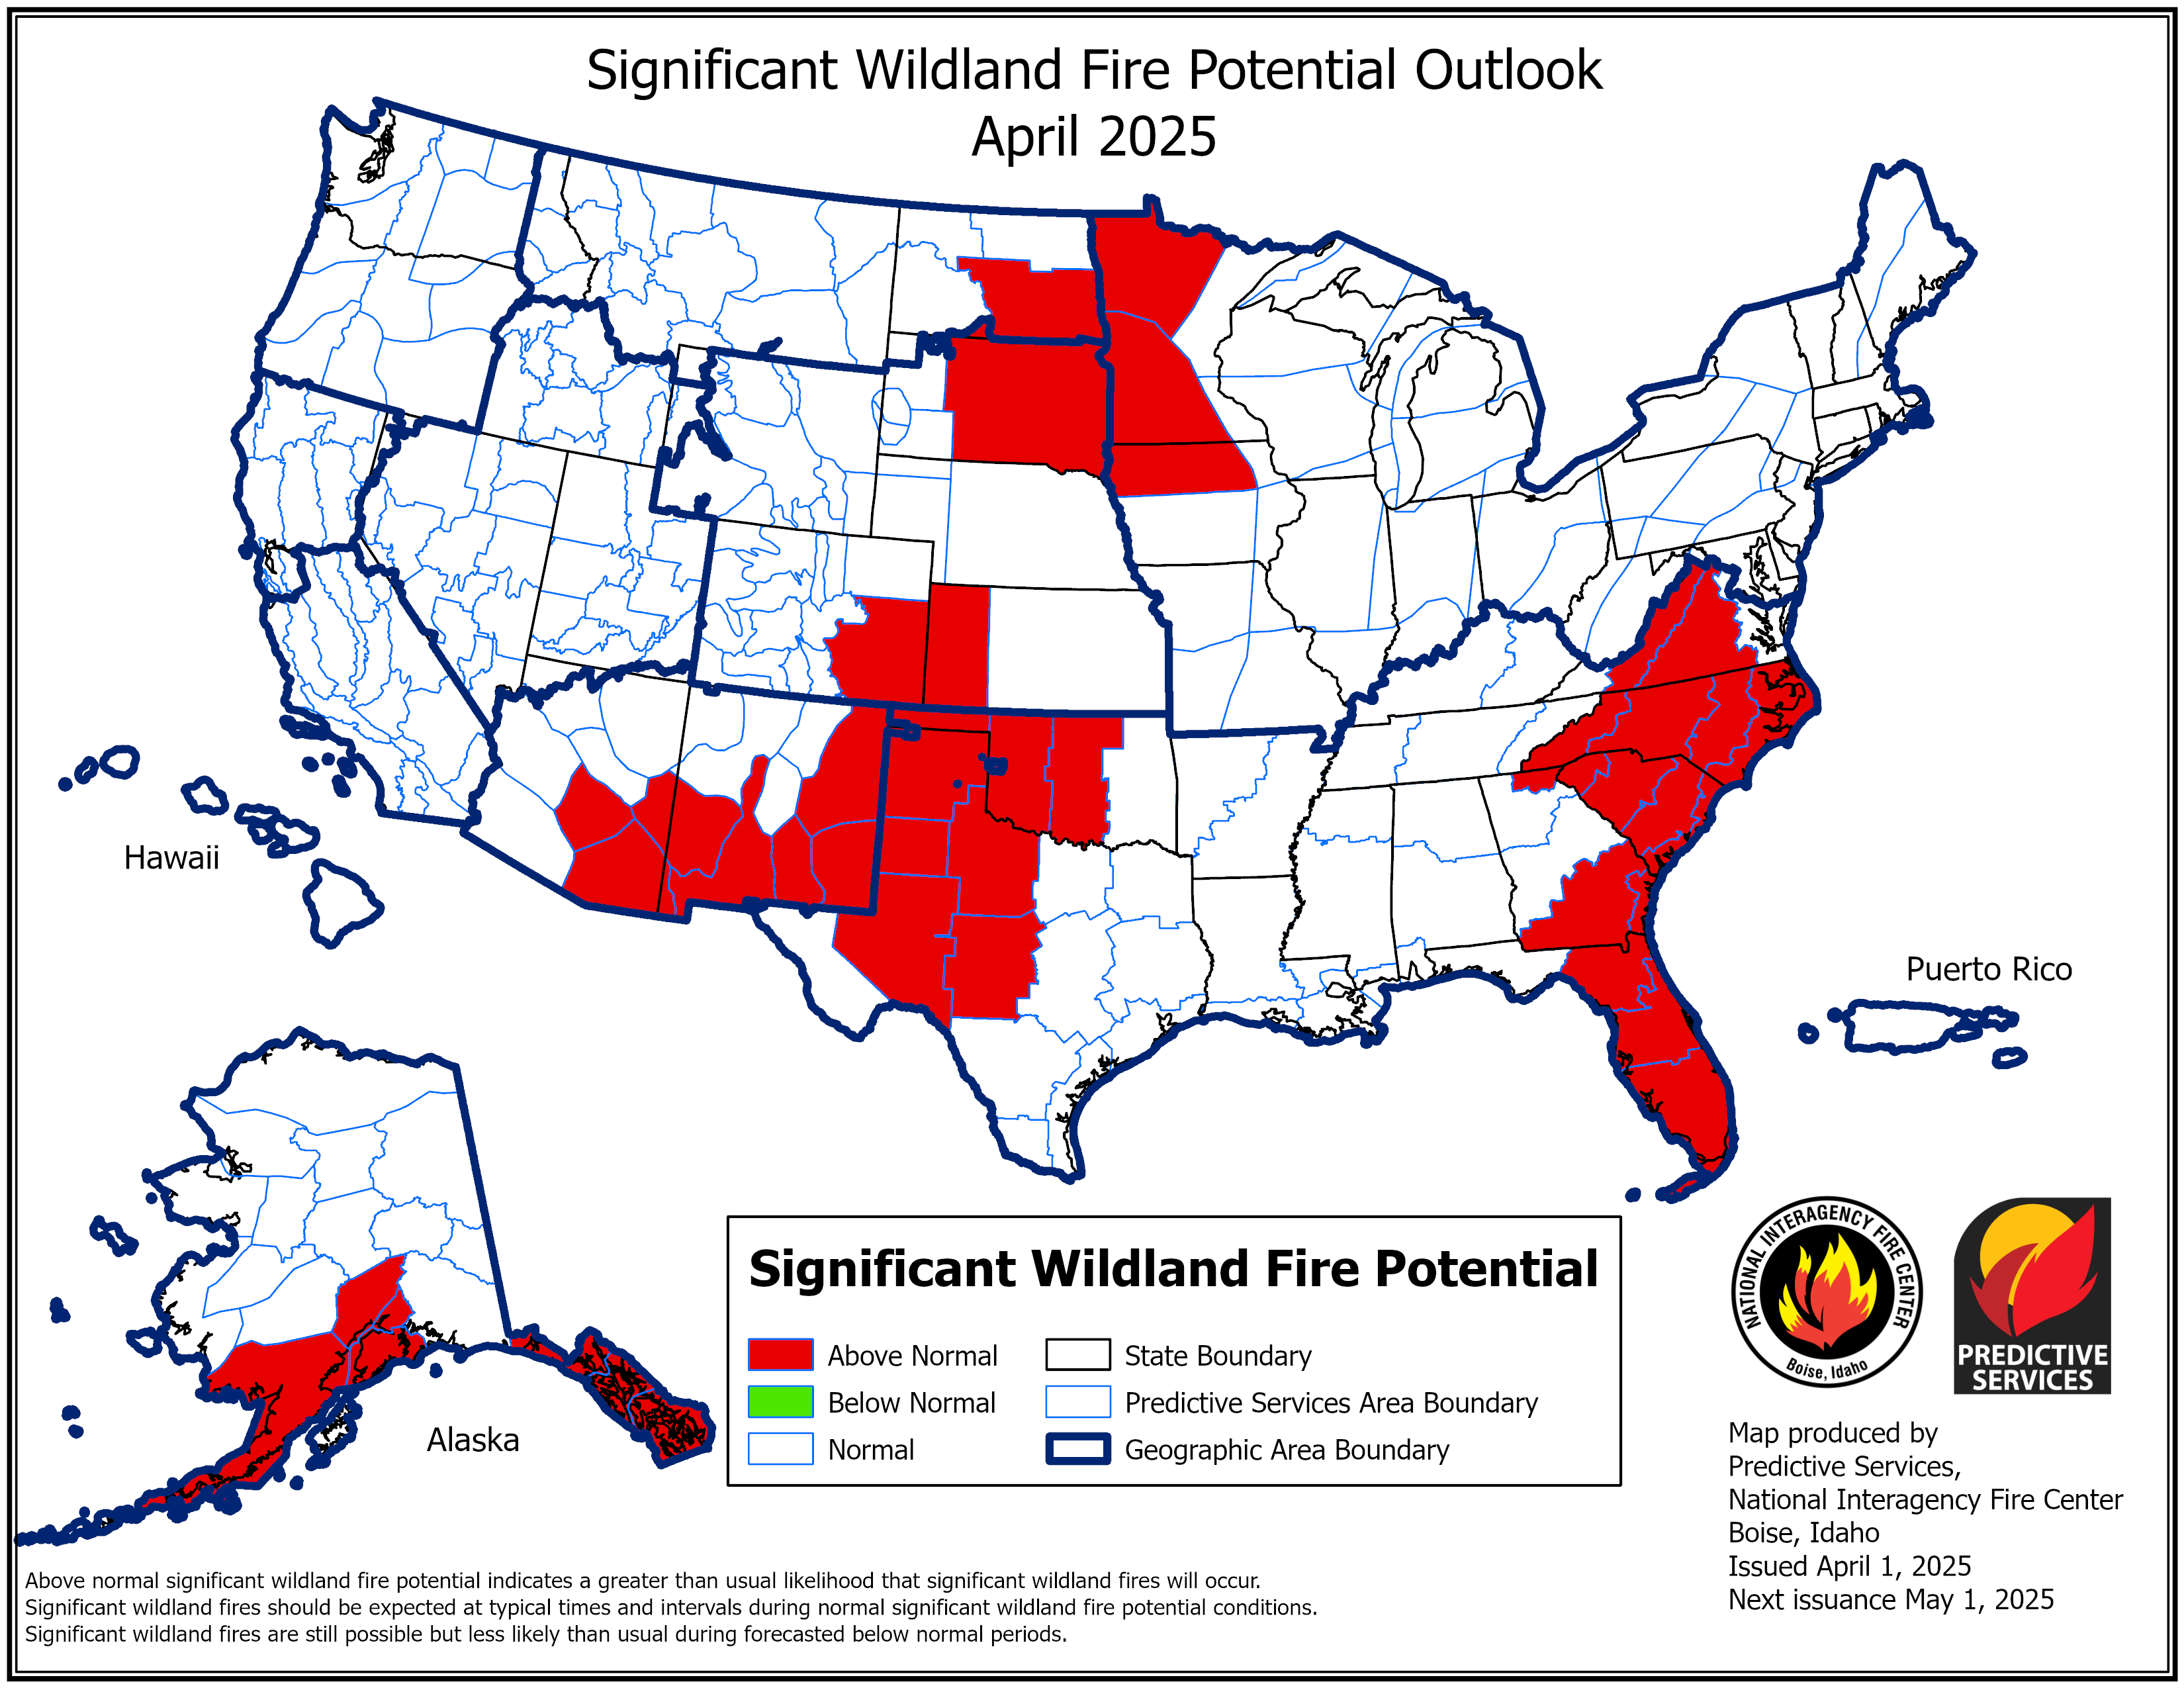
In northern New Mexico, the snowpack is near normal, with the Upper Rio Grande and Upper Canadian basins both currently at 95% of normal SWE. February was a wetter month for Arizona, and wildfire activity in Arizona has remained low into March. The National Interagency Fire Center’s significant wildland fire outlook is above normal for eastern New Mexico for March.
Cascade Range Snow Conditions
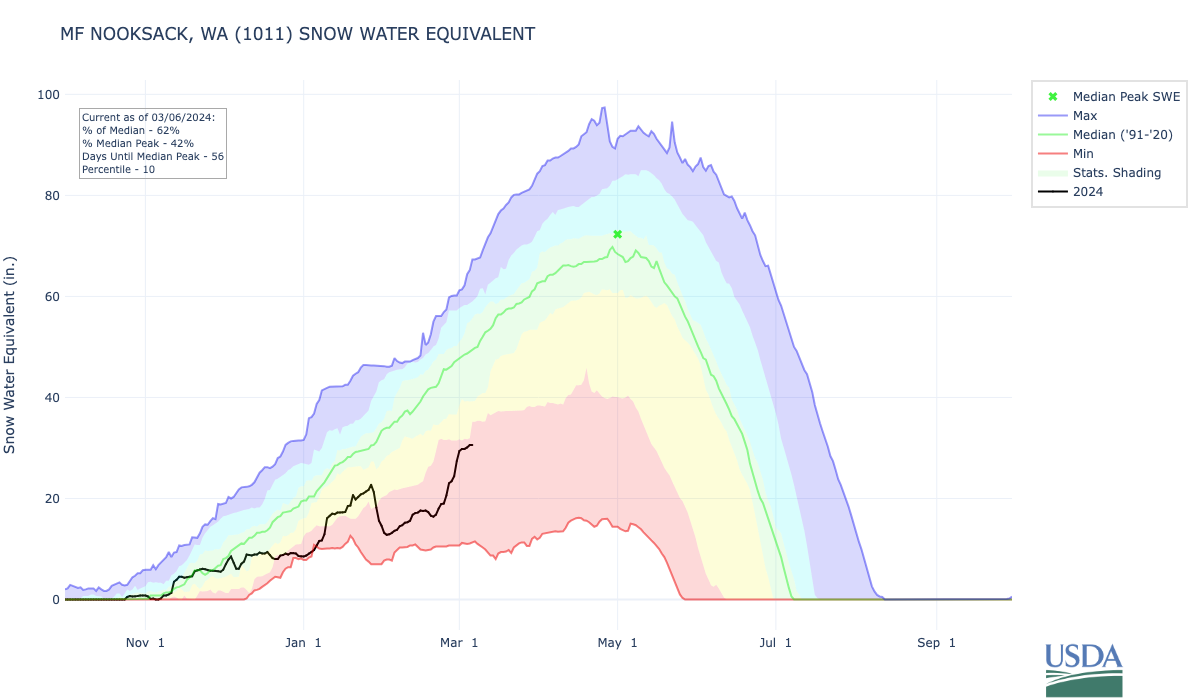
Snow drought is of greatest concern on the west slope of the northern Cascade Range in Washington. SWE in the Puget Sound Basin is the lowest among basins in the Washington Cascade Range, at 65% of normal, and many individual SNOTEL stations are reporting less than 50% of normal. SWE in the Upper Columbia and Yakima basins on the east side of the Cascade Range is 72% and 77% of normal SWE, respectively. The snowpack has been growing slowly over the past month, with a large storm bringing widespread and heavy snowfall during the last week of February and early March. These storms are helpful in improving snow deficits, but the entire region has been fairly dry since the major snow melt event in late January. For example, MF Nooksack SNOTEL, near Mt. Baker in northern Washington, dropped from 22.7 inches of SWE on January 27 to 12.8 inches on February 2. SWE at this site did not surpass 22.7 inches again until February 26. This mid-winter snow melt event will likely have a strong, negative impact on spring and summer water supply and spring runoff.
Overall, snowpack is much higher in the Oregon Cascade Range, with basin-level SWE ranging from 106%–112% of normal. The mid-winter snowmelt event also affected Oregon, but the snowpack in Oregon was greater than in Washington prior to the event. SWE at a few locations near and south of Mt. Hood is below the 30th percentile. Several sites in the Klamath Basin also are in snow drought, with SWE at the Summer Rim SNOTEL in the 2nd percentile.
Water Year Accumulated Snow Water Equivalent at MF Nooksack SNOTEL, Washington
Key Takeaway: A major snow melt event in early January led to dry conditions in the Washington Cascade Range. For example, MF Nooksack SNOTEL dropped from 22.7 inches of SWE on January 27 to 12.8 inches on February 2. Even after heavy snowfall in late February and early March, MF Nooksack SNOTEL is at 62% of median and 42% of median peak as of March 6.
Sierra Nevada and Great Basin Snow Conditions
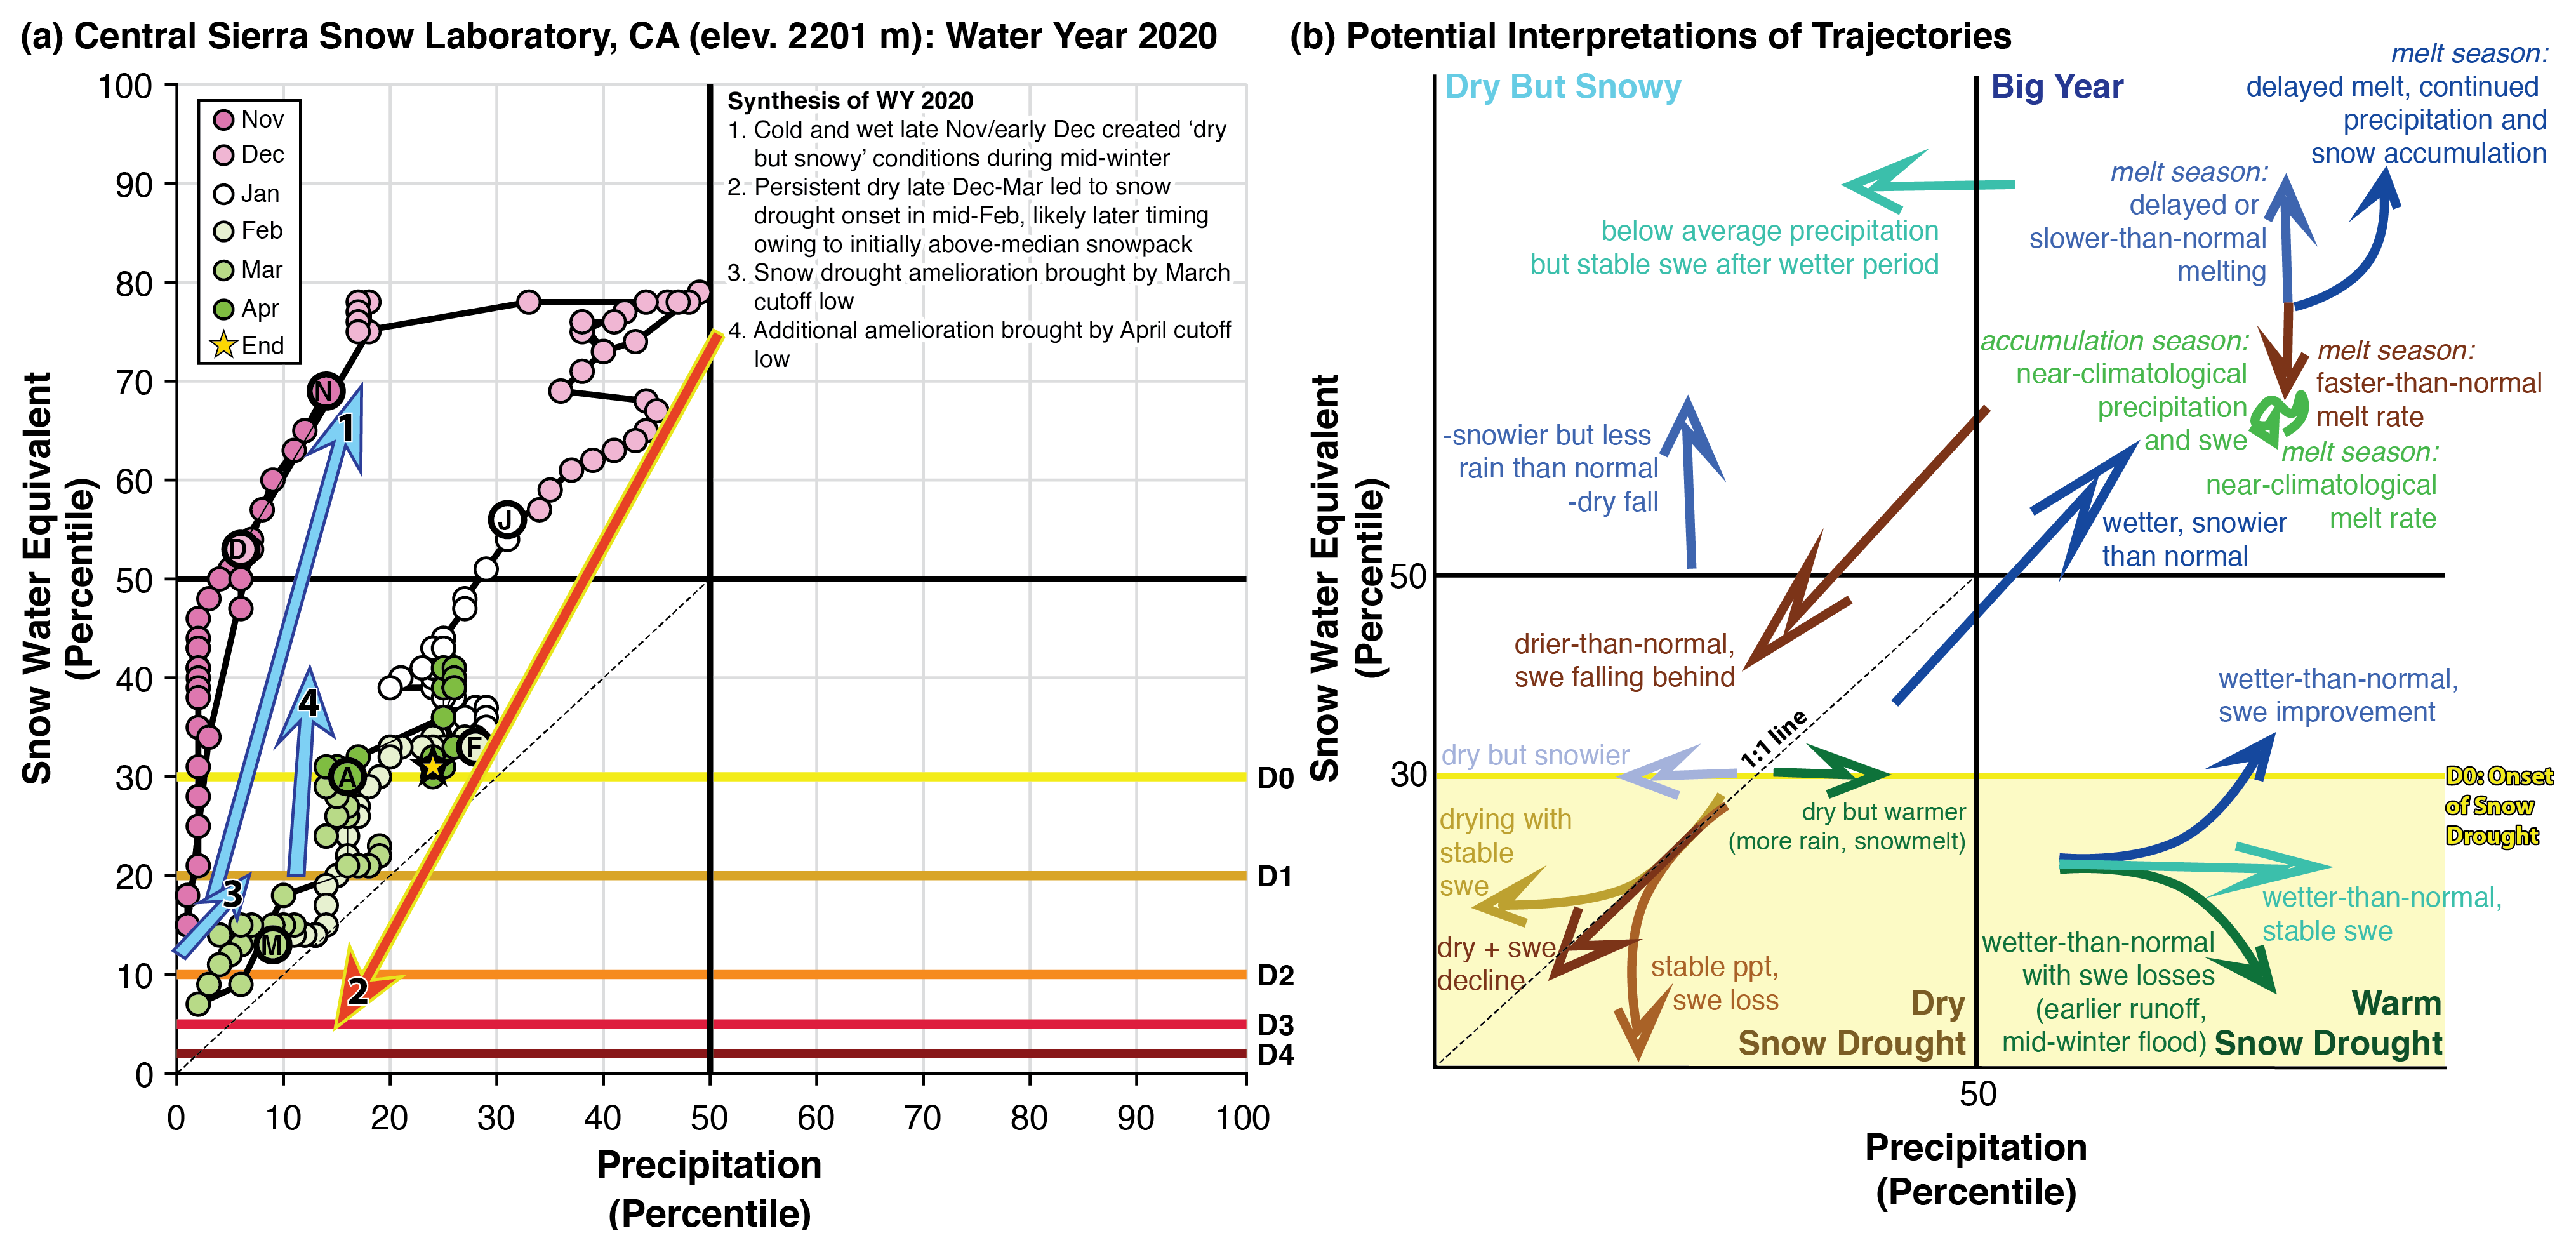
The Sierra Nevada has been making a slow and steady snow drought recovery since early winter. A major 4-day snow storm in early March left the entire region free of snow drought. The Central Sierra Snow Lab, on Donner Pass, reported a 4-day storm total of 75 inches of snow and 10 inches of SWE accumulation (now at 119% of normal SWE); 30 days ago SWE in the same location was 65% of normal. Snowpack is greatest in the northern Sierra Nevada (111% of normal SWE) and slightly lower, although much improved, in the southern Sierra Nevada (94% of normal SWE).
Snowpack throughout the Great Basin remains well above normal, with many locations reporting greater than 150% of normal SWE. SWE in the Humboldt basin, in northern Nevada, currently is 149% of normal for the date and 119% of normal peak for the season, which typically occurs on March 30.
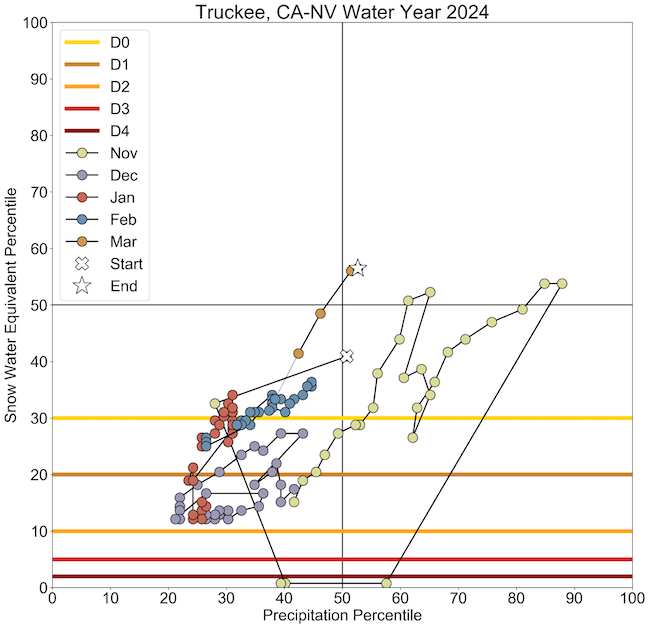
Truckee Basin Snow Drought Phase Diagram
Key Takeaway: This snow drought phase diagram for the Truckee Basin shows dry snow drought beginning in late November, with a steady snow drought recovery since early winter. As of March 4, accumulated precipitation and SWE are both above the 50th percentile.
Alaska Snow Conditions
SNOTEL and snow course observations from early March indicate above-normal snowpack and limited snow drought concerns for most of the monitored portions of Alaska. SWE in southcentral Alaska is much above normal, with the Prince William Sound, Knik Arm, and Kenai Peninsula basins at 142%, 125%, and 117% of normal, respectively. Further northeast into the interior, the Tanana River basin is at 99% of normal SWE.
One area of snow drought concern is southern Southeast Alaska, where precipitation during the past month (and since about early January), as indicated by COOP station observations, has been well below normal. There are no in situ snow observations at high elevations in this region, and mountain web cameras indicate little to no significant snowpack. This snow drought situation could have significant impacts on hydropower and water availability by early summer if no significant mountain snow falls in the next few weeks and spring and early summer are relatively dry and warm.
* Quantifying snow drought values is an ongoing research effort. Here we have used the 30th percentile as a starting point based on partner expertise and research. Get more information on the current definition of snow drought.
For More Information, Please Contact:
Daniel McEvoy
Western Regional Climate Center
Daniel.McEvoy@dri.edu
Amanda Sheffield
NOAA/NIDIS/CIRES California-Nevada Regional Drought Information Coordinator
Amanda.Sheffield@noaa.gov
Britt Parker
NOAA/NIDIS Pacific Northwest Regional Drought Information Coordinator
Britt.Parker@noaa.gov
Gretel Follingstad
NOAA/NIDIS/CIRES Intermountain West Regional Drought Information Coordinator
Gretel.Follingstad@noaa.gov
NIDIS and its partners launched this snow drought effort in 2018 to provide data, maps, and tools for monitoring snow drought and its impacts as well as communicating the status of snow drought across the United States, including Alaska. Thank you to our partners for your continued support of this effort and review of these updates. If you would like to report snow drought impacts, please use the link below. Information collected will be shared with the states affected to help us better understand the short term, long term, and cumulative impacts of snow drought to the citizens and the economy of the regions reliant on snowpack.
Report Your Snow Drought Impacts
Data and Maps | Snow Drought
Research and Learn | Snow Drought

