Rapid Melt Continues to Push Snowpack Below Median Across the West
Key Points
- Tracking snow drought during the snowmelt season is important because the rate and disappearance of snow can impact water supply, soil moisture, and wildfire potential.
- Rapid melt out occurred across Utah, Colorado, and New Mexico, pushing some basins from above-average snowpack to snow drought conditions in under a month, with snow disappearing 1-4 weeks early.
- Washington and Utah declared drought emergencies due to low snowpack, below-normal streamflow forecasts, and long-term drought impacts.
- The Washington State Department of Ecology declared a drought emergency in the Yakima Basin. A drought advisory was issued for several watersheds in the central and northern Cascades of Washington.
- Governor Cox of Utah issued a drought emergency order, declaring a state of emergency in 17 counties.
- Water year peak snow water equivalent (SWE) in the Southwest was much below median, and many locations saw record low snow for the winter season.
- Water supply forecasts for the Colorado Basin declined compared to April 1 projections, likely due to dry conditions, rapid snowmelt, and early melt out.
- The 6-10 day outlook from the Climate Prediction Center favors cooler-than-normal conditions and above-average precipitation across the central Rockies and Southwest, which could help to slow the melt of snow that remains.
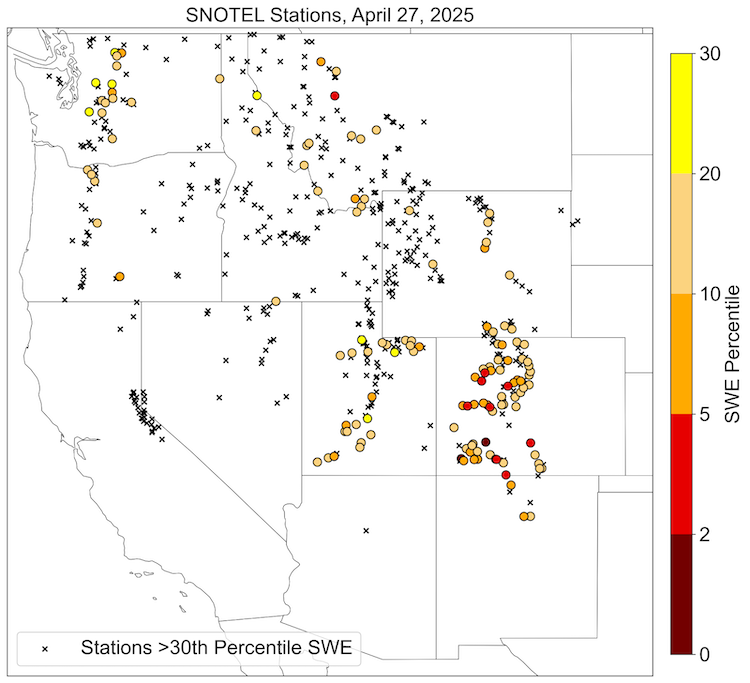
Snow Telemetry (SNOTEL) snow water equivalent (SWE) values for watersheds in the western U.S. as a percentage of the 1991–2020 median. Only stations with at least 20 years of data are included in the station medians. This map is valid as of April 27, 2025.
For an interactive version of this map, please visit NRCS.
Snow Telemetry (SNOTEL) snow water equivalent (SWE) values for watersheds in Alaska as a percentage of the 1991–2020 median. Only stations with at least 20 years of data are included in the station median. Significantly high percentages can occur mathematically when the median is zero or near zero and are typical during early and late snow season. This map is valid as of April 27, 2025. For an interactive version of this map, please visit NRCS
Drought is defined as the lack of precipitation over an extended period of time, usually for a season or more, that results in a water shortage. Changes in precipitation can substantially disrupt crops and livestock, influence the frequency and intensity of severe weather events, and affect the quality and quantity of water available for municipal and industrial use.
Learn MoreSnow drought is a period of abnormally low snowpack for the time of year. Snowpack typically acts as a natural reservoir, providing water throughout the drier summer months. Lack of snowpack storage, or a shift in timing of snowmelt, can be a challenge for drought planning.
Learn MorePeriods of drought can lead to inadequate water supply, threatening the health, safety, and welfare of communities. Streamflow, groundwater, reservoir, and snowpack data are key to monitoring and forecasting water supply.
Learn MoreIn a drought, lower water levels or snowpack can affect the availability of recreational activities and associated tourism, and a resulting loss of revenue can severely impact supply chains and the economy. Drought—as well as negative perceptions of drought, fire bans, or wildfires—may also result in decreased visitations, cancellations in hotel stays, a reduction in booked holidays, or reduced merchandise sales.
Learn MoreDrought is defined as the lack of precipitation over an extended period of time, usually for a season or more, that results in a water shortage. Changes in precipitation can substantially disrupt crops and livestock, influence the frequency and intensity of severe weather events, and affect the quality and quantity of water available for municipal and industrial use.
Learn MoreSnow drought is a period of abnormally low snowpack for the time of year. Snowpack typically acts as a natural reservoir, providing water throughout the drier summer months. Lack of snowpack storage, or a shift in timing of snowmelt, can be a challenge for drought planning.
Learn MorePeriods of drought can lead to inadequate water supply, threatening the health, safety, and welfare of communities. Streamflow, groundwater, reservoir, and snowpack data are key to monitoring and forecasting water supply.
Learn MoreIn a drought, lower water levels or snowpack can affect the availability of recreational activities and associated tourism, and a resulting loss of revenue can severely impact supply chains and the economy. Drought—as well as negative perceptions of drought, fire bans, or wildfires—may also result in decreased visitations, cancellations in hotel stays, a reduction in booked holidays, or reduced merchandise sales.
Learn MorePercent of Median Snow Water Equivalent
< 50% of Median
Current snow water equivalent (SWE) is less than 50% of the median SWE value for this day of the year, compared to historical conditions from 1991–2020.
50%–70% of Median
Current snow water equivalent (SWE) is between 50%–70% of the median SWE value for this day of the year, compared to historical conditions from 1991–2020.
70%–90% of Median
Current snow water equivalent (SWE) is between 70%–90% of the median SWE value for this day of the year, compared to historical conditions from 1991–2020.
90%–110% of Median
Current snow water equivalent (SWE) is between 90%–110% of the median SWE value for this day of the year, compared to historical conditions from 1991–2020.
110%–130% of Median
Current snow water equivalent (SWE) is between 110%–130% of the median SWE value for this day of the year, compared to historical conditions from 1991–2020.
130%–150% of Median
Current snow water equivalent (SWE) is between 130%–150% of the median SWE value for this day of the year, compared to historical conditions from 1991–2020.
>150% of Median
Current snow water equivalent (SWE) is greater than 150% of the median SWE value for this day of the year, compared to historical conditions from 1991–2020.
Percent of Median Snow Water Equivalent
< 50% of Median
Current snow water equivalent (SWE) is less than 50% of the median SWE value for this day of the year, compared to historical conditions from 1991–2020.
50%–70% of Median
Current snow water equivalent (SWE) is between 50%–70% of the median SWE value for this day of the year, compared to historical conditions from 1991–2020.
70%–90% of Median
Current snow water equivalent (SWE) is between 70%–90% of the median SWE value for this day of the year, compared to historical conditions from 1991–2020.
90%–110% of Median
Current snow water equivalent (SWE) is between 90%–110% of the median SWE value for this day of the year, compared to historical conditions from 1991–2020.
110%–130% of Median
Current snow water equivalent (SWE) is between 110%–130% of the median SWE value for this day of the year, compared to historical conditions from 1991–2020.
130%–150% of Median
Current snow water equivalent (SWE) is between 130%–150% of the median SWE value for this day of the year, compared to historical conditions from 1991–2020.
>150% of Median
Current snow water equivalent (SWE) is greater than 150% of the median SWE value for this day of the year, compared to historical conditions from 1991–2020.
Snow Telemetry (SNOTEL) snow water equivalent (SWE) values for watersheds in the western U.S. as a percentage of the 1991–2020 median. Only stations with at least 20 years of data are included in the station medians. This map is valid as of April 27, 2025.
For an interactive version of this map, please visit NRCS.
Snow Telemetry (SNOTEL) snow water equivalent (SWE) values for watersheds in Alaska as a percentage of the 1991–2020 median. Only stations with at least 20 years of data are included in the station median. Significantly high percentages can occur mathematically when the median is zero or near zero and are typical during early and late snow season. This map is valid as of April 27, 2025. For an interactive version of this map, please visit NRCS
View an updated, interactive version of this map from the USDA's Natural Resources Conservation Service. You can also view SWE data on Drought.gov.
View an updated, interactive version of this map from the USDA's Natural Resources Conservation Service. You can also view SWE data on Drought.gov.
Drought is defined as the lack of precipitation over an extended period of time, usually for a season or more, that results in a water shortage. Changes in precipitation can substantially disrupt crops and livestock, influence the frequency and intensity of severe weather events, and affect the quality and quantity of water available for municipal and industrial use.
Learn MoreSnow drought is a period of abnormally low snowpack for the time of year. Snowpack typically acts as a natural reservoir, providing water throughout the drier summer months. Lack of snowpack storage, or a shift in timing of snowmelt, can be a challenge for drought planning.
Learn MorePeriods of drought can lead to inadequate water supply, threatening the health, safety, and welfare of communities. Streamflow, groundwater, reservoir, and snowpack data are key to monitoring and forecasting water supply.
Learn MoreIn a drought, lower water levels or snowpack can affect the availability of recreational activities and associated tourism, and a resulting loss of revenue can severely impact supply chains and the economy. Drought—as well as negative perceptions of drought, fire bans, or wildfires—may also result in decreased visitations, cancellations in hotel stays, a reduction in booked holidays, or reduced merchandise sales.
Learn MoreDrought is defined as the lack of precipitation over an extended period of time, usually for a season or more, that results in a water shortage. Changes in precipitation can substantially disrupt crops and livestock, influence the frequency and intensity of severe weather events, and affect the quality and quantity of water available for municipal and industrial use.
Learn MoreSnow drought is a period of abnormally low snowpack for the time of year. Snowpack typically acts as a natural reservoir, providing water throughout the drier summer months. Lack of snowpack storage, or a shift in timing of snowmelt, can be a challenge for drought planning.
Learn MorePeriods of drought can lead to inadequate water supply, threatening the health, safety, and welfare of communities. Streamflow, groundwater, reservoir, and snowpack data are key to monitoring and forecasting water supply.
Learn MoreIn a drought, lower water levels or snowpack can affect the availability of recreational activities and associated tourism, and a resulting loss of revenue can severely impact supply chains and the economy. Drought—as well as negative perceptions of drought, fire bans, or wildfires—may also result in decreased visitations, cancellations in hotel stays, a reduction in booked holidays, or reduced merchandise sales.
Learn MoreSnow Drought Conditions Summary
This update is based on data available as of Monday, April 28, 2025 at 12:00 a.m. PT. We acknowledge that conditions are evolving.
Current Conditions
Snowpack in most western mountains has passed its peak and is melting. Tracking snow drought throughout the snowmelt season is important because snowmelt timing and rates—along with snow disappearance dates—can impact summer water supply, soil moisture conditions, and the likelihood of wildfires.
After an active weather pattern during the first week of April that led to snowfall and below-normal temperatures, conditions across most of the West were dry and warm during mid- to late April. Snowpack conditions remain poor throughout the Southwest, where snow drought (snow water equivalent, or SWE, below the 20th percentile) persisted throughout the water year and water year peak SWE was much below median.
Rapid snowmelt occurred throughout April in the central and northern portions of Utah and Colorado, and SWE is now much below median, despite peak SWE being near to above median about one month ago. Snow completely melted at many lower-elevation Snow Telemetry (SNOTEL) stations throughout the West, with snow disappearing 1-4 weeks early in parts of Utah, Colorado, and New Mexico. The northern Washington Cascade Range also has much-below-median SWE, and snow drought conditions persisted throughout the season.
Snow Drought Conditions Present Across Parts of Rocky Mountains and Northern Cascades
Spring Heat Wave Rapidly Melts Snow

Looking Ahead
Over the next 1-2 weeks, several periods of light-to-moderate precipitation are possible for much of the West. There are no signals for strong storms at the moment, but some snow could accumulate in the higher elevations of the Cascades, Sierra Nevada, and Rocky Mountains.
The 6-10 day outlook from the Climate Prediction Center favors below-normal temperatures for Arizona, New Mexico, and southern parts of California, Nevada, Utah, and Colorado, as well as above-normal temperatures for the northern Rockies. Above-normal precipitation is favored for nearly all of the West, with the highest chances (50%-60%) in the Four Corners region. The precipitation and cool temperatures could help to slow snowmelt (and possibly add small amounts of SWE to high elevations), but major snowpack increases are unlikely. Such conditions could help mitigate very short-term drought impacts in Arizona and New Mexico. However, extreme long-term drought, driven by low seasonal snowpack and reduced water supply, is likely to intensify during late spring and summer.
Most recent median water supply forecasts have declined in the Colorado River Basin compared to the April 1 forecasts. This is likely due to dry conditions, rapid snowmelt, and early melt out. Most forecast points in the Upper Colorado Basin indicate 50%-75% of median seasonal runoff, with some locations less than 50%. The northern reaches of the Green River are one exception, where flows are forecast to be 75%-90% of normal. Most forecast points in the Rio Grande Basin and the Salt and Verde Basins in Arizona indicate stark forecasts with less than 25% of median flows.
Jump to conditions for your region:
- Colorado, Idaho, Montana, Utah, Wyoming (Rocky Mountains) Snow Conditions
- Arizona and New Mexico Snow Conditions
- Oregon and Washington Snow Conditions
- California and Nevada Snow Conditions
- Alaska Snow Conditions
Rocky Mountain Snow Conditions (Colorado, Idaho, Montana, Utah, Wyoming)
Northern Rockies
Snowpack is variable across the region, but most of the higher elevations currently have about 80%-100% median snow water equivalent (SWE). Pockets of snow drought are present throughout the region, but are mostly confined to lower elevations. Snow has completely melted 1–3 weeks early at some lower elevations.
The mountains in west-central Idaho and the Little Belt Mountains in central Montana currently have much-above-median snowpack. Aggregated to the hydrologic unit code (HUC) 6 basin scale, the Marias Basin in northwestern Montana currently has the lowest snowpack in the region at 74% of median SWE. The Fort Peck Lake Basin in central Montana has the highest at 117% of median SWE.
Central Rockies
Persistent snow drought in southern portions of Utah and Colorado and a rapid transition to late-season snow drought in much of northern Utah and Colorado have led to low streamflow forecasts. As a result, Governor Cox of Utah issued a drought emergency order, declaring a state of emergency in 17 counties.
The largest change in the central Rocky Mountain region over the past month was a rapid loss of snow and drop in percentage of median snow water equivalent (SWE) in central and northern Utah and Colorado. Dry, warm conditions drove a rapid decrease in SWE after the first week of April. For example, the Colorado Headwaters Basin was at 95% of median SWE on April 1 and is currently at 64% of median. SWE in the Jordan Basin (which includes the Wasatch Mountains in northern Utah) decreased from 106% of normal SWE on April 1 to 65% of normal on April 28. The most substantial and rapid snowmelt period occurred from April 10–17 and was most widespread in Colorado, where many SNOTEL stations saw record snowmelt.
Snow conditions remain dire in southern portions of the upper and lower Colorado River Basin. SWE is currently below median in southern portions of the basin, including in the Upper San Juan (31% of median), Gunnison (36%), Upper Colorado-Dirty Devil (22%), and Lower Colorado-Lake Mead (28%) Basins.
The Upper Colorado Basin as a whole (130 SNOTEL stations) is now at 62% of median SWE. As of April 28, the April–July forecast for runoff into Lake Powell is 3.5 million acre-feet (MAF), or 56% of the 30-year average. However, this forecast also indicates seasonal runoff could range from as low as approximately 3.0 MAF or as high as approximately 5.1 MAF.
Spring Heat Wave Melts Out Snow Early

Arizona and New Mexico Snow Conditions
Many Arizona locations had little to no snowpack during the first half of the season and only began building snowpack in March. Currently, melt out has occurred across most SNOTEL stations in Arizona. Snowslide Canyon, north of Flagstaff, is the only station where any meaningful snowpack remains, reporting 2.5 inches of SWE (48% of median). Peak SWE at central Arizona SNOTEL sites occurred a few days early in mid-March and ranged from 19%-89% of median. In east-central Arizona, conditions were generally drier than in the central mountains, with peak SWE ranging from 13%-31% of median at SNOTEL stations. North-central Arizona received above-normal precipitation in March and April. April precipitation did not contribute much to snowpack but improved short-term drought impacts by increasing soil moisture and temporarily improving rangeland conditions.
In northern New Mexico, SNOTEL stations in the southern extent of the San Juan and Sangre de Cristo Mountains are reporting little to no snow, and snow melted out much earlier than normal. The Upper Rio Grande Basin is currently reporting 12% of median SWE and is on track to melt 3-4 weeks early. Many stations in northern New Mexico that typically have reliable mid-winter snowpack have lost all snow 3-4 weeks early. Snow melt at the Santa Fe SNOTEL station occurred on April 14, 47 days earlier than the median—the earliest melt out on record there. For reference, the median SWE value for April 27 at this location is 14 inches.
Oregon and Washington Snow Conditions
In early April, the Washington State Department of Ecology declared a drought emergency in the Yakima Basin. The drought emergency was due to both the low snowpack this year and the compounding impacts of drought conditions in 2023 and 2024. A drought advisory is also in place in the central and northern Cascades of Washington (including the Seattle area), as drought may develop due to low snowpack in other watersheds.
Snow drought conditions persist in the northern half of the Washington Cascade Range and recently developed in northeast Washington. Snowpack deficits developed early in the season in central and northern Washington mostly due to below-normal seasonal precipitation. The Upper Columbia, Puget Sound, and Yakima Basins are currently at 61%, 71%, and 73% of median snow water equivalent (SWE), respectively. Rapid snowmelt in northeast Washington has led to much-below-median SWE and early melt out at some locations. For example, Sentinel Butte SNOTEL station had 133% of median SWE on April 1 but lost all snow on April 28, 7 days earlier than normal.
Several SNOTEL sites in the central and southern Oregon Cascade Range reported record or near-record snowmelt between April 10 and 17. Snow melted at lower elevation stations 4-14 days early. Basin-scale snowpack is still above median in the southern Oregon Cascade Range and the Steens and Blue Mountains, but the substantial snowpack melted quickly in April.
California and Nevada Snow Conditions
Northern California snowpack fell below median due to rapid snow melt. California Department of Water Resources data indicate that the northern, central, and southern regions of the state are currently at 84%, 77%, and 53% of median snow water equivalent (SWE). What SWE the region gained with early April snowfall was offset by melt.
On the east side of the Sierra Nevada, SNOTEL stations in the Truckee, Carson, and Walker Basins are currently reporting 95%, 85%, and 85% of median SWE, respectively. SWE at individual stations varies, with some locations still reporting above-median SWE, mostly at higher elevations in central and northern California. Snow at some low-elevation stations in the Sierra Nevada melted completely. Snowmelt is generally about 1 week early in the central Sierra Nevada and Tahoe Basin, and 2-3 weeks early on the west slope of the southern Sierra Nevada.
Rapid snowmelt also impacted northeast Nevada, with SWE at many locations falling below median in late April after peaking above median. The Humboldt Basin was at 134% of median SWE on April 1 and is currently at 90% of median. Locations in east-central Nevada are currently reporting low snowpack, with Berry Creek, Wheeler Peak, and Ward Mountain (all along the eastern Nevada Highway 50 corridor) at 83%, 9%, and 8% of median SWE, respectively. Wheeler Peak is reporting the lowest SWE on record, with data since 2011.
Alaska Snow Conditions
Most SNOTEL stations in southcentral Alaska are reporting below-median snow water equivalent (SWE), with much greater snowpack deficits at lower elevations. For example, the Indiana Pass SNOTEL station (2,400-foot elevation) is reporting 114% of median SWE, whereas Mt. Alyeska (1,500-foot elevation) is reporting 55% of median SWE. Snow at the Susitna Valley SNOTEL station has completely melted, with melt out 13 days earlier than the median date.
Snowpack and SWE observations are limited in southeast Alaska, but the Long Lake SNOTEL station reports below-median SWE (57% of median). Based on webcams, there is little or no snow remaining in the mountains in southern areas of southeast Alaska. The U.S. Drought Monitor classifies most of the Panhandle as Abnormally Dry (D0) based on insights from local and regional experts. SNOTEL stations north and east of Fairbanks are currently reporting SWE above 150% of median.
* Quantifying snow drought values is an ongoing research effort. Here we have used the 20th percentile as a starting point based on partner expertise and research. Get more information on the current definition of snow drought. Note that reporting of SWE by Snow Telemetry (SNOTEL) stations may be unavailable or delayed due to technical, weather or other issues, which may affect snow drought depiction in this update.
For More Information, Please Contact:
Daniel McEvoy
Western Regional Climate Center
Daniel.McEvoy@dri.edu
Jason Gerlich
CIRES/NOAA/NIDIS Pacific Northwest and Missouri River Basin Regional Drought Information Coordinator
Jason.Gerlich@noaa.gov
Amanda Sheffield
CIRES/NOAA/NIDIS California-Nevada Regional Drought Information Coordinator
Amanda.Sheffield@noaa.gov
NIDIS and its partners launched this snow drought effort in 2018 to provide data, maps, and tools for monitoring snow drought and its impacts as well as communicating the status of snow drought across the United States, including Alaska. Thank you to our partners for your continued support of this effort and review of these updates. If you would like to report snow drought impacts, please use the link below. Information collected will be shared with the states affected to help us better understand the short term, long term, and cumulative impacts of snow drought to the citizens and the economy of the regions reliant on snowpack.
Report Your Snow Drought Impacts
Data and Maps | Snow Drought
Research and Learn | Snow Drought