April storms boost late-season snowpack in the Northwest and Northern Rockies while snow drought worsens in the Southwest
Key Points
- Spatial extent of snow drought across the West has decreased substantially over the past month due to a series of cold April storms; however, peak snowpack during the water year was well-below normal in many locations.
- The Pacific Northwest, northern Rockies, and central and northern Sierra Nevada benefitted from recent storms while snow drought conditions became more severe in the southern Sierra Nevada, southern Great Basin, and most of the Colorado River Basin, which were south of the storm track in April.
- Several major dust-on-snow events accelerated snow melt in the southern tier of the West.
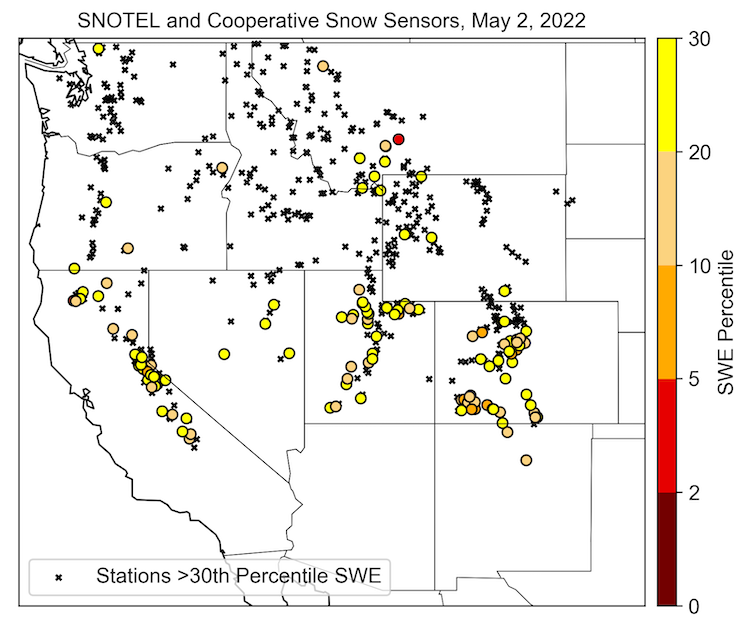
Snow Telemetry (SNOTEL) snow water equivalent (SWE) values for watersheds in the western U.S. as a percent of the USDA Natural Resources Conservation Service (NRCS) 1991–2020 median. Only stations with at least 20 years of data are included in the station averages.
The SWE percent of normal represents the current SWE at selected SNOTEL stations in or near the basin compared to the average value for those stations on this day. This map is valid as of May 2, 2022.
For an interactive version of this map, please visit NRCS.
Snow Telemetry (SNOTEL) and snow course snow water equivalent (SWE) values in watersheds in Alaska as a percent of the USDA Natural Resources Conservation Service (NRCS) 1991–2020 median. Only stations with at least 20 years of data are included in the station averages.
The SWE percent of normal represents the current SWE at selected SNOTEL and snow course stations in or near the basin compared to the average value for those sites on this day. This map is valid as of the end of May 1, 2022.
For an interactive version of this map, please visit NRCS.
SWE Percent of NRCS 1991-2020 Median
Snow Telemetry (SNOTEL) snow water equivalent (SWE) values for watersheds in the western U.S. as a percent of the USDA Natural Resources Conservation Service (NRCS) 1991–2020 median. Only stations with at least 20 years of data are included in the station averages.
The SWE percent of normal represents the current SWE at selected SNOTEL stations in or near the basin compared to the average value for those stations on this day. This map is valid as of May 2, 2022.
For an interactive version of this map, please visit NRCS.
Snow Telemetry (SNOTEL) and snow course snow water equivalent (SWE) values in watersheds in Alaska as a percent of the USDA Natural Resources Conservation Service (NRCS) 1991–2020 median. Only stations with at least 20 years of data are included in the station averages.
The SWE percent of normal represents the current SWE at selected SNOTEL and snow course stations in or near the basin compared to the average value for those sites on this day. This map is valid as of the end of May 1, 2022.
For an interactive version of this map, please visit NRCS.
Snow Drought Update for May 5, 2022
The spatial extent of snow drought across the West, based on the percent of median snow water equivalent (SWE) from early May, has decreased substantially over the past month due to a series of cold April storms. It should be noted that by early May most of the SNOTEL sites in the West are already into the melt season, and the percent of median SWE for the date does not necessarily reflect peak SWE. The greatest improvements from these storms were in the Pacific Northwest and northern Rockies, where SWE is now near normal or above normal.
Many of the SNOTEL sites in Oregon and Washington recorded record high April precipitation, and the region’s temperatures were well below normal, which translated to large gains in the snowpack. Southern Idaho, which is facing significant water supply shortages on April 1, saw a modest rise in water supply forecast due to precipitation and cool weather slowing the melt-out of the snowpack. While most of southern Idaho had precipitation rates just below average in April, the Weiser, Payette, Boise, Big Wood, and Snake River basins all received between 135% and 146% of normal precipitation in April. Record high April SWE increases are indicative of the slow melt-out and increased, at some sites record high, precipitation. This wet and cool April was not nearly enough to overcome long-term precipitation deficits and low snowpack and early rapid melt-out in several areas, which continue to drive persistent drought conditions throughout much of Oregon and Idaho. The early melt-out in combination with snowpack peaking at levels significantly below the 1991–2020 median peak have resulted in an unfavorable outlook for water supply availability during the summer.
The central and northern Sierra Nevada also benefited from April storms, with more snowfall accumulation in a two-week period in April than in all of January through March. Although SWE increased in the Sierra Nevada, the region did not recover from snow drought due to the remarkably dry January through early April. SWE in the Sierra Nevada is at about 30%–60% of normal as of the beginning of May.
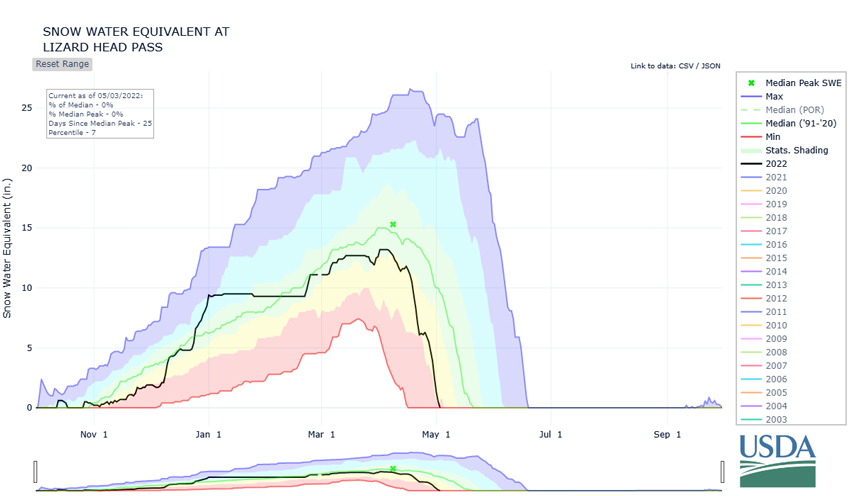
Snow drought conditions became more severe in the southern Sierra Nevada, southern Great Basin, and most of the Colorado River Basin; the storm track in April remained too far north to impact these regions. Snowpack in Southwest Colorado is particularly low, with the Rio Grande Headwaters, Upper San Juan, and Upper Colorado-Dolores basins at 34%, 47%, and 45% of normal SWE, respectively. April SWE declines at several sites in this region were the greatest on record. Lizard Head Pass SNOTEL, to the southwest of Telluride, Colorado at 10,193-foot elevation, lost 10.7 inches of SWE in April and melted out completely on May 3, which is nearly three weeks earlier than normal. Precipitation in the region was well below normal, but several major winter and spring dust-on-snow events, when blowing dust is transported and deposited on the snowpack surface, also occurred. These events accelerate snow melt once the dust layers are exposed and accumulate on the surface by reducing the ability of the snow to reflect solar radiation.
Snow drought in Alaska continues to be minimal, with SWE well above normal across most of the state (where observations exist). SWE at only three of the 69 SNOTEL and snow course sites on May 1 was below 100% of median. The lowest, 79% of median, was observed at the Portage Valley snow course in the Kenai Peninsula. SWE in the Tanana River and Copper River Basins is at record high levels.
Stations with SWE Below the 30th Percentile
Water Year Accumulated Snow Water Equivalent at Lizard Head Pass
* When calculating the percentage of station SWE below the May 2 median, stations where the median SWE value for the date is zero were not included.
** Quantifying snow drought values is an ongoing research effort. Here we have used the 30th percentile as a starting point based on partner expertise. Get more information on the current definition of snow drought here.
For More Information, Please Contact:
Daniel McEvoy
Western Regional Climate Center
Daniel.McEvoy@dri.edu
Amanda Sheffield
NOAA/NIDIS California-Nevada Regional Drought Information Coordinator
Amanda.Sheffield@noaa.gov
Britt Parker
NOAA/NIDIS Pacific Northwest and Missouri River Basin Regional Drought Information Coordinator
Britt.Parker@noaa.gov
NIDIS and its partners launched this snow drought effort in 2018 to provide data, maps, and tools for monitoring snow drought and its impacts as well as communicating the status of snow drought across the United States, including Alaska. Thank you to our partners for your continued support of this effort and review of these updates. If you would like to report snow drought impacts, please use the link below. Information collected will be shared with the states affected to help us better understand the short term, long term, and cumulative impacts of snow drought to the citizens and the economy of the regions reliant on snowpack.
Report Your Snow Drought Impacts Data and Maps | Snow Drought Research and Learn | Snow Drought

