U.S. flag

An official website of the United States government

The contiguous United States experienced its warmest June-August on record in 2026, accompanied by below-normal precipitation and above-normal temperatures that sustained widespread drought, now covering nearly half the country. These extreme conditions fueled a destructive wildfire season that sent unhealthy levels of smoke streaming through large parts of the United States. Major western reservoirs like Lake Mead and Lake Powell hit all-time record lows as they continued to decline. 

Looking ahead, a potentially historically strong El Niño event is projected to continue developing through the fall and winter, which typically increases chances of wetter than normal conditions in the Southern U.S. and warmer than normal conditions in the Northern U.S. Flash drought continues to worsen in the Southern Plains and Lower Mississippi River Basin.

Warmest Summer on Record

The average temperature for meteorological summer (June–August) 2026 was the warmest for the contiguous United States (CONUS) in the 132-year record, exceeding the previous records, set in 1936 and 2021, by 0.4°F. 
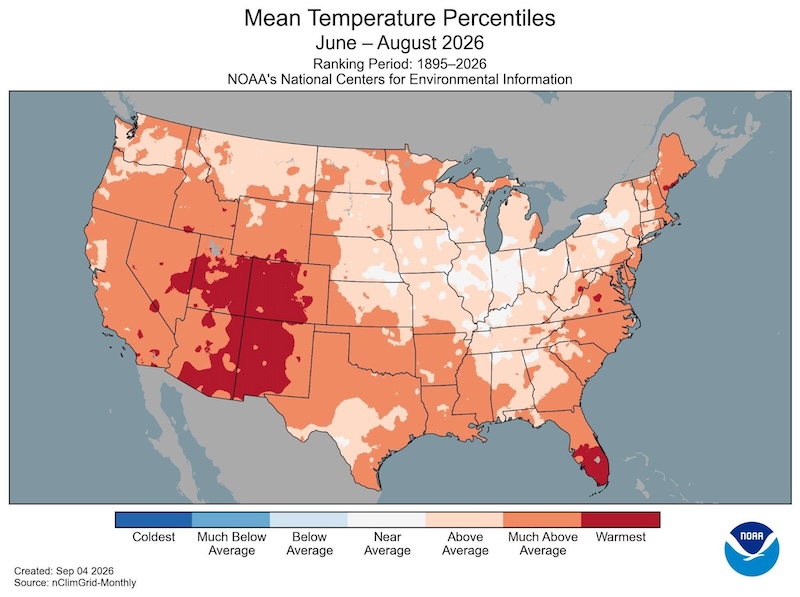
A national map of the contiguous United States displays NOAA mean temperature percentiles for June through August 2026, ranking temperatures relative to the 1895–2026 historical record. The data shows widespread above-average temperatures across most of the country, with extreme heat concentrated in the Southwest and Four Corners region—encompassing Utah, Colorado, Arizona, New Mexico, and extending into Texas—where conditions ranked as much above average to warmest on record. Southern Florida also recorded warmest-on-record temperatures.
Mean temperature percentiles for CONUS from June-August 2026. The map displays red colors indicating above-normal temperatures. Cooler than normal areas are represented by shades of blue. Data Source: NOAA’s National Centers of Environmental Information. 

Precipitation Normal to Below Normal for Most of CONUS

The CONUS received 8.11 inches of precipitation during summer, 0.21 inch below the 20th-century average, ranking in the driest third of the record. Alaska’s June–August precipitation averaged 10.67 inches, 0.67 inch above average, also ranking in the middle third of the record. June–August precipitation averaged 28.24 inches across Hawaii, 14.83 inches above average, ranking as the second-wettest summer on record.
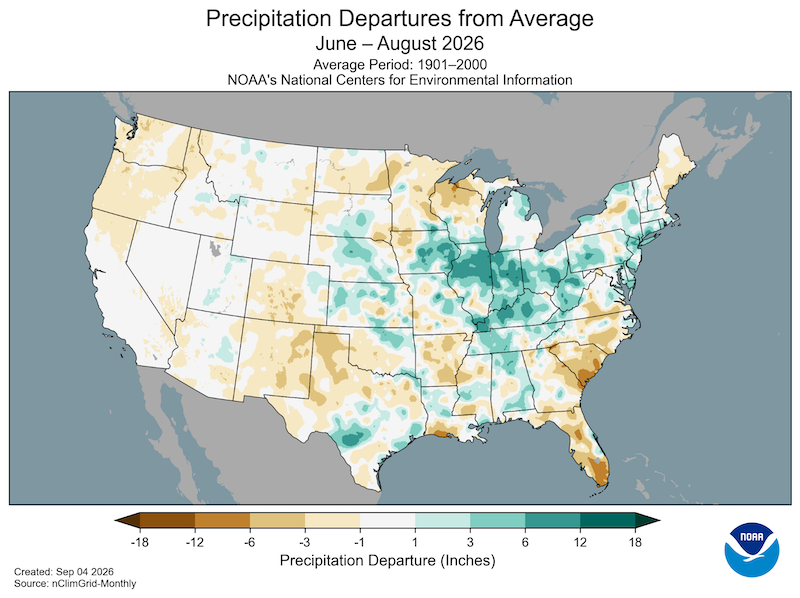
Map of the contiguous United States showing NOAA precipitation departures from average for June through August 2026, compared to the 1901–2000 historical baseline. Widespread above-average precipitation, with surpluses ranging from 1 to over 18 inches, spans across much of the Central Plains, Midwest, Great Lakes, and parts of Texas, Oklahoma, and the Mid-Atlantic. In contrast, below-average precipitation extends across the Pacific Northwest, Northern Rockies, Southwest, Deep South, and Southeast, with the most notable deficits of 3 to over 18 inches concentrated in coastal Florida, southern Georgia, and coastal North Carolina.
Precipitation departure from average for CONUS from June-August 2026. The map displays green colors indicating above-normal precipitation. Drier than normal areas are represented by shades of brown. Data Source: NOAA’s National Centers of Environmental Information. 

High Evaporative Demand Across Much of CONUS

Evaporative demand is a measure of the potential loss of water from the land surface due to atmospheric factors. Above-normal temperatures, clear skies, high wind speeds, and low humidity increase evaporative demand, which leads to quicker drying at the surface. Reduced soil moisture leaves less water available for plants. Between June–August 2026, the Evaporative Demand Drought Index (EDDI) showed that almost every CONUS state had high evaporative demand, especially Colorado. Almost none of CONUS had low evaporative demand between June-August 2026, even regions such as the Ohio River Basin, which received more precipitation than normal. 
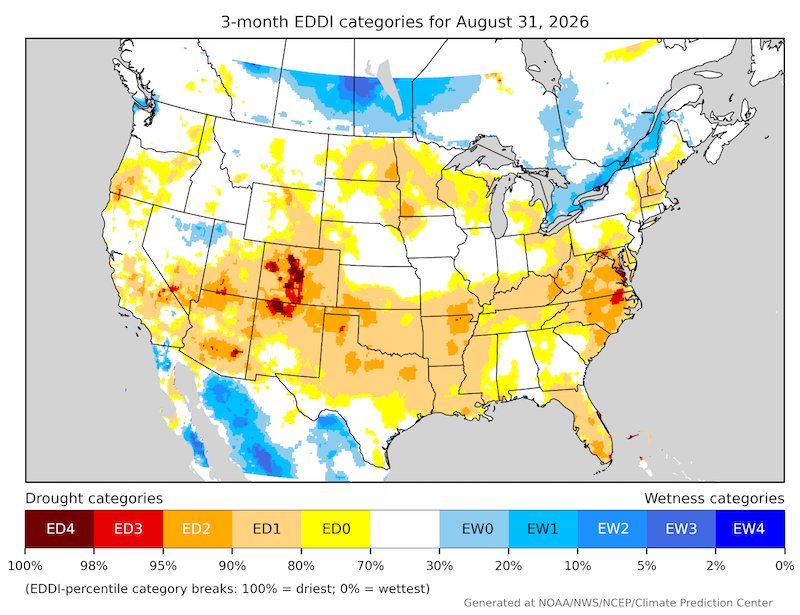
From June to August 2026, almost every state in the Lower 48 had at least some areas of high evaporative demand. Evaporative demand was highest in Colorado.
The Evaporative Demand Drought Index (EDDI) is a drought monitoring tool that shows the anomaly in daily evaporative demand over a given period of time—in this case, June-August 2026. Evaporative demand is the atmospheric influence on the drying of the landscape, or "the thirst of the atmosphere." Data Source: NOAA Climate Prediction Center.

Drought Coverage Persists

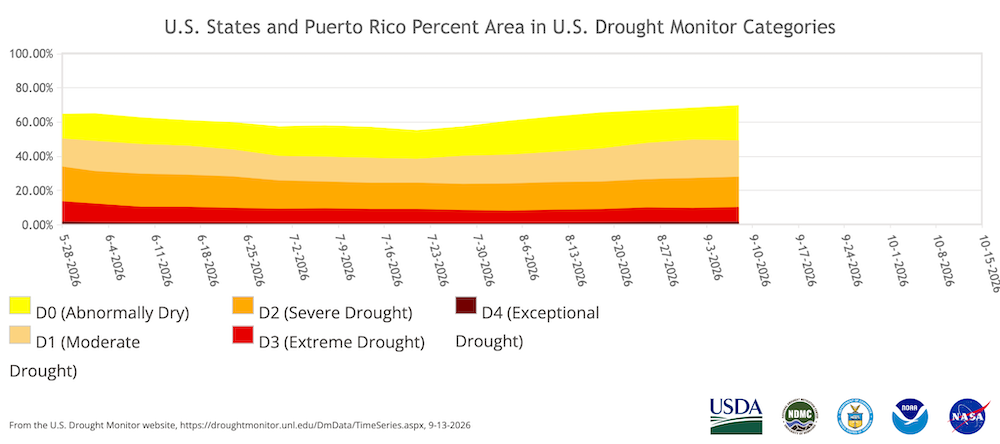
Drought coverage was remarkably consistent through the summer, according to the U.S. Drought Monitor. The first U.S. Drought Monitor from the summer, from June 2, 2026, showed drought coverage at 48.8% for the U.S. The last U.S. Drought Monitor of the summer, from August 25, 2026, shows drought at 47.6%. In between, drought coverage dropped to 38.3% on July 21, 2026. While mid-summer storms improved conditions in parts of the Lower Midwest and Southeast, flash drought worsened conditions in the Northern and Southern Plains. 
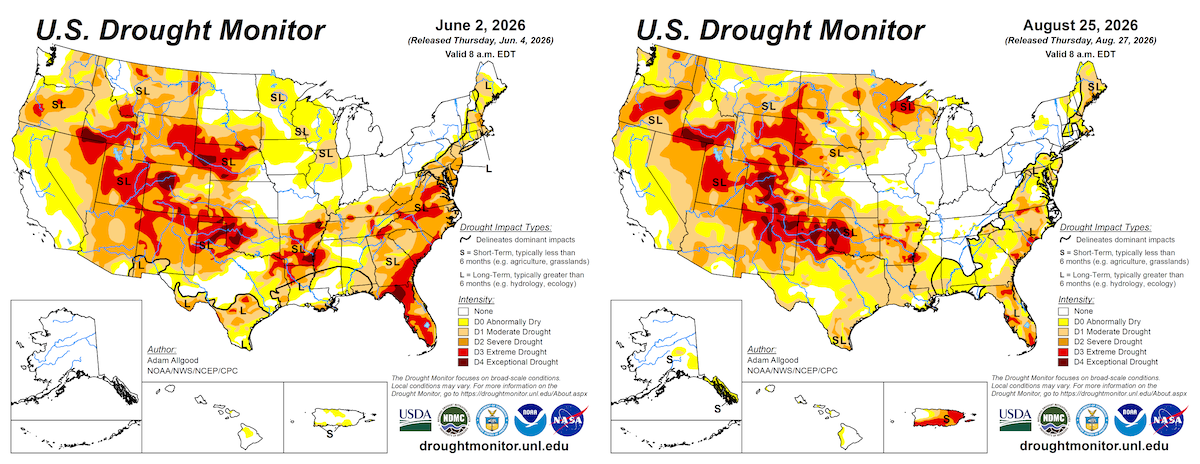
Two U.S. Drought Monitor maps side by side, from June 2 and August 25, 2026. United States drought coverage started at 48.8% of the U.S. in June. By August 25, drought covered 47.6%. While some areas of drought shifted over the summer, overall drought coverage remained similar.
Timeseries showing U.S. Drought Monitor drought coverage in 2026, shown as a percentage of land area covered. Drought persisted throughout summer 2026.
U.S. Drought Monitor (USDM) conditions across the United States for June-August 2026. The map at the top left shows USDM conditions for June 2, 2026. The map at the top right shows USDM conditions for August 25, 2026. The time series at the bottom shows USDM conditions from May 26, 2026 to September 3, 2026. The map uses five classifications: Abnormally Dry (D0), showing areas that may be going into or are coming out of drought, and four levels of drought (D1–D4). Source: National Drought Mitigation Center, NOAA, and USDA.

Extreme Heat and Dryness Set the Stage for Destructive Wildfires and Unhealthy Smoke Levels

As of September 15, 2026, 55,419 fires have burned more than 8.4 million acres across the United States. This is 125% of the 10-year average number of fires and 147% of the 10-year average acres burned for this date. The largest and most destructive wildfires during summer 2026 burned in eastern Washington and Oregon. The Spokane Complex Fire in eastern Washington damaged or destroyed over 800 structures including hundreds of homes. The Big Grass Fire in eastern Oregon is the largest wildfire in modern Oregon history, burning 578,637 acres.
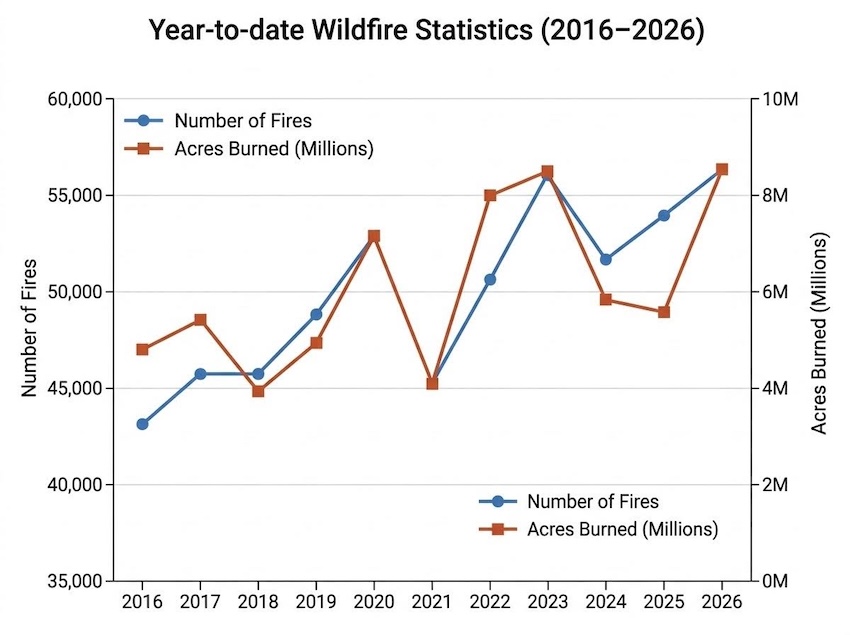
Line chart showing the total number of fires and acres burned across the U.S. each year from 2016 to 2026. To date, more than 55,000 fires have burned more than 8 million acres across the U.S. in 2026.
Year-to-date wildfire statistics for the United States  through September 16, 2026, compared to past years from 2016 onward. The blue line shows the total numbers of fires, and the red lines shows mllions of acres burned. Source: National Interagency Fire Center (NIFC).

Low Water Levels for Major Bureau of Reclamation Western Reservoirs

Reservoir levels have been plummeting after the record-breaking snow drought from last winter along with the multi-decade megadrought in the Southwest. Ten of the twelve major Reclamation reservoirs were below average as of August 30, 2026. Lake Mead plummeted to its all-time official record low on August 7, 2026. Lake Powell hit its all-time official record low on August 15, 2026. 
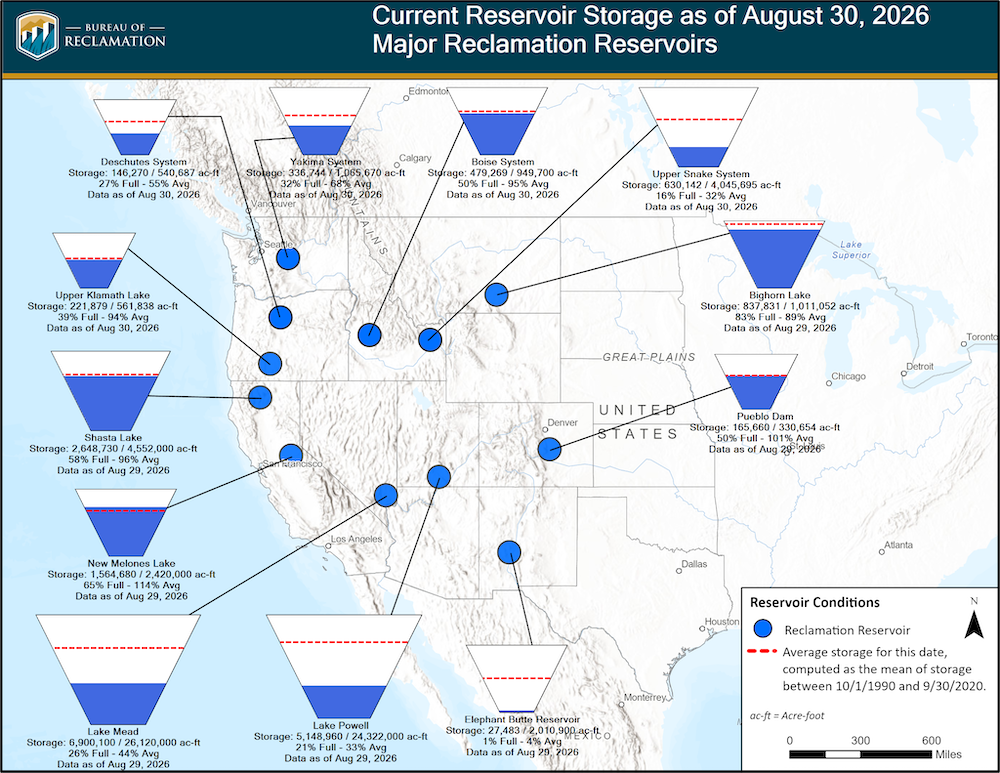
A map diagram from the Bureau of Reclamation displays current reservoir storage for twelve major western U.S. reservoirs as of late August 2026, using teacup-style graphics to compare stored water levels against total capacity and historical averages. 10 of the 12 featured reservoirs remain significantly below their historical average storage levels.
The static reservoir storage dashboard shows storage in acre-feet for a selection of operationally significant Reclamation reservoirs and reservoir systems. The static map includes data from 29 reservoirs, with eight individual reservoirs displayed on the map and an additional 21 reservoirs grouped into four reservoir systems. The average storage statistic for each reservoir or reservoir system is shown in the teacup images. Source: Bureau of Reclamation.

El Niño Forms and Strengthens

NOAA’s National Weather Service announced on June 11, 2026 that El Niño developed in the tropical Pacific, and issued an El Niño Advisory. The National Weather Service Climate Prediction Center’s (CPC’s) Official El Niño–Southern Oscillation (ENSO) Outlook, which synthesizes multiple models from North America and abroad, indicates El Niño will continue to strengthen through the end of the year. During October–December 2026, there is a 75% chance of a historic event that would exceed the strength of previous El Niño events dating back to 1950 (+2.5°C or more for a 3-month Relative Oceanic Niño Index value). With an event of this magnitude, the chances of experiencing impacts consistent with El Niño are larger, though not guaranteed (see CPC outlooks for probabilities of seasonal anomalies). In summary, El Niño is strengthening, with a greater than 90% chance of a very strong event during the Northern Hemisphere fall and winter 2026-27.
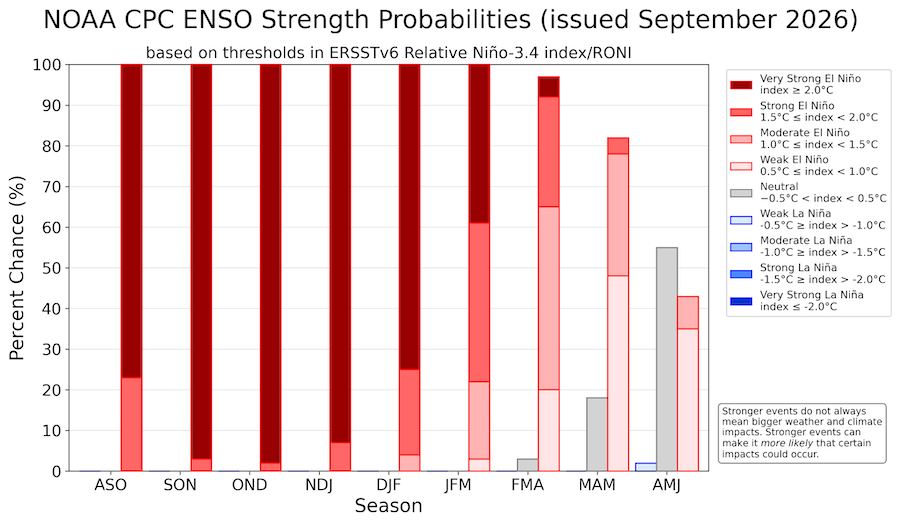
Stacked bar graph showing seasonal forecast ENSO probabilities from August–September–October (ASO) 2026 through April–May–June (AMJ) 2027. High probabilities of a Very Strong El Niño (index greater than or equal to 2.0 degrees Celsius) dominate the autumn and winter seasons, reaching over 90 percent from September–November through December–February.
Graph showing the strength probabilities for El Niño (red hues), La Niña (blue hues), and ENSO-Neutral conditions (gray) from NOAA’s Climate Prediction Center. Each bar shows the probabilities for a 3-month season, from July-August-September 2026 (JAS) to March-April-May 2027 (MAM). Darker hues indicate a stronger El Niño or La Niña event. Forecast issued on September 10, 2026. Source: NOAA Climate Prediction Center.

U.S. Caribbean Drought Sparks Fires and Water Rationing

Following a wetter-than-normal late winter and early spring, conditions across the U.S. Caribbean dried significantly throughout May, June, and July. The region experienced near-record warmth and dryness, which triggered grass fires and critically low stream levels. Depleting water supplies in major reservoirs and underground wells are causing significant economic losses across the agricultural sector.
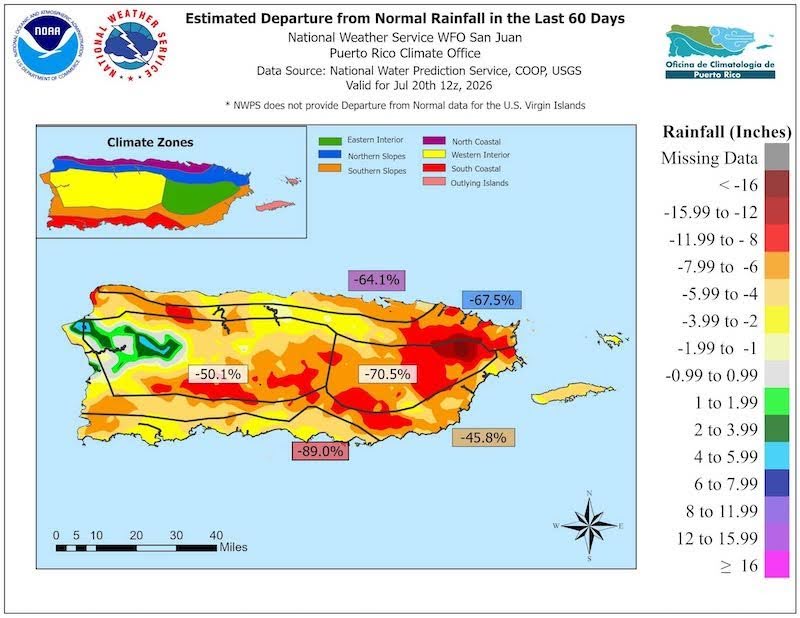
Map showing departure from normal rainfall for the 60 days leading up to July 20, 2026, for Puerto Rico. Much of Puerto Rico had below-normal precipitation during this period, with parts of eastern Puerto Rico at more than 8 inches below normal.
Map showing 60-day rainfall (inches) departure from normal. Valid July 20, 2026. Yellow, orange, and red hues indicate below-normal rainfall. Green, blue, and purple hues indicate above-normal rainfall. Source: NOAA National Weather Service, National Water Prediction Service.

Flash Drought in the Southern Plains and Lower Mississippi River Basin

WIth the forecast calling for extreme heat and dryness, NOAA’s National Weather ServiceClimate Prediction Center issued a rapid onset drought alert (i.e., flash drought) in mid-August for the Southern Plains and Lower Mississippi River Basin, including parts of Kansas, Oklahoma, Texas, Missouri, Arkansas, Louisiana, Mississippi, and a bit of Tennessee. 

On August 12, the National Weather Service issued a hazard outlook for rapid onset drought across  parts of Kansas, Oklahoma, Texas, Missouri, Arkansas, Louisiana, Mississippi, and a bit of Tennessee.
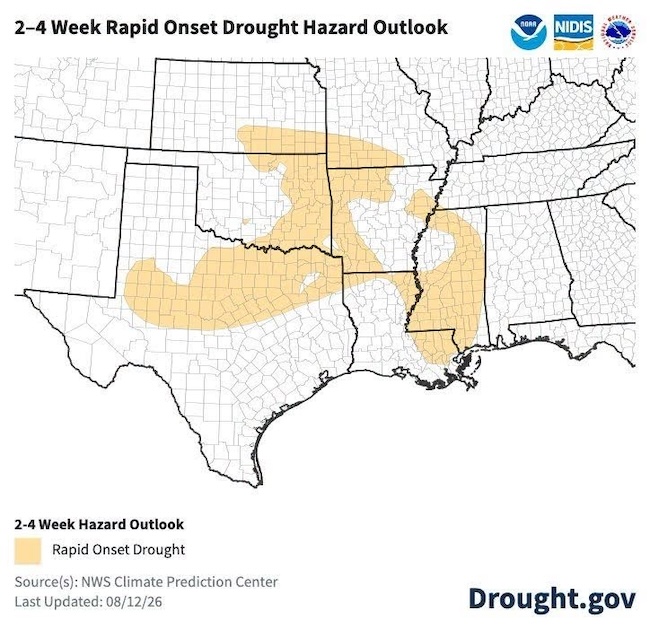
Map showing the 2–4 Week Rapid Onset Drought Hazard Outlook across the south-central United States, valid August 11, 2026. A shaded region highlights areas at risk for rapid onset drought extending across parts of Kansas, Oklahoma, Texas, Missouri, Arkansas, Louisiana, Mississippi, and a bit of Tennessee. Source: National Weather Service Climate Prediction Center

The outlook was verified and then some as drought expanded every week across the region from mid-August to mid-September, and continues to worsen.
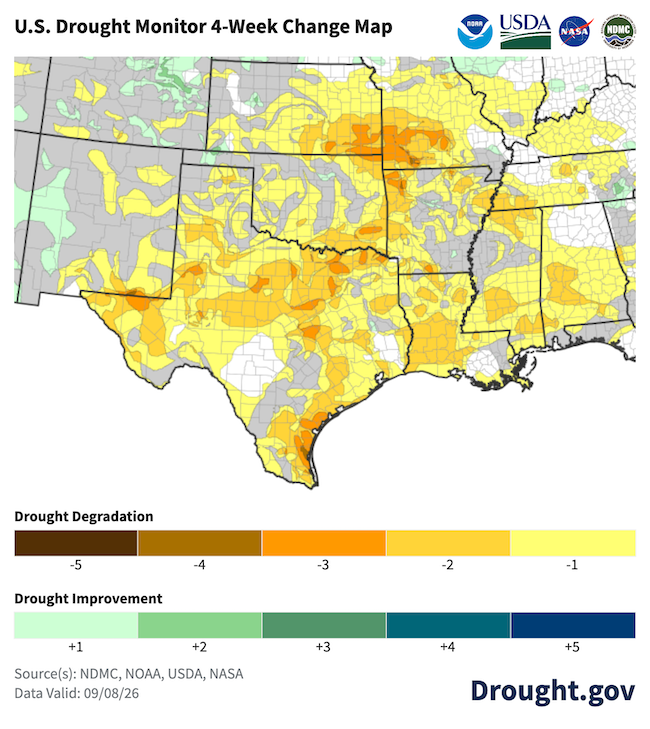
Map showing change in drought conditions from August 11 to September 8. Drought has worsened by 1 to three categories across much of the Southern Plains, Gulf States, and Lower Midwest.
The U.S. Drought Monitor 1-week change map shows where drought has improved, remained the same, or worsened since the previous week's Drought Monitor. Yellow/orange hues show areas where drought worsened, while green hues show drought improvement. Source: National Drought Mitigation Center, NOAA, and USDA.

Keep Up With the Latest Conditions and Outlooks 

Find maps, publicly accessible data, and recent research about drought and wildfire on drought.gov. You can also subscribe to NIDIS emails for the latest regional drought updates, webinars, and news in our drought early warning system regions. To stay up to date on the latest drought conditions, sign up to receive drought alerts for your city/zip code when the National Weather Service updates their U.S. Drought Outlooks.