Analyzing Drought Indicator Relevance by Region and Season
Key Takeaways from NASA-Led Research
Improving our understanding of the relevant indicators of drought for specific regions and seasons can support more effective drought monitoring, planning, and communications.
Monitoring drought is complex. Due to climatic differences, a drought in one part of the country may not be considered a drought somewhere else. In addition, the impacts of drought are extremely varied and depend on the socioeconomic environment of the community affected.
Effectively monitoring and planning for drought involves tracking multiple indicators (such as precipitation, soil moisture, surface water supply, etc.). However, the importance of a given indicator for monitoring drought can vary depending on location, time of year, historical drought impacts, or other factors.
In response to the need to better understand drought indicators by region, a team of NASA scientists conducted research to quantify the relative importance—or “drought explainability”—of 113 different drought indicators, by location and season. The research team, which was funded by NOAA's National Integrated Drought Information System (NIDIS), used an approach called mutual information to compare these indicators to the U.S. Drought Monitor’s drought designations from 2006–2019.
View key takeaways and research caveats from this NASA research below, explore the data on drought.gov, or read the peer-reviewed study in the Journal of Hydrometeorology.

Research Overview
A team of scientists at the NASA Goddard Space Flight Center conducted research to quantify the relative importance—or “drought explainability”—of specific indicators with respect to the U.S. Drought Monitor (USDM). This research was published in the Journal of Hydrometeorology and was funded by NOAA’s National Integrated Drought Information System (NIDIS).
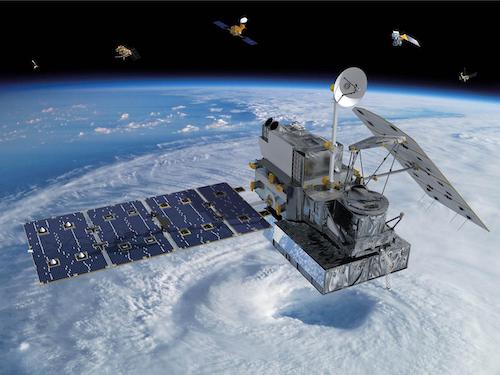
In the study, the researchers looked at 113 indicators of drought, including in situ (observation-based), modeled, and remote-sensed data across a variety of timescales (from 1 week to 72 months).
The researchers used an information theoretic measure, mutual information, to compare these 113 indicators to U.S. Drought Monitor data from 2006-2019. They broke these results down by geographic region and season (spring, summer, fall, winter, and all seasons).
The researchers calculated the mutual information for each of the 113 indicators individually, as well as for several groups of indicators (e.g., all remote-sensing indicators combined). To do this, they began with historical percentiles for each of the indicators and calculated the mutual information with the U.S. Drought Monitor. Researchers then normalized these values, so they could compare results across different locations. The resulting normalized mutual information is called fractional information. They used climate division–resolution data to calculate the fractional information for six regions across the continental U.S., which mostly align with NOAA's Regional Climate Centers: High Plains, Midwest, Northeast, South, Southeast, and West.
The results show which drought indicators are most representative of the U.S. Drought Monitor’s depiction of drought for a given region and season.
Read the peer-reviewed article in the Journal of Hydrometeorology.
Key Takeaways
- NASA conducted research to determine which drought indicators are most representative of the U.S. Drought Monitor’s depiction of drought for a given region and season.
- The study compared 113 indicators to the U.S. Drought Monitor from 2006–2019 using an approach called mutual information.
- The researchers calculated the "drought explainability" of each indicator (and groupings of indicators) for six regions that correspond with NOAA's Regional Climate Centers.
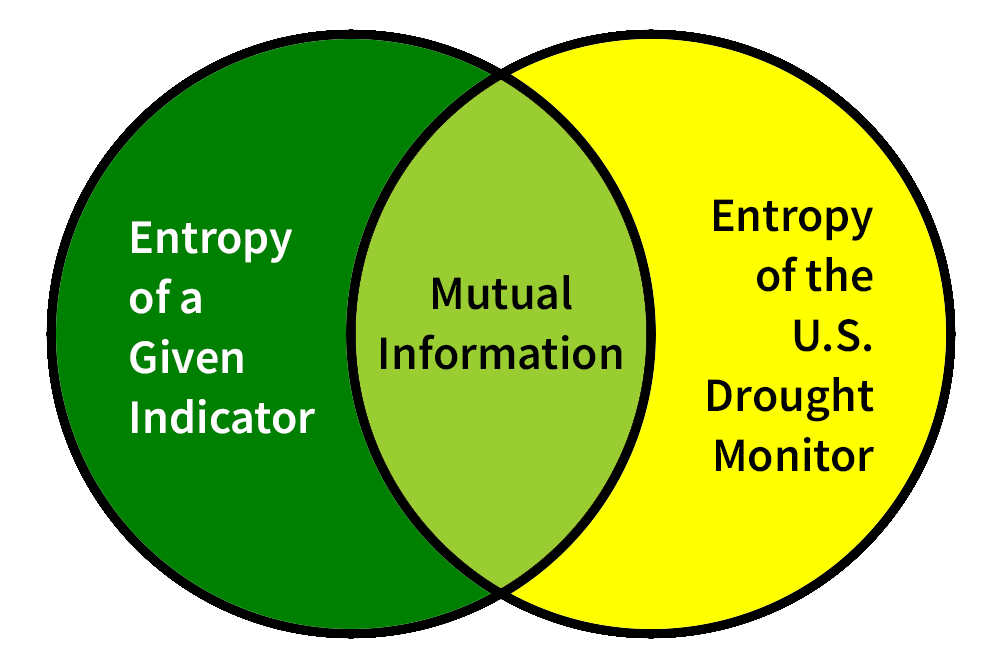
Entropy is the randomness or uncertainty in a given variable.
The degree to which one random data stream “explains” another, or the degree of common information between the two streams, is called mutual information.
When looking at a particular indicator (e.g., 1-month precipitation) with respect to the U.S. Drought Monitor, the mutual information is the amount of information obtained about the U.S. Drought Monitor by observing that particular indicator.
Since the entropy of the U.S. Drought Monitor—and therefore, of the mutual information between the U.S. Drought Monitor and a given indicator—varies by geographic location, the researchers normalized the mutual information values so that they could compare results across different locations.
This normalized mutual information is called fractional information, and it's calculated by dividing the mutual information by the entropy of the U.S. Drought Monitor.
FI values range from 0 to 1, with 0 meaning there is no mutual information between that indicator and the U.S. Drought Monitor and 1 meaning the maximum amount of mutual information.
What Indicators Did the Researchers Include?
The researchers included 113 different indicators in their analysis. They developed this list of indicators based on (1) an up-to-date list of indicators used by U.S. Drought Monitor authors, (2) available resources to process data, and (3) the need for a broad, representative set of indicators.
Some indicators used by those engaged in drought monitoring were not included in this analysis, such as reservoir data or in situ soil moisture. You can also calculate many of these indicators (e.g., SPI) using other underlying datasets, which were not included in the analysis.
To view a complete list of all the indicators included in this study, along with their timescales, periods of record, and spatial resolution, see table 1 in the research publication.
Indicators Used in This Study
NOAA nClimGrid-Monthly (11 timescales ranging from 1- to 72-month):
- Precipitation accumulations
- Standardized Precipitation Index (SPI)
- Standardized Precipitation Evapotranspiration Index (SPEI)
- Mean and maximum air temperature
- Palmer Z indices (1- and 6-month timescales)
- Palmer Modified Drought index (PMDI)
- Palmer Hydrological Drought Index (PHDI)
Four NLDAS-2 Land Surface Models (Mosaic, Noah, SAC, VIC):
- Soil moisture (top 1 meter and total column depths)
- Evapotranspiration
- Snow water equivalent (SWE)
- Total runoff
- Streamflow
- Soil moisture (top 1 meter and total column depths)
- Groundwater
NOAA Evaporative Demand Drought Index (EDDI) (24 timescales ranging from 1-week to 12-month)
NOAA Climate Prediction Center soil moisture
NOAA Snow Data Assimilation System (SNODAS) snow water equivalent (SWE)
NASA Integrated Multi-satellitE Retrievals for Global Precipitation Measurement (IMERG) precipitation accumulations (11 timescales ranging from 1- to 72-month)
European Space Agency (ESA) CCI soil moisture
ESA GlobSnow3 snow water equivalent (SWE)
Evaporative Stress Index (4- and 12-week timescales)
NOAA Blended Vegetation Health Product:
- Normalized Difference Vegetation Index (NDVI)
- Temperature Condition Index (TCI)
- Vegetation Condition Index (VCI)
- Vegetation Health Index (VHI)
How Can I Use This Research?
 The results of this research highlight indicators—and timescales—that may be relevant to monitor drought in a given region and season. They also highlight regional and seasonal differences in indicator performance that can inform future drought monitoring and planning efforts.
For instance, state and local partners from across the country provide on-the-ground input each week to the U.S. Drought Monitor author. The findings from this research can help refine the indicators and timescales that are used by the states each week, including which indicators are used in each season.
This research can also help identify the most relevant indicators to include in drought plans at the state or local level. Drought plans typically include drought indicators to monitor conditions that are connected to triggers for action like enacting state drought task forces or measures to conserve water.
However, this is not a definitive or comprehensive list of indicators to use for drought monitoring, and there are limitations to the conclusions we can draw from this study. Learn more about the research caveats.

Research Caveats
Training Target: U.S. Drought Monitor
This analysis uses the U.S. Drought Monitor from 2006–2019 as its target. All indicators were analyzed in comparison to the U.S. Drought Monitor as the “truth” of actual drought conditions, so the “drought explainability” (fractional information) of each indicator is actually “2006-2019 U.S. Drought Monitor explainability.” The U.S. Drought Monitor is created by a rotating set of authors using both objective drought indicators and subjective assessment based on the authors’ expertise and local input. In addition, not all indicators used by the U.S. Drought Monitor authors were included in this study, and the indicators U.S. Drought Monitor authors rely on have changed over time (e.g., as new datasets became available).
While this study cannot tell us which datasets the U.S. Drought Monitor authors necessarily used, it can tell us which datasets correlate with the U.S. Drought Monitor’s depiction of drought. Using a different target (or a different time range) may produce different fractional information values, just like with any other technique.
Key Takeaways
Indicators and Timescales Included in Study
Some indicators that are used by state and local governments to monitor drought were not included in this study. For instance, reservoir levels were not included, which is an important drought indicator in many areas, including the Western U.S. In addition, a limited number of snow water equivalent (SWE), runoff, and streamflow datasets were used in this study relative to other water supply datasets (like precipitation). Therefore, this research cannot tell us how these indicators would perform alongside the 113 included indicators.
Timescales included in this study ranged from 1 month to 72 months. For flash drought, or the rapid intensification of drought, shorter timescales on the order of 1-3 weeks may be relevant.
Local Relevance of Research
This analysis was conducted at a large regional level (e.g., West, Midwest), but geographies and climates vary widely across these large regions. For local communities within each region, the relevance of a particular indicator may vary. Future research could conduct a similar analysis at smaller geographic scales (e.g., state, county) in order to better capture smaller scale relevance.
In addition, this study analyzed 2006-2019, and therefore the indicators with the highest fractional information may not be the most relevant for all individual droughts or the current drought because individual events can be driven by different factors.
This research is meant to inform the drought monitoring and research communities, but it should be interpreted in the context of other research, expert guidance, and historical drought conditions and impacts for your region.

Research Findings
Below are some high-level takeaways from this research:
No individual indicator can define drought on its own—and there are seasonal differences. Higher “drought explainability” comes when combining multiple indicators.
In this study, the fractional information for each indicator represents the amount of information obtained about the 2006-2019 U.S. Drought Monitor by observing a given indicator. This is expressed as a fraction (decimal) ranging from 0 to 1. But even the indicators with the highest fractional information still only have values of around 0.4—that is, a 40% “drought explainability” for the U.S. Drought Monitor. Looking at larger groups of indicators combined shows much higher fractional information. Some indicators’ fractional information values also vary by season (for example, soil moisture may have higher fractional information in the summer versus the winter). Looking at multiple indicators can lead to higher “drought explainability,” and the best indicators to monitor may vary by season.
Key Takeaways
Looking at only the top 15 drought indicators from this research can capture or “explain” most of the U.S. Drought Monitor depiction.
Looking only at the top 15 indicators (that is, the 15 indicators with the highest fractional information in this study) combined has almost as much “drought explainability” with respect to the U.S. Drought Monitor as all 113 indicators combined. The fractional information of the top 15 indicators combined is only 11%–20% less than all 113 combined (~55-75% “drought explainability” for the top 15 vs. ~65-80% for all 113). This indicates the possibility that—at least for some locations and seasons—a judicious selection of indicators could enable effective drought monitoring and forecasting.
Remotely-sensed and modeled indicators can provide useful drought monitoring in station-scarce areas.
Looking only at all the remotely-sensed or all the modeled indicators has almost as much “drought explainability” with respect to the U.S. Drought Monitor as all 113 indicators combined (which includes observation-based indicators), for most seasons and locations. This suggests a useful drought monitoring product could be possible using only remotely-sensed or only modeled inputs. This could be especially valuable in station-scarce regions, where in situ data are limited.

Explore Regional Takeaways from This Research
Click on the map below to jump to results for your region.
The results highlight the top 15 indicators for each region and season, based on their fractional information values. These indicators are categorized by type, such as precipitation and soil moisture. For soil moisture, various products were consolidated into categories by depth (i.e., 1-meter, total column, or 1.6-meter soil moisture). The findings are presented as "all-season" data, representing top indicators throughout the year, and also broken down by individual seasons.
Explore Results by Region

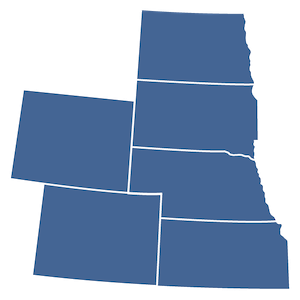 For the High Plains region—which includes Colorado, Kansas, Nebraska, North Dakota, South Dakota, and Wyoming—the researchers found that soil moisture emerged as a top indicator of drought across all seasons, with respect to the U.S. Drought Monitor.
Other indicators with high relevance for this region include the Palmer indices, as well as precipitation accumulations, the Standardized Precipitation Index (SPI), and the Standardized Precipitation Evapotranspiration Index (SPEI) at 9- and 12-month timescales.
 | Soil Moisture 1-Meter Soil Moisture Total Column Soil Moisture |  | Evaporation-Based Indicator Standardized Precipitation Evapotranspiration Index (SPEI) Timescales: 9-month, 12-month |
 | Precipitation-Based Indicators Precipitation |  | Palmer Indices Palmer Modified Drought Index Palmer Hydrological Drought Index |
Seasonal Takeaways for the High Plains
When looking at the fractional information of each indicator by season, in the High Plains, precipitation indicators have higher relevance in the fall and winter, while soil moisture emerges as a top indicator in the summer and spring.
Timescales of importance also differ across seasons:
- Longer timescales have higher relevance in winter (up to 48 months).
- Relatively shorter timescales have higher relevance in other seasons (especially 6- to 12-month timescales).
Groundwater emerges as a top indicator across all seasons except for summer. The Palmer Hydrological Drought Index (PHDI) emerges as a top indicator across all seasons.
Explore these results in more detail on Drought.gov or read the peer-reviewed publication.
| Soil Moisture 1-Meter Soil Moisture Total Column Soil Moisture | | Evaporation-Based Indicator Standardized Precipitation Evapotranspiration Index (SPEI) Timescale: 12-month |
| Precipitation-Based Indicators Precipitation | | Palmer Indices Palmer Modified Drought Index Palmer Hydrological Drought Index |
 | Precipitation-Based Indicators Precipitation |  | Palmer Indices Palmer Modified Drought Index Palmer Hydrological Drought Index |
 | Groundwater |  | Evaporation-Based Indicator Standardized Precipitation Evapotranspiration Index (SPEI) Timescales: 6-month, 9-month, 12-month, 24-month |
 | Soil Moisture Total Column Soil Moisture |
 | Precipitation-Based Indicators Precipitation |  | Palmer Indices Palmer Hydrological Drought Index |
| Groundwater |  | Evaporation-Based Indicator Standardized Precipitation Evapotranspiration Index (SPEI) Timescales:12-month, 36-month, 48-month |
 | Soil Moisture Total Column Soil Moisture |
| Precipitation-Based Indicators Precipitation |  | Soil Moisture Total Column Soil Moisture |
| Groundwater |  | Evaporation-Based Indicator Standardized Precipitation Evapotranspiration Index (SPEI) Timescale: 12-month |
 | Palmer Indices Palmer Hydrological Drought Index |

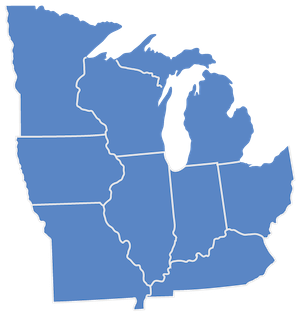 In this study, the Midwest region includes Minnesota, Iowa, Missouri, Wisconsin, Michigan, Illinois, Indiana, Ohio, and Kentucky.
In this region, soil moisture emerged as a top indicator across multiple datasets.
Other indicators with high relevance with respect to the U.S. Drought Monitor across seasons include precipitation and the Standardized Precipitation Index (SPI) at 2- and 3-month timescales; the 3-month Standardized Precipitation Evapotranspiration Index (SPEI); and the Palmer Modified Drought Index (PMDI).
 | Soil Moisture 1-Meter Soil Moisture 1.6-Meter Soil Moisture Total Column Soil Moisture | | Evaporation-Based Indicator Standardized Precipitation Evapotranspiration Index (SPEI) Timescale: 3-month |
 | Precipitation-Based Indicators Precipitation |  | Palmer Indices Palmer Modified Drought Index |
Seasonal Takeaways for the Midwest
When looking at the fractional information of each indicator by season, in the Midwest, soil moisture is a relevant indicator across all individual seasons.
While precipitation, SPI, and SPEI also have high fractional information in every season, the most relevant timescales vary by time of year.
- Longer timescales have higher relevance in winter (up to 12 months) and spring (up to 9 months).
- Shorter timescales have higher relevance in the summer (up to 6 months) and fall (up to 3 months).
Runoff emerges as a top indicator in all seasons except for summer, and groundwater emerges as a top indicator in the winter. The Palmer indices show high fractional information in the spring and winter in the Midwest.
Explore these results in more detail on Drought.gov or read the peer-reviewed publication.
 | Evaporation-Based Indicator Standardized Precipitation Evapotranspiration Index (SPEI) Timescales: 2-month, 3-month, 6-month |  | Precipitation-Based Indicators Precipitation |
 | Soil Moisture 1-Meter Soil Moisture 1.6-Meter Soil Moisture Total Column Soil Moisture |
| Evaporation-Based Indicator Standardized Precipitation Evapotranspiration Index (SPEI) Timescales: 2-month, 3-month | | Precipitation-Based Indicators Precipitation |
 | Runoff | | Soil Moisture 1-Meter Soil Moisture 1.6-Meter Soil Moisture Total Column Soil Moisture |
 | Palmer Indices Palmer Modified Drought Index |
 | Palmer Indices Palmer Modified Drought Index Palmer Hydrological Drought Index |  | Evaporation-Based Indicator Standardized Precipitation Evapotranspiration Index (SPEI) Timescale: 6-month |
| Runoff |  | Groundwater |
 | Precipitation-Based Indicators Precipitation |  | Soil Moisture 1-Meter Soil Moisture Total Column Soil Moisture |
 | Soil Moisture 1-Meter Soil Moisture 1.6-Meter Soil Moisture Total Column Soil Moisture |  | Palmer Indices Palmer Modified Drought Index Palmer Hydrological Drought Index |
 | Precipitation-Based Indicators Precipitation |  | Evaporation-Based Indicator Standardized Precipitation Evapotranspiration Index (SPEI) Timescales: 6-month, 9-month |
 | Runoff |

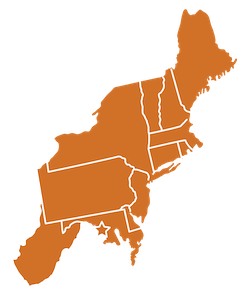 In this study, the Northeast region includes Connecticut, Delaware, Maine, Maryland, Massachusetts, New Hampshire, New Jersey, New York, Pennsylvania, Rhode Island, and West Virginia.
In the Northeast, soil moisture, the Palmer drought indices, and runoff emerged as top indicators with respect to the U.S. Drought Monitor across all seasons combined.
Other relevant indicators for the Northeast include precipitation, the Standardized Precipitation Index (SPI), and the Standardized Precipitation Evapotranspiration Index (SPEI) at 2- to 6-month timescales.
| Soil Moisture 1-Meter Soil Moisture Total Column Soil Moisture | | Evaporation-Based Indicator Standardized Precipitation Evapotranspiration Index (SPEI) Timescales: 2-month, 3-month, 6-month |
 | Precipitation-Based Indicators Precipitation |  | Palmer Indices Palmer Modified Drought Index Palmer Hydrological Drought Index |
 | Runoff |
Seasonal Takeaways for the Northeast
When looking at the fractional information of each indicator by season, in the Northeast, soil moisture has high relevance across all seasons. Longer timescales of precipitation, the Standardized Precipitation Index (SPI), and the Standardized Precipitation Evapotranspiration Index (SPEI) had higher relevance in the winter (up to 24 months) compared to other seasons. In the summer, shorter timescales (2 to 3 months) had higher relevance.
Runoff emerged as a top indicator in the Northeast across all seasons except winter. Groundwater and the Evaporative Demand Drought Index (EDDI) had high relevance in winter. Streamflow emerged as a top indicator in the spring. The Palmer Hydrological Drought Index (PHDI) and Palmer Modified Drought Index (PMDI) had high relevance in fall/winter and summer/fall, respectively.
Explore these results in more detail on Drought.gov or read the peer-reviewed publication.
 | Precipitation-Based Indicators Precipitation |  | Evaporation-Based Indicator Standardized Precipitation Evapotranspiration Index (SPEI) Timescales: 2-month, 3-month |
| Soil Moisture 1-Meter Soil Moisture Total Column Soil Moisture |  | Runoff |
 | Palmer Indices Palmer Modified Drought Index |
 | Palmer Indices Palmer Modified Drought Index Palmer Hydrological Drought Index |  | Evaporation-Based Indicator Standardized Precipitation Evapotranspiration Index (SPEI) Timescales: 3-month, 6-month, 9-month |
 | Precipitation-Based Indicators Precipitation | | Soil Moisture 1-Meter Soil Moisture Total Column Soil Moisture |
 | Runoff |
| Precipitation-Based Indicators Precipitation |  | Soil Moisture 1-Meter Soil Moisture Total Column Soil Moisture |
| Groundwater | | Evaporation-Based Indicators Evaporative Demand Drought Index (EDDI) |
 | Palmer Indices Palmer Hydrological Drought Index |
 | Precipitation-Based Indicators Precipitation |  | Evaporation-Based Indicator Standardized Precipitation Evapotranspiration Index (SPEI) Timescales: 2-month, 3-month, 6-month |
 | Streamflow |  | Runoff |
 | Soil Moisture 1-Meter Soil Moisture Total Column Soil Moisture |

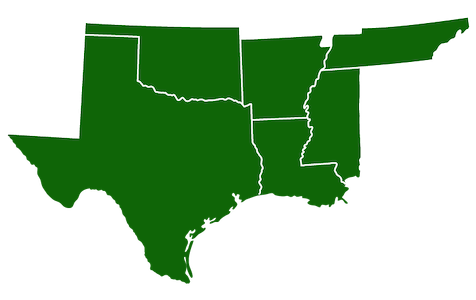 In this study, the South region includes Arkansas, Louisiana, Mississippi, Oklahoma, Tennessee, and Texas.
In this region, soil moisture, runoff, and the Palmer indices emerged as top indicators with respect to the U.S. Drought Monitor when looking across all seasons combined.
The relevance of precipitation-based indicators varied by season.
| Soil Moisture 1-Meter Soil Moisture 1.6-Meter Soil Moisture Total Column Soil Moisture |  | Precipitation-Based Indicators Precipitation |
 | Palmer Indices Palmer Modified Drought Index Palmer Hydrological Drought Index |  | Runoff |
Seasonal Takeaways for the South
When looking at the fractional information of each indicator by season, in the South, soil moisture and runoff showed high relevance across all individual seasons. So did the Palmer Modified Drought Index (PMDI). Streamflow had high fractional information in winter and spring.
For precipitation, the Standardized Precipitation Index (SPI), and the Standardized Precipitation Evapotranspiration Index (SPEI), the timescales with the highest relevance information varied by season: 9- to 12-month in winter, 6- to 12-month in spring, and 3- to 6-month in summer and fall.
Explore these results in more detail on Drought.gov or read the peer-reviewed publication.
 | Soil Moisture 1-Meter Soil Moisture Total Column Soil Moisture |  | Palmer Indices Palmer Modified Drought Index Palmer Hydrological Drought Index |
 | Runoff |  | Evaporation-Based Indicator Standardized Precipitation Evapotranspiration Index (SPEI) Timescale: 3-month |
 | Precipitation-Based Indicators Precipitation |
| Soil Moisture 1-Meter Soil Moisture 1.6-Meter Soil Moisture Total Column Soil Moisture |  | Runoff |
 | Palmer Indices Palmer Modified Drought Index Palmer Hydrological Drought Index |  | Precipitation-Based Indicators Precipitation |
 | Evaporation-Based Indicator Standardized Precipitation Evapotranspiration Index (SPEI) Timescale: 3-month |
 | Palmer Indices Palmer Modified Drought Index Palmer Hydrological Drought Index |  | Soil Moisture 1-Meter Soil Moisture 1.6-Meter Soil Moisture Total Column Soil Moisture |
 | Precipitation-Based Indicators Precipitation |  | Streamflow |
 | Runoff |  | Evaporation-Based Indicator Standardized Precipitation Evapotranspiration Index (SPEI) Timescales: 9-month, 12-month |
 | Soil Moisture 1-Meter Soil Moisture Total Column Soil Moisture |  | Palmer Indices Palmer Modified Drought Index |
 | Streamflow |  | Runoff |
 | Precipitation-Based Indicators Precipitation |

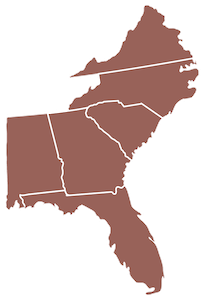 In this study, the Southeast region includes Alabama, Georgia, Florida, North Carolina, South Carolina, and Virginia.
In this region, soil moisture, precipitation-based indices (at 3- to 9-month timescales), the Standardized Precipitation Evapotranspiration Index (SPEI), Palmer indices, and runoff emerged as top indicators with respect to the U.S. Drought Monitor across all seasons combined.
| Soil Moisture 1-Meter Soil Moisture 1.6-Meter Soil Moisture Total Column Soil Moisture |  | Precipitation-Based Indicators Precipitation |
 | Evaporation-Based Indicator Standardized Precipitation Evapotranspiration Index (SPEI) Timescale: 6-month |  | Palmer Indices Palmer Modified Drought Index Palmer Hydrological Drought Index |
 | Runoff |
Seasonal Takeaways for the Southeast
When looking at the fractional information of each indicator by season, in the Southeast, soil moisture, the Palmer indices, and runoff emerged as top indicators across all individual seasons.
When looking at precipitation and SPI, relevant timescales vary by season: 3 to 6 months in summer, 6 to 9 months in fall, and 6 to 12 months in winter/spring.
Streamflow has high fractional information in summer, and groundwater in the spring.
Explore these results in more detail on Drought.gov or read the peer-reviewed publication.
 | Palmer Indices Palmer Modified Drought Index Palmer Hydrological Drought Index | | Precipitation-Based Indicators Precipitation |
 | Runoff |  | Streamflow |
 | Soil Moisture 1-Meter Soil Moisture Total Column Soil Moisture |  | Evaporation-Based Indicator Standardized Precipitation Evapotranspiration Index (SPEI) Timescales: 3-month, 6-month |
 | Precipitation-Based Indicators Precipitation |  | Palmer Indices Palmer Modified Drought Index Palmer Hydrological Drought Index |
| Runoff |  | Soil Moisture 1-Meter Soil Moisture 1.6-Meter Soil Moisture Total Column Soil Moisture |
 | Evaporation-Based Indicator Standardized Precipitation Evapotranspiration Index (SPEI) Timescales: 3-month, 6-month |
| Palmer Indices Palmer Modified Drought Index Palmer Hydrological Drought Index |  | Soil Moisture 1-Meter Soil Moisture Total Column Soil Moisture |
| Runoff |  | Precipitation-Based Indicators Precipitation |
 | Soil Moisture 1-Meter Soil Moisture Total Column Soil Moisture | | Palmer Indices Palmer Modified Drought Index Palmer Hydrological Drought Index |
| Runoff |  | Evaporation-Based Indicator Standardized Precipitation Evapotranspiration Index (SPEI) Timescales: 6-month, 12-month |
 | Precipitation-Based Indicators Precipitation |  | Groundwater |

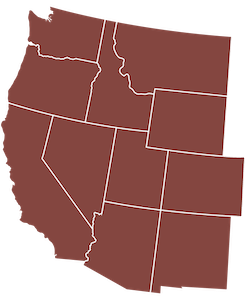
In this study, the West region includes Arizona, California, Colorado, Idaho, Montana, Nevada, New Mexico, Oregon, Utah, Washington, and Wyoming.
When looking at all seasons combined, soil moisture, groundwater, precipitation, the Standardized Precipitation Index (SPI), the Standardized Precipitation Evapotranspiration Index (SPEI), and the Palmer indices emerged as top indicators with respect to the U.S. Drought Monitor in the West. Overall, longer timescales emerged as more relevant for the West compared to other regions: 9, 12-, and 24-month for precipitation and SPI and 6-, 9-, 12-, and 24-month for SPEI.
Caveats for Interpreting Results
Some indicators that are used by state and local governments to monitor drought were not included in this study. For instance, reservoir levels, which are an important drought indicator in the Western U.S., were not included. In addition, a limited number of snow water equivalent (SWE), runoff, and streamflow datasets were used in this study relative to other water supply datasets (like precipitation). Therefore, this research cannot tell us how these indicators would perform alongside the 113 included indicators.
| Soil Moisture Total Column Soil Moisture |  | Evaporation-Based Indicator Standardized Precipitation Evapotranspiration Index (SPEI) Timescales: 6-month, 9-month, 12-month, 24-month |
 | Precipitation-Based Indicators Precipitation |  | Palmer Indices Palmer Modified Drought Index Palmer Hydrological Drought Index |
 | Groundwater |
Seasonal Takeaways for the West
When looking at the fractional information of each indicator by season, in the West, SPEI had consistently high relevance across all individual seasons.
Soil moisture has seasonal importance: it is one of the indicators with highest “drought explainability” for the West in the summer and spring, but not in the winter.
For precipitation-based indicators, longer timescales (24- and 36-month) had higher relevance in the fall and winter than in the spring and summer. In general across all seasons, the West favors longer timescales (9 months+) compared to other regions.
Explore these results in more detail on Drought.gov or read the peer-reviewed publication.
 | Evaporation-Based Indicator Standardized Precipitation Evapotranspiration Index (SPEI) Timescales: 6-month, 9-month, 12-month, 24-month |  | Precipitation-Based Indicators Precipitation |
 | Palmer Indices Palmer Modified Drought Index Palmer Hydrological Drought Index |  | Groundwater |
 | Soil Moisture 1-Meter Soil Moisture Total Column Soil Moisture |
| Evaporation-Based Indicator Standardized Precipitation Evapotranspiration Index (SPEI) Timescales: 6-month, 9-month, 12-month, 24-month, 36-month | | Precipitation-Based Indicators Precipitation |
| Palmer Indices Palmer Modified Drought Index Palmer Hydrological Drought Index | | Groundwater |
| Evaporation-Based Indicator Standardized Precipitation Evapotranspiration Index (SPEI) Timescales: 9-month, 12-month, 24-month, 36-month | | Precipitation-Based Indicators Precipitation |
 | Groundwater |  | Palmer Indices Palmer Hydrological Drought Index |
| Evaporation-Based Indicator Standardized Precipitation Evapotranspiration Index (SPEI) Timescales: 6-month, 9-month, 12-month, 24-month | | Precipitation-Based Indicators Precipitation |
 | Groundwater |  | Palmer Indices Palmer Hydrological Drought Index |
| Soil Moisture 1-Meter Soil Moisture Total Column Soil Moisture |

Learn more about the results of this research and other research focused on identifying relevant indicators for drought monitoring:
- North America Drought Indices and Indicators Assessment: In 2019-2020, the North America Commission for Environmental Cooperation (CEC) conducted surveys and virtual meetings to assess how drought indices and indicators were used in the diverse climates of the continent. This study assessed how various drought indices were used across different climate zones (self-reported). Read the journal article or explore the data.
- Developing an Objective, Impacts-Based Framework for Drought Mitigation Activities in Ohio: This project, led by the State Climate Office of Ohio and Ohio Emergency Management Agency (EMA) and funded by NIDIS, developed a system to track and assess drought intensity in Ohio and produce real-time drought monitoring products. This included evaluating existing drought monitoring tools and identifying which are most appropriate for Ohio EMA. To learn more, read the study in the Journal of Hydrometeorology, or watch a recorded presentation on this project.
- Analyzing Drought Indices and Models to Characterize Soil Moisture Drought: This NIDIS-funded study used soil moisture data from long-term monitoring stations across the United States to test the ability of meteorological drought indices and soil moisture models to accurately characterize soil moisture drought (i.e., when soil moisture is anomalously low). Results show that drought monitoring should favor the use of soil moisture models over meteorological drought indices for characterizing soil moisture drought. The researchers also explored at what timescales and in what seasons drought indices most accurately reflect soil moisture conditions.
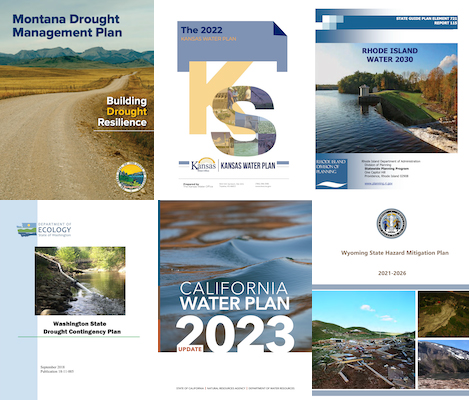
- Montana Drought Management Plan–Guide for Drought Monitoring and Assessment: This Plan provides a comprehensive management framework to improve drought preparedness at all phases of the drought cycle. The Guide for Drought Monitoring and Assessment (Appendix B) is intended to offer direction in the application of drought metrics in Montana by season based on experience and lessons learned from the Montana drought monitoring subcommittee.
For more information about this research, read the journal article or contact the research team at NASA’s Goddard Space Flight Center.