Explore the Data: Drought Indicator Relevance by Region and Season
Explore the Data from This NASA-Led Research
Explore the Data
 Below, you can view the 15 indicators and timescales with the highest fractional information ("drought explainability" with respect to the U.S. Drought Monitor) from this study for different regions and seasons.
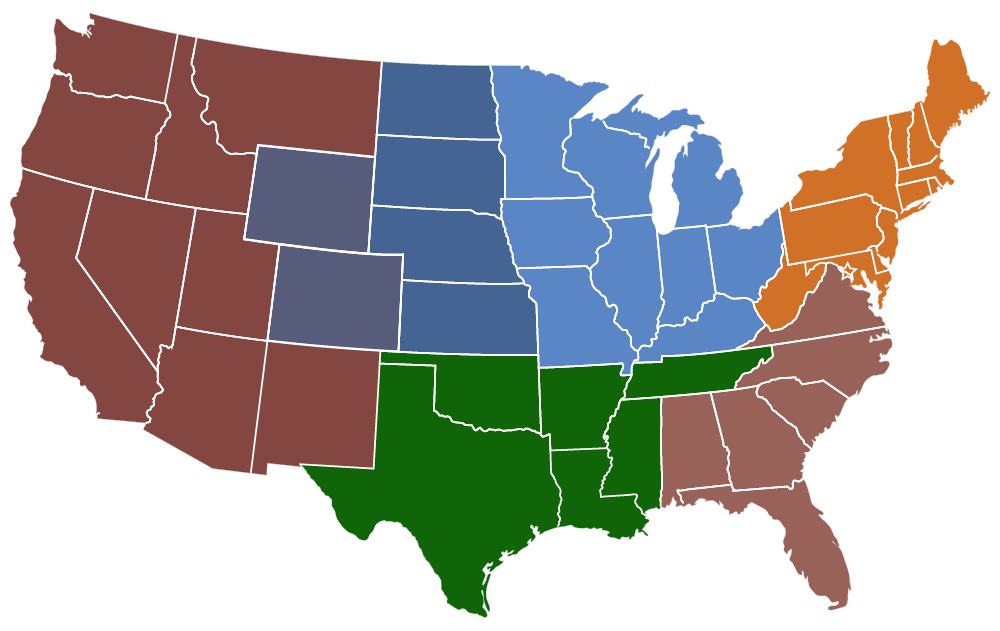
This NASA-led study analyzed 113 indicators of drought across a variety of timescales (from 1 week to 72 months). Using an information theoretic measure, mutual information, the researchers compared these 113 indicators to U.S. Drought Monitor data from 2006-2019, with results broken down by region and season.
The researchers used historical percentiles for each of the indicators to calculate their mutual information with the U.S. Drought Monitor, then normalized these values to allow comparison across different locations. The resulting normalized mutual information is called fractional information. They used climate division–resolution data to calculate the fractional information for six U.S. regions that largely align with NOAA's Regional Climate Centers: High Plains, Midwest, Northeast, South, Southeast, and West.
Notes for Interpretation
Some indicators that are used by state and local governments to monitor drought were not included in this study. For instance, reservoir levels were not included, which is an important drought indicator in many areas, including the Western U.S. In addition, a limited number of snow water equivalent (SWE), runoff, and streamflow datasets were used in this study relative to other water supply datasets (like precipitation). Therefore, this research cannot tell us how these indicators would perform alongside the 113 included indicators. View a full list of the indicators included in this analysis.
In addition, some regions/seasons may have a shorter or longer list of indicators since each timescale is counted as one indicator (e.g., 3-month vs. 6-month precipitation). In addition, some indicators in the study were calculated using multiple underlying datasets; if the same indicator had high fractional information across multiple datasets, each was counted as a separate indicator (e.g., total column soil moisture from NLDAS-2 Noah and NLDAS-2 Mosaic).
Learn more about this research and how it can be used, read the publication in the Journal of Hydrometeorology, or download a CSV file with all of the regional results.
| Indicator | What Is This, and How Do I Use It? | Datasets In Study | Additional Datasets |
|---|---|---|---|
| Total Column Soil Moisture | Soil moisture—the amount of water held in the pores of the soil—is a key variable for monitoring drought. Soil moisture can be observed (through monitoring stations), modeled, or remotely sensed and can be measured at a variety of depths. | NLDAS-2 Noah (Model-based), NLDAS-2 Mosaic (Model-based), NLDAS-2 VIC (Model-based), NLDAS-2 SAC (Model-based) | NASA Short-term Prediction and Transition Center – Land Information System (SPoRT-LIS) (conditions compared to 1981-2013) Crop Condition and Soil Moisture Analytics Tool (Crop-CASMA) (compared to 2015–present) NASA GRACE Data Assimilation (compared to 1948-2012) NOAA's Climate Prediction Center (compared to 1991-2020) |
| 9-Month, 12-Month Standardized Precipitation Index (SPI) | SPI is a drought index that captures how observed precipitation deviates from the climatological average over a given time period. Looking at multiple timescales can show short- and long-term precipitation deficits. | NOAA's nClimGrid-Monthly (Observation-based) | High Plains Regional Climate Center ACIS Maps Southern Regional Climate Center Integrated Water Portal Climate Engine (create SPI using different underlying datasets) |
| 9-Month, 12-Month Precipitation | Precipitation is a key variable for monitoring drought that can be observed, modeled, or remotely sensed. Looking at multiple timescales can show short- and long-term precipitation deficits. | NOAA's nClimGrid-Monthly (Observation-based) | NOAA's National Water Prediction Service Applied Climate Information System (ACIS) |
| 1-Meter Soil Moisture | Soil moisture—the amount of water held in the pores of the soil—is a key variable for monitoring drought. Soil moisture can be observed (through monitoring stations), modeled, or remotely sensed and can be measured at a variety of depths. | NLDAS-2 Noah (Model-based), NLDAS-2 VIC (Model-based), NLDAS-2 SAC (Model-based) | NASA Short-term Prediction and Transition Center – Land Information System (SPoRT-LIS) (conditions compared to 1981-2013) Crop Condition and Soil Moisture Analytics Tool (Crop-CASMA) (compared to 2015–present) NASA GRACE Data Assimilation (compared to 1948-2012) NOAA's Climate Prediction Center (compared to 1991-2020) |
| Palmer Hydrological Drought Index (PHDI) | PHDI is a long-term drought index that that incorporates temperature and precipitation data and a physical water balance model to estimate relative dryness. The PHDI was designed to capture hydrological impacts (e.g., water storage, streamflow, and groundwater). | NOAA's nClimDiv-Monthly (Observation-based) | NOAA Historical Palmer Drought Indices |
| Palmer Modified Drought Index (PMDI) | PMDI is a standardized drought index that incorporates temperature and precipitation data and a physical water balance model to estimate relative dryness. | NOAA's nClimDiv-Monthly (Observation-based) | |
| 9-Month, 12-Month Standardized Precipitation-Evapotranspiration Index (SPEI) | SPEI is a drought index that takes into account both water supply (precipitation) and water demand (potential evapotranspiration, calculated using temperature). Warmer temperatures tend to increase evapotranspiration, which can dry the landscape. | NOAA's nClimGrid-Monthly (Observation-based) | High Plains Regional Climate Center ACIS Maps Climate Engine (create SPEI using different underlying datasets) |
| 1-Meter Soil Moisture | Soil moisture—the amount of water held in the pores of the soil—is a key variable for monitoring drought. Soil moisture can be observed (through monitoring stations), modeled, or remotely sensed and can be measured at a variety of depths. | NLDAS-2 Noah (Model-based), NLDAS-2 VIC (Model-based), NLDAS-2 Mosaic (Model-based), NLDAS-2 SAC (Model-based) | NASA Short-term Prediction and Transition Center – Land Information System (SPoRT-LIS) (conditions compared to 1981-2013) Crop Condition and Soil Moisture Analytics Tool (Crop-CASMA) (compared to 2015–present) NASA GRACE Data Assimilation (compared to 1948-2012) NOAA's Climate Prediction Center (compared to 1991-2020) |
| Groundwater | Groundwater is water that exists underground in saturated zones beneath the land surface. Groundwater is a major source of water supply for communities and agriculture and is a key variable for monitoring hydrological drought. | NASA GRACE Data Assimilation (Model-based) | U.S. Geological Survey (USGS) Water Data for the Nation |
| 12-Month Standardized Precipitation-Evapotranspiration Index (SPEI) | SPEI is a drought index that takes into account both water supply (precipitation) and water demand (potential evapotranspiration, calculated using temperature). Warmer temperatures tend to increase evapotranspiration, which can dry the landscape. | NOAA's nClimGrid-Monthly (Observation-based) | High Plains Regional Climate Center ACIS Maps Climate Engine (create SPEI using different underlying datasets) |
| 6-Month, 9-Month, 12-Month Standardized Precipitation Index (SPI) | SPI is a drought index that captures how observed precipitation deviates from the climatological average over a given time period. Looking at multiple timescales can show short- and long-term precipitation deficits. | NOAA's nClimGrid-Monthly (Observation-based) | High Plains Regional Climate Center ACIS Maps Southern Regional Climate Center Integrated Water Portal Climate Engine (create SPI using different underlying datasets) |
| Total Column Soil Moisture | Soil moisture—the amount of water held in the pores of the soil—is a key variable for monitoring drought. Soil moisture can be observed (through monitoring stations), modeled, or remotely sensed and can be measured at a variety of depths. | NLDAS-2 Noah (Model-based) | NASA Short-term Prediction and Transition Center – Land Information System (SPoRT-LIS) (conditions compared to 1981-2013) Crop Condition and Soil Moisture Analytics Tool (Crop-CASMA) (compared to 2015–present) NASA GRACE Data Assimilation (compared to 1948-2012) NOAA's Climate Prediction Center (compared to 1991-2020) |
| 6-Month, 9-Month, 12-Month, 24-Month Standardized Precipitation-Evapotranspiration Index (SPEI) | SPEI is a drought index that takes into account both water supply (precipitation) and water demand (potential evapotranspiration, calculated using temperature). Warmer temperatures tend to increase evapotranspiration, which can dry the landscape. | NOAA's nClimGrid-Monthly (Observation-based) | High Plains Regional Climate Center ACIS Maps Climate Engine (create SPEI using different underlying datasets) |
| 9-Month, 12-Month Precipitation | Precipitation is a key variable for monitoring drought that can be observed, modeled, or remotely sensed. Looking at multiple timescales can show short- and long-term precipitation deficits. | NOAA's nClimGrid-Monthly (Observation-based), IMERG (Integrated Multi-satellitE Retrievals for GPM) (Remotely sensed) | NOAA's National Water Prediction Service Applied Climate Information System (ACIS) Gridded Surface Meteorological Dataset (GridMET) |
| 9-Month, 12-Month, 24-Month, 36-Month, 48-Month Standardized Precipitation Index (SPI) | SPI is a drought index that captures how observed precipitation deviates from the climatological average over a given time period. Looking at multiple timescales can show short- and long-term precipitation deficits. | NOAA's nClimGrid-Monthly (Observation-based) | High Plains Regional Climate Center ACIS Maps Southern Regional Climate Center Integrated Water Portal Climate Engine (create SPI using different underlying datasets) |
| 12-Month, 36-Month, 48-Month Standardized Precipitation-Evapotranspiration Index (SPEI) | SPEI is a drought index that takes into account both water supply (precipitation) and water demand (potential evapotranspiration, calculated using temperature). Warmer temperatures tend to increase evapotranspiration, which can dry the landscape. | NOAA's nClimGrid-Monthly (Observation-based) | High Plains Regional Climate Center ACIS Maps Climate Engine (create SPEI using different underlying datasets) |
| 12-Month, 24-Month, 48-Month Precipitation | Precipitation is a key variable for monitoring drought that can be observed, modeled, or remotely sensed. Looking at multiple timescales can show short- and long-term precipitation deficits. | NOAA's nClimGrid-Monthly (Observation-based), IMERG (Integrated Multi-satellitE Retrievals for GPM) (Remotely sensed) | NOAA's National Water Prediction Service Applied Climate Information System (ACIS) Gridded Surface Meteorological Dataset (GridMET) |
| 1.6-Meter Soil Moisture | Soil moisture—the amount of water held in the pores of the soil—is a key variable for monitoring drought. Soil moisture can be observed (through monitoring stations), modeled, or remotely sensed and can be measured at a variety of depths. | NOAA's Climate Prediction Center (Model-based) | NASA Short-term Prediction and Transition Center – Land Information System (SPoRT-LIS) (conditions compared to 1981-2013) Crop Condition and Soil Moisture Analytics Tool (Crop-CASMA) (compared to 2015–present) North American Land Data Assimilation System (NLDAS) (compared to 1980-2007) NASA GRACE Data Assimilation (compared to 1948-2012) |
| 2-Month, 3-Month Standardized Precipitation Index (SPI) | SPI is a drought index that captures how observed precipitation deviates from the climatological average over a given time period. Looking at multiple timescales can show short- and long-term precipitation deficits. | NOAA's nClimGrid-Monthly (Observation-based) | High Plains Regional Climate Center ACIS Maps Southern Regional Climate Center Integrated Water Portal Climate Engine (create SPI using different underlying datasets) |
| 2-Month, 3-Month Precipitation | Precipitation is a key variable for monitoring drought that can be observed, modeled, or remotely sensed. Looking at multiple timescales can show short- and long-term precipitation deficits. | NOAA's nClimGrid-Monthly (Observation-based) | NOAA's National Water Prediction Service Applied Climate Information System (ACIS) |
| 3-Month Standardized Precipitation-Evapotranspiration Index (SPEI) | SPEI is a drought index that takes into account both water supply (precipitation) and water demand (potential evapotranspiration, calculated using temperature). Warmer temperatures tend to increase evapotranspiration, which can dry the landscape. | NOAA's nClimGrid-Monthly (Observation-based) | High Plains Regional Climate Center ACIS Maps Climate Engine (create SPEI using different underlying datasets) |
| 1-Meter Soil Moisture | Soil moisture—the amount of water held in the pores of the soil—is a key variable for monitoring drought. Soil moisture can be observed (through monitoring stations), modeled, or remotely sensed and can be measured at a variety of depths. | NLDAS-2 SAC (Model-based), NLDAS-2 VIC (Model-based), NLDAS-2 Mosaic (Model-based) | NASA Short-term Prediction and Transition Center – Land Information System (SPoRT-LIS) (conditions compared to 1981-2013) Crop Condition and Soil Moisture Analytics Tool (Crop-CASMA) (compared to 2015–present) NASA GRACE Data Assimilation (compared to 1948-2012) NOAA's Climate Prediction Center (compared to 1991-2020) |
| Runoff | Runoff—the measurement of the flow of water into a lake, stream or other body of water—is a key variable for determining water supply and monitoring hydrological drought. Runoff can be observed or modeled. | NLDAS-2 VIC (Model-based) | NASA Earthdata Runoff Resources SNOTEL (SNOw TELemetry) snow depth and snow water equivalent (SWE) data – Snowpack creates a natural reservoir for water, holding water over the winter and releasing it in spring |
| 6-Month, 9-Month Standardized Precipitation-Evapotranspiration Index (SPEI) | SPEI is a drought index that takes into account both water supply (precipitation) and water demand (potential evapotranspiration, calculated using temperature). Warmer temperatures tend to increase evapotranspiration, which can dry the landscape. | NOAA's nClimGrid-Monthly (Observation-based) | High Plains Regional Climate Center ACIS Maps Climate Engine (create SPEI using different underlying datasets) |
| 9-Month Precipitation | Precipitation is a key variable for monitoring drought that can be observed, modeled, or remotely sensed. Looking at multiple timescales can show short- and long-term precipitation deficits. | NOAA's nClimGrid-Monthly (Observation-based) | NOAA's National Water Prediction Service Applied Climate Information System (ACIS) |
| 9-Month Standardized Precipitation Index (SPI) | SPI is a drought index that captures how observed precipitation deviates from the climatological average over a given time period. Looking at multiple timescales can show short- and long-term precipitation deficits. | NOAA's nClimGrid-Monthly (Observation-based) | High Plains Regional Climate Center ACIS Maps Southern Regional Climate Center Integrated Water Portal Climate Engine (create SPI using different underlying datasets) |
| Total Column Soil Moisture | Soil moisture—the amount of water held in the pores of the soil—is a key variable for monitoring drought. Soil moisture can be observed (through monitoring stations), modeled, or remotely sensed and can be measured at a variety of depths. | NLDAS-2 Noah (Model-based), NLDAS-2 VIC (Model-based), NLDAS-2 SAC (Model-based) | NASA Short-term Prediction and Transition Center – Land Information System (SPoRT-LIS) (conditions compared to 1981-2013) Crop Condition and Soil Moisture Analytics Tool (Crop-CASMA) (compared to 2015–present) NASA GRACE Data Assimilation (compared to 1948-2012) NOAA's Climate Prediction Center (compared to 1991-2020) |
| 2-Month, 3-Month, 6-Month Standardized Precipitation-Evapotranspiration Index (SPEI) | SPEI is a drought index that takes into account both water supply (precipitation) and water demand (potential evapotranspiration, calculated using temperature). Warmer temperatures tend to increase evapotranspiration, which can dry the landscape. | NOAA's nClimGrid-Monthly (Observation-based) | High Plains Regional Climate Center ACIS Maps Climate Engine (create SPEI using different underlying datasets) |
| 2-Month, 3-Month Precipitation | Precipitation is a key variable for monitoring drought that can be observed, modeled, or remotely sensed. Looking at multiple timescales can show short- and long-term precipitation deficits. | NOAA's nClimGrid-Monthly (Observation-based), IMERG (Integrated Multi-satellitE Retrievals for GPM) (Remotely sensed) | NOAA's National Water Prediction Service Applied Climate Information System (ACIS) Gridded Surface Meteorological Dataset (GridMET) |
| Total Column Soil Moisture | Soil moisture—the amount of water held in the pores of the soil—is a key variable for monitoring drought. Soil moisture can be observed (through monitoring stations), modeled, or remotely sensed and can be measured at a variety of depths. | NLDAS-2 VIC (Model-based), NLDAS-2 Noah (Model-based) | NASA Short-term Prediction and Transition Center – Land Information System (SPoRT-LIS) (conditions compared to 1981-2013) Crop Condition and Soil Moisture Analytics Tool (Crop-CASMA) (compared to 2015–present) NASA GRACE Data Assimilation (compared to 1948-2012) NOAA's Climate Prediction Center (compared to 1991-2020) |
| 2-Month, 3-Month Standardized Precipitation-Evapotranspiration Index (SPEI) | SPEI is a drought index that takes into account both water supply (precipitation) and water demand (potential evapotranspiration, calculated using temperature). Warmer temperatures tend to increase evapotranspiration, which can dry the landscape. | NOAA's nClimGrid-Monthly (Observation-based) | High Plains Regional Climate Center ACIS Maps Climate Engine (create SPEI using different underlying datasets) |
| Total Column Soil Moisture | Soil moisture—the amount of water held in the pores of the soil—is a key variable for monitoring drought. Soil moisture can be observed (through monitoring stations), modeled, or remotely sensed and can be measured at a variety of depths. | NLDAS-2 Mosaic (Model-based), NLDAS-2 VIC (Model-based), NLDAS-2 Noah (Model-based) | NASA Short-term Prediction and Transition Center – Land Information System (SPoRT-LIS) (conditions compared to 1981-2013) Crop Condition and Soil Moisture Analytics Tool (Crop-CASMA) (compared to 2015–present) NASA GRACE Data Assimilation (compared to 1948-2012) NOAA's Climate Prediction Center (compared to 1991-2020) |
| 1-Meter Soil Moisture | Soil moisture—the amount of water held in the pores of the soil—is a key variable for monitoring drought. Soil moisture can be observed (through monitoring stations), modeled, or remotely sensed and can be measured at a variety of depths. | NLDAS-2 VIC (Model-based), NLDAS-2 Mosaic (Model-based) | NASA Short-term Prediction and Transition Center – Land Information System (SPoRT-LIS) (conditions compared to 1981-2013) Crop Condition and Soil Moisture Analytics Tool (Crop-CASMA) (compared to 2015–present) NASA GRACE Data Assimilation (compared to 1948-2012) NOAA's Climate Prediction Center (compared to 1991-2020) |
| 3-Month, 9-Month, 12-Month Precipitation | Precipitation is a key variable for monitoring drought that can be observed, modeled, or remotely sensed. Looking at multiple timescales can show short- and long-term precipitation deficits. | IMERG (Integrated Multi-satellitE Retrievals for GPM) (Remotely sensed), NOAA's nClimGrid-Monthly (Observation-based) | NOAA's National Water Prediction Service Applied Climate Information System (ACIS) |
| 6-Month Standardized Precipitation-Evapotranspiration Index (SPEI) | SPEI is a drought index that takes into account both water supply (precipitation) and water demand (potential evapotranspiration, calculated using temperature). Warmer temperatures tend to increase evapotranspiration, which can dry the landscape. | NOAA's nClimGrid-Monthly (Observation-based) | High Plains Regional Climate Center ACIS Maps Climate Engine (create SPEI using different underlying datasets) |
| 6-Month, 9-Month Standardized Precipitation Index (SPI) | SPI is a drought index that captures how observed precipitation deviates from the climatological average over a given time period. Looking at multiple timescales can show short- and long-term precipitation deficits. | NOAA's nClimGrid-Monthly (Observation-based) | High Plains Regional Climate Center ACIS Maps Southern Regional Climate Center Integrated Water Portal Climate Engine (create SPI using different underlying datasets) |
| Total Column Soil Moisture | Soil moisture—the amount of water held in the pores of the soil—is a key variable for monitoring drought. Soil moisture can be observed (through monitoring stations), modeled, or remotely sensed and can be measured at a variety of depths. | NLDAS-2 Mosaic (Model-based), NLDAS-2 SAC (Model-based), NLDAS-2 VIC (Model-based) | NASA Short-term Prediction and Transition Center – Land Information System (SPoRT-LIS) (conditions compared to 1981-2013) Crop Condition and Soil Moisture Analytics Tool (Crop-CASMA) (compared to 2015–present) NASA GRACE Data Assimilation (compared to 1948-2012) NOAA's Climate Prediction Center (compared to 1991-2020) |
| Runoff | Runoff—the measurement of the flow of water into a lake, stream or other body of water—is a key variable for determining water supply and monitoring hydrological drought. Runoff can be observed or modeled. | NLDAS-2 Mosaic (Model-based) | NASA Earthdata Runoff Resources SNOTEL (SNOw TELemetry) snow depth and snow water equivalent (SWE) data – Snowpack creates a natural reservoir for water, holding water over the winter and releasing it in spring |
| 3-Month Standardized Precipitation Index (SPI) | SPI is a drought index that captures how observed precipitation deviates from the climatological average over a given time period. Looking at multiple timescales can show short- and long-term precipitation deficits. | NOAA's nClimGrid-Monthly (Observation-based) | High Plains Regional Climate Center ACIS Maps Southern Regional Climate Center Integrated Water Portal Climate Engine (create SPI using different underlying datasets) |
| 3-Month Precipitation | Precipitation is a key variable for monitoring drought that can be observed, modeled, or remotely sensed. Looking at multiple timescales can show short- and long-term precipitation deficits. | IMERG (Integrated Multi-satellitE Retrievals for GPM) (Remotely sensed), NOAA's nClimGrid-Monthly (Observation-based) | NOAA's National Water Prediction Service Applied Climate Information System (ACIS) |
| Streamflow | Streamflow—the volume of water moving down a river or stream per unit of time—is a key variable for monitoring hydrological drought. As drought conditions persist, less water moves into and through streams. Streamflow can be observed or modeled. | NLDAS-2 VIC (Model-based) | NASA Earthdata Runoff Resources SNOTEL (SNOw TELemetry) snow depth and snow water equivalent (SWE) data – Snowpack creates a natural reservoir for water, holding water over the winter and releasing it in spring |
| Total Column Soil Moisture | Soil moisture—the amount of water held in the pores of the soil—is a key variable for monitoring drought. Soil moisture can be observed (through monitoring stations), modeled, or remotely sensed and can be measured at a variety of depths. | NLDAS-2 SAC (Model-based) | NASA Short-term Prediction and Transition Center – Land Information System (SPoRT-LIS) (conditions compared to 1981-2013) Crop Condition and Soil Moisture Analytics Tool (Crop-CASMA) (compared to 2015–present) NASA GRACE Data Assimilation (compared to 1948-2012) NOAA's Climate Prediction Center (compared to 1991-2020) |
| 1-Meter Soil Moisture | Soil moisture—the amount of water held in the pores of the soil—is a key variable for monitoring drought. Soil moisture can be observed (through monitoring stations), modeled, or remotely sensed and can be measured at a variety of depths. | NLDAS-2 VIC (Model-based) | NASA Short-term Prediction and Transition Center – Land Information System (SPoRT-LIS) (conditions compared to 1981-2013) Crop Condition and Soil Moisture Analytics Tool (Crop-CASMA) (compared to 2015–present) NASA GRACE Data Assimilation (compared to 1948-2012) NOAA's Climate Prediction Center (compared to 1991-2020) |
| 2-Month, 3-Month, 6-Month Standardized Precipitation Index (SPI) | SPI is a drought index that captures how observed precipitation deviates from the climatological average over a given time period. Looking at multiple timescales can show short- and long-term precipitation deficits. | NOAA's nClimGrid-Monthly (Observation-based) | High Plains Regional Climate Center ACIS Maps Southern Regional Climate Center Integrated Water Portal Climate Engine (create SPI using different underlying datasets) |
| 2-Month, 3-Month, 6-Month Precipitation | Precipitation is a key variable for monitoring drought that can be observed, modeled, or remotely sensed. Looking at multiple timescales can show short- and long-term precipitation deficits. | NOAA's nClimGrid-Monthly (Observation-based), IMERG (Integrated Multi-satellitE Retrievals for GPM) (Remotely sensed) | NOAA's National Water Prediction Service Applied Climate Information System (ACIS) Gridded Surface Meteorological Dataset (GridMET) |
| 2-Month, 3-Month Precipitation | Precipitation is a key variable for monitoring drought that can be observed, modeled, or remotely sensed. Looking at multiple timescales can show short- and long-term precipitation deficits. | NOAA's nClimGrid-Monthly (Observation-based), IMERG (Integrated Multi-satellitE Retrievals for GPM) (Remotely sensed) | NOAA's National Water Prediction Service Applied Climate Information System (ACIS) Gridded Surface Meteorological Dataset (GridMET) |
| Total Column Soil Moisture | Soil moisture—the amount of water held in the pores of the soil—is a key variable for monitoring drought. Soil moisture can be observed (through monitoring stations), modeled, or remotely sensed and can be measured at a variety of depths. | NLDAS-2 Mosaic (Model-based), NLDAS-2 SAC (Model-based), NLDAS-2 Noah (Model-based) | NASA Short-term Prediction and Transition Center – Land Information System (SPoRT-LIS) (conditions compared to 1981-2013) Crop Condition and Soil Moisture Analytics Tool (Crop-CASMA) (compared to 2015–present) NASA GRACE Data Assimilation (compared to 1948-2012) NOAA's Climate Prediction Center (compared to 1991-2020) |
| 1-Meter Soil Moisture | Soil moisture—the amount of water held in the pores of the soil—is a key variable for monitoring drought. Soil moisture can be observed (through monitoring stations), modeled, or remotely sensed and can be measured at a variety of depths. | NLDAS-2 Mosaic (Model-based) | NASA Short-term Prediction and Transition Center – Land Information System (SPoRT-LIS) (conditions compared to 1981-2013) Crop Condition and Soil Moisture Analytics Tool (Crop-CASMA) (compared to 2015–present) NASA GRACE Data Assimilation (compared to 1948-2012) NOAA's Climate Prediction Center (compared to 1991-2020) |
| Runoff | Runoff—the measurement of the flow of water into a lake, stream or other body of water—is a key variable for determining water supply and monitoring hydrological drought. Runoff can be observed or modeled. | NLDAS-2 Noah (Model-based) | NASA Earthdata Runoff Resources SNOTEL (SNOw TELemetry) snow depth and snow water equivalent (SWE) data – Snowpack creates a natural reservoir for water, holding water over the winter and releasing it in spring |
| 3-Month, 6-Month, 9-Month Standardized Precipitation-Evapotranspiration Index (SPEI) | SPEI is a drought index that takes into account both water supply (precipitation) and water demand (potential evapotranspiration, calculated using temperature). Warmer temperatures tend to increase evapotranspiration, which can dry the landscape. | NOAA's nClimGrid-Monthly (Observation-based) | High Plains Regional Climate Center ACIS Maps Climate Engine (create SPEI using different underlying datasets) |
| 6-Month, 9-Month Precipitation | Precipitation is a key variable for monitoring drought that can be observed, modeled, or remotely sensed. Looking at multiple timescales can show short- and long-term precipitation deficits. | IMERG (Integrated Multi-satellitE Retrievals for GPM) (Remotely sensed), NOAA's nClimGrid-Monthly (Observation-based) | NOAA's National Water Prediction Service Applied Climate Information System (ACIS) |
| Total Column Soil Moisture | Soil moisture—the amount of water held in the pores of the soil—is a key variable for monitoring drought. Soil moisture can be observed (through monitoring stations), modeled, or remotely sensed and can be measured at a variety of depths. | NLDAS-2 Mosaic (Model-based), NLDAS-2 SAC (Model-based) | NASA Short-term Prediction and Transition Center – Land Information System (SPoRT-LIS) (conditions compared to 1981-2013) Crop Condition and Soil Moisture Analytics Tool (Crop-CASMA) (compared to 2015–present) NASA GRACE Data Assimilation (compared to 1948-2012) NOAA's Climate Prediction Center (compared to 1991-2020) |
| 1-Meter Soil Moisture | Soil moisture—the amount of water held in the pores of the soil—is a key variable for monitoring drought. Soil moisture can be observed (through monitoring stations), modeled, or remotely sensed and can be measured at a variety of depths. | NLDAS-2 Mosaic (Model-based), NLDAS-2 SAC (Model-based) | NASA Short-term Prediction and Transition Center – Land Information System (SPoRT-LIS) (conditions compared to 1981-2013) Crop Condition and Soil Moisture Analytics Tool (Crop-CASMA) (compared to 2015–present) NASA GRACE Data Assimilation (compared to 1948-2012) NOAA's Climate Prediction Center (compared to 1991-2020) |
| 9-Month, 12-Month, 24-Month Precipitation | Precipitation is a key variable for monitoring drought that can be observed, modeled, or remotely sensed. Looking at multiple timescales can show short- and long-term precipitation deficits. | NOAA's nClimGrid-Monthly (Observation-based), IMERG (Integrated Multi-satellitE Retrievals for GPM) (Remotely sensed) | NOAA's National Water Prediction Service Applied Climate Information System (ACIS) Gridded Surface Meteorological Dataset (GridMET) |
| 9-Month, 24-Month Standardized Precipitation-Evapotranspiration Index (SPEI) | SPEI is a drought index that takes into account both water supply (precipitation) and water demand (potential evapotranspiration, calculated using temperature). Warmer temperatures tend to increase evapotranspiration, which can dry the landscape. | NOAA's nClimGrid-Monthly (Observation-based) | High Plains Regional Climate Center ACIS Maps Climate Engine (create SPEI using different underlying datasets) |
| 9-Month, 24-Month Standardized Precipitation Index (SPI) | SPI is a drought index that captures how observed precipitation deviates from the climatological average over a given time period. Looking at multiple timescales can show short- and long-term precipitation deficits. | NOAA's nClimGrid-Monthly (Observation-based) | High Plains Regional Climate Center ACIS Maps Southern Regional Climate Center Integrated Water Portal Climate Engine (create SPI using different underlying datasets) |
| 12-Month Evaporative Demand Drought Index (EDDI) | EDDI is a drought index that uses temperature, wind speed, humidity, and solar radiation to estimate the atmospheric evaporative demand (the thirst of the atmosphere). Increased evapotranspiration can dry the landscape, reducing available water. | NOAA's Physical Sciences Laboratory and National Weather Service Climate Prediction Center (Model-based) | NOAA's Physical Sciences Laboratory Climate Engine (create EDDI using different underlying datasets) |
| Runoff | Runoff—the measurement of the flow of water into a lake, stream or other body of water—is a key variable for determining water supply and monitoring hydrological drought. Runoff can be observed or modeled. | NLDAS-2 Noah (Model-based), NLDAS-2 Mosaic (Model-based) | NASA Earthdata Runoff Resources SNOTEL (SNOw TELemetry) snow depth and snow water equivalent (SWE) data – Snowpack creates a natural reservoir for water, holding water over the winter and releasing it in spring |
| 6-Month Precipitation | Precipitation is a key variable for monitoring drought that can be observed, modeled, or remotely sensed. Looking at multiple timescales can show short- and long-term precipitation deficits. | NOAA's nClimGrid-Monthly (Observation-based) | NOAA's National Water Prediction Service Applied Climate Information System (ACIS) |
| Streamflow | Streamflow—the volume of water moving down a river or stream per unit of time—is a key variable for monitoring hydrological drought. As drought conditions persist, less water moves into and through streams. Streamflow can be observed or modeled. | NLDAS-2 Noah (Model-based) | NASA Earthdata Runoff Resources SNOTEL (SNOw TELemetry) snow depth and snow water equivalent (SWE) data – Snowpack creates a natural reservoir for water, holding water over the winter and releasing it in spring |
| 6-Month Standardized Precipitation Index (SPI) | SPI is a drought index that captures how observed precipitation deviates from the climatological average over a given time period. Looking at multiple timescales can show short- and long-term precipitation deficits. | NOAA's nClimGrid-Monthly (Observation-based) | High Plains Regional Climate Center ACIS Maps Southern Regional Climate Center Integrated Water Portal Climate Engine (create SPI using different underlying datasets) |
| 6-Month, 9-Month, 12-Month Precipitation | Precipitation is a key variable for monitoring drought that can be observed, modeled, or remotely sensed. Looking at multiple timescales can show short- and long-term precipitation deficits. | NOAA's nClimGrid-Monthly (Observation-based) | NOAA's National Water Prediction Service Applied Climate Information System (ACIS) |
| 3-Month Precipitation | Precipitation is a key variable for monitoring drought that can be observed, modeled, or remotely sensed. Looking at multiple timescales can show short- and long-term precipitation deficits. | NOAA's nClimGrid-Monthly (Observation-based) | NOAA's National Water Prediction Service Applied Climate Information System (ACIS) |
| 1-Meter Soil Moisture | Soil moisture—the amount of water held in the pores of the soil—is a key variable for monitoring drought. Soil moisture can be observed (through monitoring stations), modeled, or remotely sensed and can be measured at a variety of depths. | NLDAS-2 Noah (Model-based), NLDAS-2 VIC (Model-based), NLDAS-2 Mosaic (Model-based) | NASA Short-term Prediction and Transition Center – Land Information System (SPoRT-LIS) (conditions compared to 1981-2013) Crop Condition and Soil Moisture Analytics Tool (Crop-CASMA) (compared to 2015–present) NASA GRACE Data Assimilation (compared to 1948-2012) NOAA's Climate Prediction Center (compared to 1991-2020) |
| 3-Month, 6-Month Standardized Precipitation Index (SPI) | SPI is a drought index that captures how observed precipitation deviates from the climatological average over a given time period. Looking at multiple timescales can show short- and long-term precipitation deficits. | NOAA's nClimGrid-Monthly (Observation-based) | High Plains Regional Climate Center ACIS Maps Southern Regional Climate Center Integrated Water Portal Climate Engine (create SPI using different underlying datasets) |
| 3-Month, 6-Month Precipitation | Precipitation is a key variable for monitoring drought that can be observed, modeled, or remotely sensed. Looking at multiple timescales can show short- and long-term precipitation deficits. | NOAA's nClimGrid-Monthly (Observation-based) | NOAA's National Water Prediction Service Applied Climate Information System (ACIS) |
| Total Column Soil Moisture | Soil moisture—the amount of water held in the pores of the soil—is a key variable for monitoring drought. Soil moisture can be observed (through monitoring stations), modeled, or remotely sensed and can be measured at a variety of depths. | NLDAS-2 Noah (Model-based), NLDAS-2 Mosaic (Model-based) | NASA Short-term Prediction and Transition Center – Land Information System (SPoRT-LIS) (conditions compared to 1981-2013) Crop Condition and Soil Moisture Analytics Tool (Crop-CASMA) (compared to 2015–present) NASA GRACE Data Assimilation (compared to 1948-2012) NOAA's Climate Prediction Center (compared to 1991-2020) |
| 3-Month, 6-Month, 9-Month Precipitation | Precipitation is a key variable for monitoring drought that can be observed, modeled, or remotely sensed. Looking at multiple timescales can show short- and long-term precipitation deficits. | NOAA's nClimGrid-Monthly (Observation-based) | NOAA's National Water Prediction Service Applied Climate Information System (ACIS) |
| 6-Month, 12-Month Standardized Precipitation Index (SPI) | SPI is a drought index that captures how observed precipitation deviates from the climatological average over a given time period. Looking at multiple timescales can show short- and long-term precipitation deficits. | NOAA's nClimGrid-Monthly (Observation-based) | High Plains Regional Climate Center ACIS Maps Southern Regional Climate Center Integrated Water Portal Climate Engine (create SPI using different underlying datasets) |
| 6-Month, 12-Month Standardized Precipitation-Evapotranspiration Index (SPEI) | SPEI is a drought index that takes into account both water supply (precipitation) and water demand (potential evapotranspiration, calculated using temperature). Warmer temperatures tend to increase evapotranspiration, which can dry the landscape. | NOAA's nClimGrid-Monthly (Observation-based) | High Plains Regional Climate Center ACIS Maps Climate Engine (create SPEI using different underlying datasets) |
| 6-Month, 12-Month Precipitation | Precipitation is a key variable for monitoring drought that can be observed, modeled, or remotely sensed. Looking at multiple timescales can show short- and long-term precipitation deficits. | NOAA's nClimGrid-Monthly (Observation-based), IMERG (Integrated Multi-satellitE Retrievals for GPM) (Remotely sensed) | NOAA's National Water Prediction Service Applied Climate Information System (ACIS) Gridded Surface Meteorological Dataset (GridMET) |
| Streamflow | Streamflow—the volume of water moving down a river or stream per unit of time—is a key variable for monitoring hydrological drought. As drought conditions persist, less water moves into and through streams. Streamflow can be observed or modeled. | NLDAS-2 Mosaic (Model-based) | NASA Earthdata Runoff Resources SNOTEL (SNOw TELemetry) snow depth and snow water equivalent (SWE) data – Snowpack creates a natural reservoir for water, holding water over the winter and releasing it in spring |
| 3-Month, 6-Month Standardized Precipitation-Evapotranspiration Index (SPEI) | SPEI is a drought index that takes into account both water supply (precipitation) and water demand (potential evapotranspiration, calculated using temperature). Warmer temperatures tend to increase evapotranspiration, which can dry the landscape. | NOAA's nClimGrid-Monthly (Observation-based) | High Plains Regional Climate Center ACIS Maps Climate Engine (create SPEI using different underlying datasets) |
| 1-Meter Soil Moisture | Soil moisture—the amount of water held in the pores of the soil—is a key variable for monitoring drought. Soil moisture can be observed (through monitoring stations), modeled, or remotely sensed and can be measured at a variety of depths. | NLDAS-2 SAC (Model-based) | NASA Short-term Prediction and Transition Center – Land Information System (SPoRT-LIS) (conditions compared to 1981-2013) Crop Condition and Soil Moisture Analytics Tool (Crop-CASMA) (compared to 2015–present) NASA GRACE Data Assimilation (compared to 1948-2012) NOAA's Climate Prediction Center (compared to 1991-2020) |
| Total Column Soil Moisture | Soil moisture—the amount of water held in the pores of the soil—is a key variable for monitoring drought. Soil moisture can be observed (through monitoring stations), modeled, or remotely sensed and can be measured at a variety of depths. | NLDAS-2 SAC (Model-based), NLDAS-2 Noah (Model-based) | NASA Short-term Prediction and Transition Center – Land Information System (SPoRT-LIS) (conditions compared to 1981-2013) Crop Condition and Soil Moisture Analytics Tool (Crop-CASMA) (compared to 2015–present) NASA GRACE Data Assimilation (compared to 1948-2012) NOAA's Climate Prediction Center (compared to 1991-2020) |
| 9-Month, 12-Month, 24-Month Standardized Precipitation Index (SPI) | SPI is a drought index that captures how observed precipitation deviates from the climatological average over a given time period. Looking at multiple timescales can show short- and long-term precipitation deficits. | NOAA's nClimGrid-Monthly (Observation-based) | High Plains Regional Climate Center ACIS Maps Southern Regional Climate Center Integrated Water Portal Climate Engine (create SPI using different underlying datasets) |
| 9-Month, 12-Month, 24-Month Precipitation | Precipitation is a key variable for monitoring drought that can be observed, modeled, or remotely sensed. Looking at multiple timescales can show short- and long-term precipitation deficits. | NOAA's nClimGrid-Monthly (Observation-based) | NOAA's National Water Prediction Service Applied Climate Information System (ACIS) |
| 1-Meter Soil Moisture | Soil moisture—the amount of water held in the pores of the soil—is a key variable for monitoring drought. Soil moisture can be observed (through monitoring stations), modeled, or remotely sensed and can be measured at a variety of depths. | NLDAS-2 Noah (Model-based), NLDAS-2 Mosaic (Model-based) | NASA Short-term Prediction and Transition Center – Land Information System (SPoRT-LIS) (conditions compared to 1981-2013) Crop Condition and Soil Moisture Analytics Tool (Crop-CASMA) (compared to 2015–present) NASA GRACE Data Assimilation (compared to 1948-2012) NOAA's Climate Prediction Center (compared to 1991-2020) |
| 6-Month, 12-Month, 24-Month Standardized Precipitation Index (SPI) | SPI is a drought index that captures how observed precipitation deviates from the climatological average over a given time period. Looking at multiple timescales can show short- and long-term precipitation deficits. | NOAA's nClimGrid-Monthly (Observation-based) | High Plains Regional Climate Center ACIS Maps Southern Regional Climate Center Integrated Water Portal Climate Engine (create SPI using different underlying datasets) |
| 6-Month, 12-Month Precipitation | Precipitation is a key variable for monitoring drought that can be observed, modeled, or remotely sensed. Looking at multiple timescales can show short- and long-term precipitation deficits. | NOAA's nClimGrid-Monthly (Observation-based) | NOAA's National Water Prediction Service Applied Climate Information System (ACIS) |
| 6-Month, 9-Month, 12-Month, 24-Month, 36-Month Standardized Precipitation-Evapotranspiration Index (SPEI) | SPEI is a drought index that takes into account both water supply (precipitation) and water demand (potential evapotranspiration, calculated using temperature). Warmer temperatures tend to increase evapotranspiration, which can dry the landscape. | NOAA's nClimGrid-Monthly (Observation-based) | High Plains Regional Climate Center ACIS Maps Climate Engine (create SPEI using different underlying datasets) |
| 9-Month, 12-Month, 24-Month, 36-Month Precipitation | Precipitation is a key variable for monitoring drought that can be observed, modeled, or remotely sensed. Looking at multiple timescales can show short- and long-term precipitation deficits. | NOAA's nClimGrid-Monthly (Observation-based) | NOAA's National Water Prediction Service Applied Climate Information System (ACIS) |
| 9-Month, 12-Month, 24-Month, 36-Month Standardized Precipitation-Evapotranspiration Index (SPEI) | SPEI is a drought index that takes into account both water supply (precipitation) and water demand (potential evapotranspiration, calculated using temperature). Warmer temperatures tend to increase evapotranspiration, which can dry the landscape. | NOAA's nClimGrid-Monthly (Observation-based) | High Plains Regional Climate Center ACIS Maps Climate Engine (create SPEI using different underlying datasets) |
| 12-Month, 24-Month, 36-Month, 48-Month Precipitation | Precipitation is a key variable for monitoring drought that can be observed, modeled, or remotely sensed. Looking at multiple timescales can show short- and long-term precipitation deficits. | NOAA's nClimGrid-Monthly (Observation-based), IMERG (Integrated Multi-satellitE Retrievals for GPM) (Remotely sensed) | NOAA's National Water Prediction Service Applied Climate Information System (ACIS) Gridded Surface Meteorological Dataset (GridMET) |
| 12-Month, 24-Month, 36-Month, 48-Month Standardized Precipitation Index (SPI) | SPI is a drought index that captures how observed precipitation deviates from the climatological average over a given time period. Looking at multiple timescales can show short- and long-term precipitation deficits. | NOAA's nClimGrid-Monthly (Observation-based) | High Plains Regional Climate Center ACIS Maps Southern Regional Climate Center Integrated Water Portal Climate Engine (create SPI using different underlying datasets) |