Drought Expands Again Across the Southern Plains. Spring Rainfall Will Help.
Key Points
- Texas and Oklahoma are currently facing significant drought challenges across multiple regions, affecting rangelands and water supplies and increasing wildfire risk.
- Recent rain in east-central Kansas improved conditions, but the rest of the state has been exceptionally dry.
- Western Kansas is Abnormally Dry (D0), and Moderate to Severe Drought (D1-D2) persists and along the Kansas/Oklahoma border.
- Drought in western Kansas is likely to expand and intensify through early spring.
- A significant multi-day storm system is bringing heavy rainfall to the South-Central U.S., with more than 3 inches forecast in some locations.
- This is the first substantial storm this spring.
- This precipitation will likely provide some relief to drought-affected areas in Texas, Oklahoma, and southeast Kansas, while the High Plains will remain relatively dry.
- Long-range forecasts suggest that temperatures are likely to remain above normal over the next three months.
- Sub-seasonal outlooks favor a warm and wet pattern for the Southern Plains, and NOAA’s Climate Prediction Center forecasts drought improvement in eastern parts of the region in April.
- Late spring and summer is the wettest time of year for the Southern Plains.
This update is based on data available as of Thursday, April 2, 2026 at 8:00 a.m. CT. We acknowledge that conditions are evolving.
Current drought conditions in the Southern plains, according to the March 31 U.S. Drought Monitor. The U.S. Drought Monitor depicts the location and intensity of drought across the country using 5 classifications: Abnormally Dry (D0), showing areas that may be going into or are coming out of drought, and four levels of drought (D1–D4). The U.S. Drought Monitor is a joint effort of the National Drought Mitigation Center, U.S. Department of Agriculture, National Oceanic and Atmospheric Administration, and National Aeronautics and Space Administration.
7-day Quantitative Precipitation Forecast for April 2–9, 2026. This precipitation forecast map shows the amount of liquid precipitation (in inches) expected to fall, according to the National Weather Service.
A drought index combines multiple drought indicators (e.g., precipitation, temperature, soil moisture) to depict drought conditions. For some products, like the U.S. Drought Monitor, authors combine their analysis of drought indicators with input from local observers. Other drought indices, like the Standardized Precipitation Index (SPI), use an objective calculation to describe the severity, location, timing, and/or duration of drought.
Learn MorePeriods of drought can lead to inadequate water supply, threatening the health, safety, and welfare of communities. Streamflow, groundwater, reservoir, and snowpack data are key to monitoring and forecasting water supply.
Learn MoreDrought can reduce the water availability and water quality necessary for productive farms, ranches, and grazing lands, resulting in significant negative direct and indirect economic impacts to the agricultural sector. Monitoring agricultural drought typically focuses on examining levels of precipitation, evaporative demand, soil moisture, and surface/groundwater quantity and quality.
Learn MoreU.S. Drought Monitor Categories
D0 - Abnormally Dry
Abnormally Dry (D0) indicates a region that is going into or coming out of drought, according to the U.S. Drought Monitor.
D1 – Moderate Drought
Moderate Drought (D1) is the first of four drought categories (D1–D4), according to the U.S. Drought Monitor.
D2 – Severe Drought
Severe Drought (D2) is the second of four drought categories (D1–D4), according to the U.S. Drought Monitor.
D3 – Extreme Drought
Extreme Drought (D3) is the third of four drought categories (D1–D4), according to the U.S. Drought Monitor.
D4 – Exceptional Drought
Exceptional Drought (D4) is the most intense drought category, according to the U.S. Drought Monitor.
Total Area in Drought (D1–D4)
Percent area of the Southern Plains that is currently in drought (D1–D4), according to the U.S. Drought Monitor.
Predicted Inches of Precipitation
Less than 0.01 inch
0.01 to 0.1 inch
0.1 to 0.25 inch
0.25 to 0.5 inch
0.5 to 0.75 inch
0.75 to 1 inch
1 to 1.25 inches
1.25 to 1.5 inches
1.5 to 1.75 inches
1.75 to 2 inches
1.5 to 2 inches
2 to 2.5 inches
2.5 to 3 inches
3 to 4 inches
4 to 5 inches
5 to 7 inches
7 to 10 inches
10 to 15 inches
15 to 20 inches
More than 20 inches
Current drought conditions in the Southern plains, according to the March 31 U.S. Drought Monitor. The U.S. Drought Monitor depicts the location and intensity of drought across the country using 5 classifications: Abnormally Dry (D0), showing areas that may be going into or are coming out of drought, and four levels of drought (D1–D4). The U.S. Drought Monitor is a joint effort of the National Drought Mitigation Center, U.S. Department of Agriculture, National Oceanic and Atmospheric Administration, and National Aeronautics and Space Administration.
7-day Quantitative Precipitation Forecast for April 2–9, 2026. This precipitation forecast map shows the amount of liquid precipitation (in inches) expected to fall, according to the National Weather Service.
The U.S. Drought Monitor is updated weekly on Thursday mornings, with data valid through the previous Tuesday morning.
The National Weather Service updates its Quantitative Precipitation Forecast twice a day. This map is valid as of 7 a.m. CDT on April 2.
A drought index combines multiple drought indicators (e.g., precipitation, temperature, soil moisture) to depict drought conditions. For some products, like the U.S. Drought Monitor, authors combine their analysis of drought indicators with input from local observers. Other drought indices, like the Standardized Precipitation Index (SPI), use an objective calculation to describe the severity, location, timing, and/or duration of drought.
Learn MorePeriods of drought can lead to inadequate water supply, threatening the health, safety, and welfare of communities. Streamflow, groundwater, reservoir, and snowpack data are key to monitoring and forecasting water supply.
Learn MoreDrought can reduce the water availability and water quality necessary for productive farms, ranches, and grazing lands, resulting in significant negative direct and indirect economic impacts to the agricultural sector. Monitoring agricultural drought typically focuses on examining levels of precipitation, evaporative demand, soil moisture, and surface/groundwater quantity and quality.
Learn MoreCurrent Conditions and Impacts for the Southern Plains
- March is typically fairly dry across the Southern Plains. It begins the transition from a typically drier winter (January and February are the driest months, on average) to a typically wetter late spring and summer (May and June are the wettest months, on average).
- March monthly precipitation totals can have a wide range depending on if the larger spring rains begin in late March or early April.
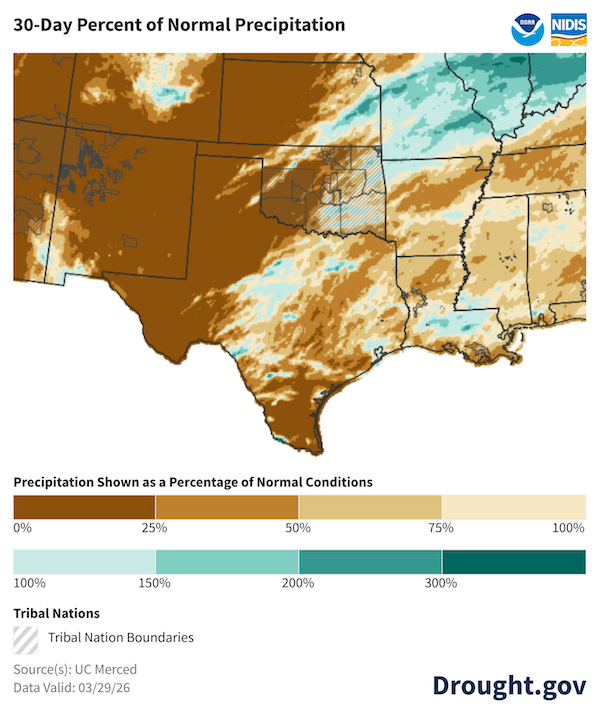
- So far, spring rain has been very low, and March has been among the driest on record.
- Drought conditions have intensified in Texas and Oklahoma over the past month. As of March 31, 89% of Texas and 99% of Oklahoma are in drought, according to the U.S. Drought Monitor. Recent rain in east-central Kansas improved conditions, but the rest of the state has been exceptionally dry.
- In March 2026, significant drought and unseasonably warm, windy conditions impacted agriculture, water supplies, and fire:
- Intensified drought and low commodity prices forced some South Texas farmers to cease operations. Winter wheat and oats were severely stressed, with many fields being "grazed out" by livestock rather than harvested for grain.
- Combined capacity at Lake Corpus Christi and Choke Canyon Reservoirs fell below 9%, the lowest level on record. Along the Rio Grande, Elephant Butte Reservoir is at 12.6%, Amistad is at 31.4%, and Falcon is at 19.2% of capacity.
- As of March 23, 2026, over 1.1 million acres across the High Plains have been burned by wildfires. The Morrill Fire in Nebraska and the Ranger Road Fire in Kansas and Oklahoma were especially destructive and have disrupted the livestock market.
- While final numbers are not in yet, for large parts of the region, including western Kansas, Oklahoma, and the Texas Panhandle, March is likely to rank as the warmest on record.
- Some weather stations surpassed the previous March record by a full degree (F).
- This follows the warmest winter on record for Oklahoma and Texas and second warmest for Kansas.
- February 2026 was the warmest February on record for Oklahoma, second warmest for Texas, and third warmest for Kansas.
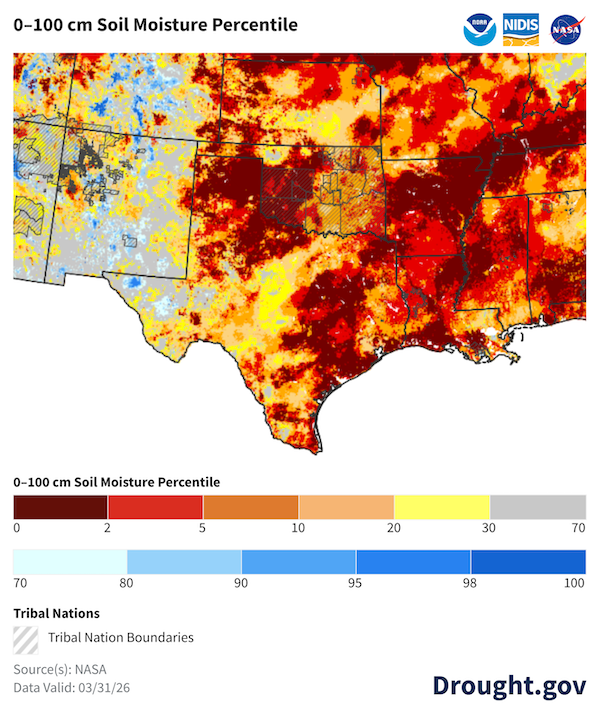
- Soil moisture across most of Texas, Oklahoma, and western Kansas is below the 10th percentile.
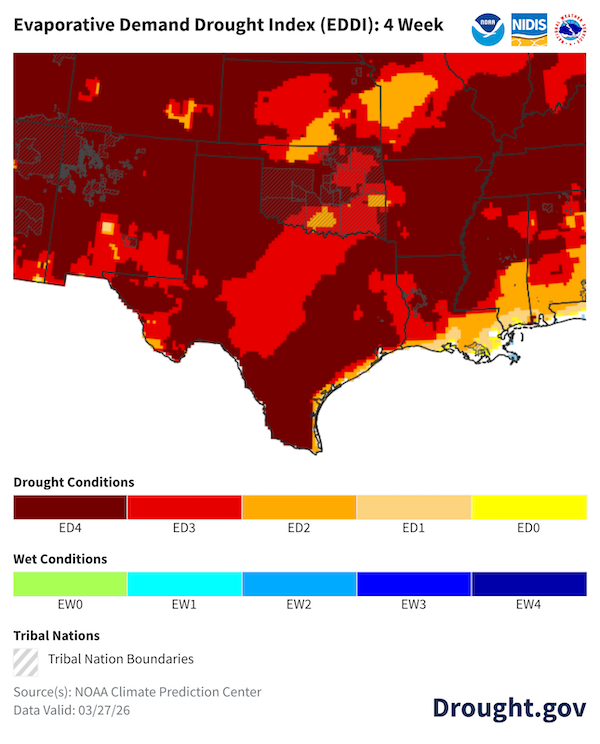
- The Evaporative Demand Drought Index (EDDI) remained exceptionally high for much of the region in March. Unusually high evaporative demand (the “thirst of the atmosphere”) can lead to drying of the landscape, even when precipitation has been near normal.
30-Day Precipitation Near 0 Inches for Western Texas
High Evaporative Demand Compounds Existing Dry Conditions
Soil Moisture Across Texas, Oklahoma, and Kansas Is Below the 10th Percentile for March
Outlooks and Potential Impacts in the Southern Plains
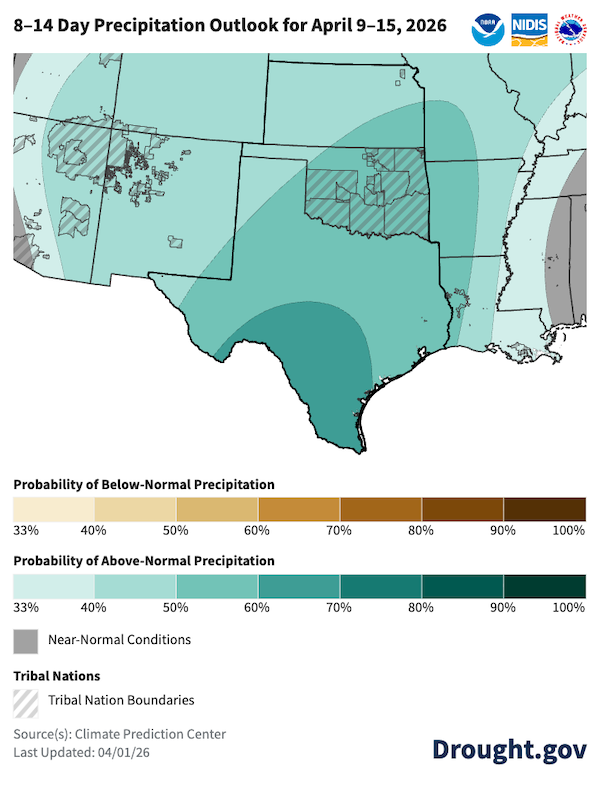
- The National Weather Service Climate Prediction Center’s 6-10 and 8-14 day outlooks favor warm and possibly wet weather across the Southern Plains, signaling a pattern shift in early April.
- One to three inches of rain fell across central Texas and Oklahoma in the 24 hours leading up to 7 a.m. CT on April 2, the National Weather Service reports. More rain is expected through the first week of April.
- Parts of central and eastern Oklahoma and Texas should see some short-term drought improvement from this shift.
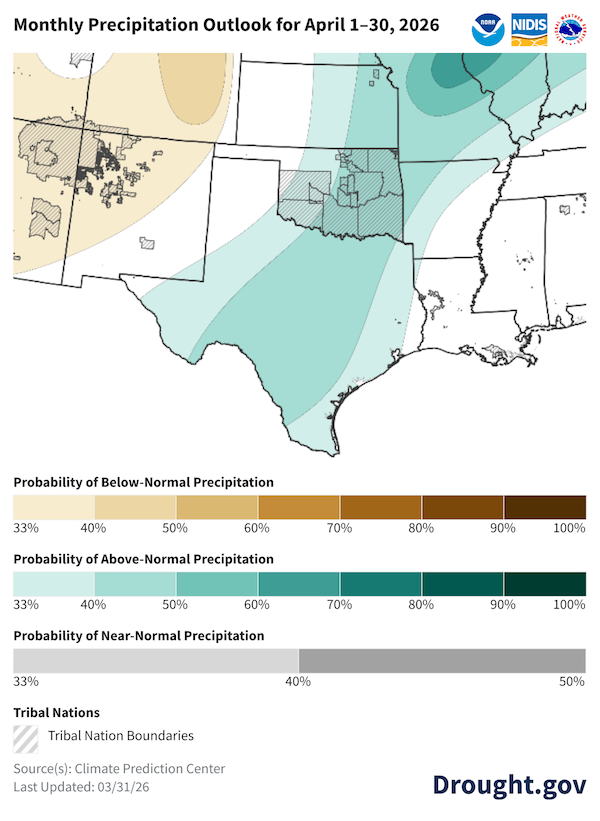
- April climate outlooks for the Southern Plains show slightly elevated chances of above-normal precipitation for central Texas and eastern Oklahoma and Kansas with near equal chances of above-, near-, or below-normal precipitation elsewhere. Above-normal temperatures for the month are likely across the whole region.
- Spring is typically a wetter season than winter across the Southern Plains states, and spring weather patterns can make or break a drought. The April to June outlooks show below-normal precipitation is most likely (33-40% chance) for western Kansas and the Oklahoma and Texas Panhandles. A warm spring is likely (more than 50% chance) for most of Texas and Oklahoma, with lower odds (30-40%) favoring above-normal temperatures for Kansas.
- An El Niño Watch is in place.
- El Niño conditions, which historically increase chances of wet winters in the Southern Plains, are likely to develop over the summer.
- El Niño has the strongest influence during the winter months, usually (but not always) bringing wet weather to Texas. Sometimes, when El Niño is present in the summer, there is an eastward shift to the Southwest Monsoon.
- Learn more about what El Niño could mean for drought in the Southern Plains.
- El Niño conditions, which historically increase chances of wet winters in the Southern Plains, are likely to develop over the summer.
Wet Weather in in Early April Should Bring Short-Term Drought Improvement
April, As A Whole, Slightly Favors Wetter Conditions
Additional Resources
Recent Reports
- March Snow Drought Update for the West
- New NOAA El Niño-Southern Oscillation Index Supports Drought Early Warning
- El Niño on the Horizon: Can the Warm Phase End Six Years of Drought in the Southern Plains of the U.S.?
- Quarterly Climate Impacts and Outlook for the Southern Region - March 2026
Additional Resources by State
More local information is available from the following resources:
- Your state climatologist
- Your state page on Drought.gov:
- National Weather Service Drought Information Statements:
- March 31, 2026: Goodland, Kansas
- March 30, 2026: Tulsa, Oklahoma
- March 29, 2026: Dodge City, Kansas
- March 26, 2026: Lake Charles, Louisiana
- March 25, 2026: Fort Worth/Dallas, Texas
- March 22, 2026: Wichita, Kansas
- March, 19, 2026: Brownsville, Texas
- March 19, 2026: Shreveport, Louisiana
- March 6, 2026: El Paso, Texas/Santa Teresa, New Mexico
- March 5, 2026: Austin/San Antonio, Texas
- March 5, 2026: Houston/Galveston, Texas
- March 3, 2026: Corpus Christi, Texas
More state and regional information is available from the following resources:
- Kansas: Climate and Drought in Kansas; Kansas Water Office; State Climate Office
- Oklahoma: Oklahoma Water Resources Board | Drought Monitoring; Oklahoma Mesonet Drought Tools; State Climate Office
- Texas: Texas Water Development Board | Drought; Texas Commission on Environmental Quality | Drought in Texas; Drought Dashboard: Water Data for Texas; Water Data for Texas | Texas Reservoirs; State Climate Office
- Regional: Southern Regional Climate Center, High Plains Regional Climate Center; Southern Climate Impacts Planning Program (SCIPP)
To report or view local drought impact information:
Prepared By
Joel Lisonbee
Cooperative Institute for Research in Environmental Sciences/University of Colorado Boulder and NOAA’s National Integrated Drought Information System, Southern Plains Drought Early Warning System
John Nielsen-Gammon and B.J. Baule
Office of the Texas State Climatologist, Southern Regional Climate Center, Texas A&M University
Gary McManus
Oklahoma Climatological Survey, State Climatologist
Matt Sittel
Kansas State Climate Office
This Drought Status Update is issued in partnership between the National Oceanic and Atmospheric Administration (NOAA) and partners to communicate a potential area of concern for drought expansion and/or development within the Southern Plains Drought Early Warning System region based on recent conditions and the upcoming forecast. NIDIS and its partners will issue future Drought Status Updates as conditions evolve. NIDIS is an interagency program within the Climate Program Office, which is part of NOAA’s Office of Oceanic and Atmospheric Research.