Snow drought still covers much of the western U.S., with the worst conditions in the northern Rocky Mountains.
Key Points
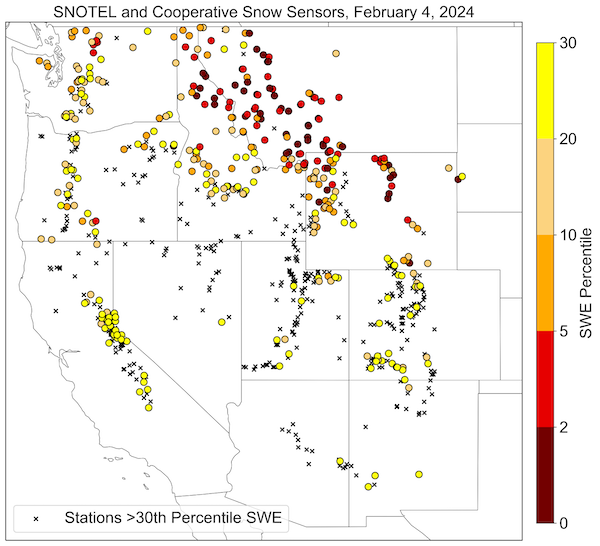
- While the spatial extent of snow drought in the western U.S. decreased since early January, snow water equivalent (SWE) remains below normal at 78% of stations in the West as of February 4, 2024.
- The worst conditions are in the northern Rocky Mountains, including the Missouri River Headwaters.
- A recent rain-on-snow event and a winter heat wave in the Cascade Range intensified warm snow drought conditions.
- Storms are likely to continue to improve conditions over the next couple weeks in the Southwest while the Northwest leans dry during this time period, consistent with a typical El Niño winter pattern.
Snow Telemetry (SNOTEL) snow water equivalent (SWE) values for watersheds in the western U.S. as a percentage of the 1991–2020 median recorded by the USDA Natural Resources Conservation Service (NRCS). Only stations with at least 20 years of data are included in the station averages.
The SWE percent of normal, in this figure and in the text, represents the current SWE at selected SNOTEL stations in or near the basin compared to the median value for those stations on the same date from 1991–2020. This map is valid through the end of the day February 4, 2024.
For an interactive version of this map, please visit NRCS.
Snow Telemetry (SNOTEL) and snow course snow water equivalent (SWE) values for watersheds in Alaska as a percentage of the 1991–2020 median recorded by the USDA Natural Resources Conservation Service (NRCS). Only stations with at least 20 years of data are included in the station averages.
The SWE percentage of normal, in this figure and in the text, represents the current SWE at selected SNOTEL stations in or near the basin compared to the median value for those stations on the same date. This map is valid through the end of the day on February 4, 2024.
For an interactive version of this map, please visit NRCS.
Percent of Median Snow Water Equivalent
< 50% of Median
Current snow water equivalent (SWE) is less than 50% of the median SWE value for this day of the year, compared to historical conditions from 1991–2020.
50%–70% of Median
Current snow water equivalent (SWE) is between 50%–70% of the median SWE value for this day of the year, compared to historical conditions from 1991–2020.
70%–90% of Median
Current snow water equivalent (SWE) is between 70%–90% of the median SWE value for this day of the year, compared to historical conditions from 1991–2020.
90%–110% of Median
Current snow water equivalent (SWE) is between 90%–110% of the median SWE value for this day of the year, compared to historical conditions from 1991–2020.
110%–130% of Median
Current snow water equivalent (SWE) is between 110%–130% of the median SWE value for this day of the year, compared to historical conditions from 1991–2020.
130%–150% of Median
Current snow water equivalent (SWE) is between 130%–150% of the median SWE value for this day of the year, compared to historical conditions from 1991–2020.
>150% of Median
Current snow water equivalent (SWE) is greater than 150% of the median SWE value for this day of the year, compared to historical conditions from 1991–2020.
Snow Telemetry (SNOTEL) snow water equivalent (SWE) values for watersheds in the western U.S. as a percentage of the 1991–2020 median recorded by the USDA Natural Resources Conservation Service (NRCS). Only stations with at least 20 years of data are included in the station averages.
The SWE percent of normal, in this figure and in the text, represents the current SWE at selected SNOTEL stations in or near the basin compared to the median value for those stations on the same date from 1991–2020. This map is valid through the end of the day February 4, 2024.
For an interactive version of this map, please visit NRCS.
Snow Telemetry (SNOTEL) and snow course snow water equivalent (SWE) values for watersheds in Alaska as a percentage of the 1991–2020 median recorded by the USDA Natural Resources Conservation Service (NRCS). Only stations with at least 20 years of data are included in the station averages.
The SWE percentage of normal, in this figure and in the text, represents the current SWE at selected SNOTEL stations in or near the basin compared to the median value for those stations on the same date. This map is valid through the end of the day on February 4, 2024.
For an interactive version of this map, please visit NRCS.
An updated, interactive version of this map is available through the USDA's Natural Resources Conservation Service.
An updated, interactive version of this map is available through the USDA's Natural Resources Conservation Service.
Snow Drought Conditions Summary for February 4
This update is based on data available up to Sunday, February 4, 2024 at 12:00 a.m. We acknowledge that conditions are evolving.
Across the western U.S. as of February 4, 2024, the spatial extent of snow drought has decreased since early January. However, snow water equivalent (SWE) is still below normal at 78% of stations in the West. The worst snow drought conditions continue to be in western Montana, northern Wyoming, northern Idaho, and western Washington (Olympic Mountains and west slope of the Cascades) and the Rio Hondo basin in southeastern New Mexico, where ongoing dry conditions led to record low SWE for early February at many stations. After several snow-producing storms in early and mid-January, conditions deteriorated in much of the Cascade Range, where a rain-on-snow event followed by extremely warm temperatures led to widespread SWE losses. Storms over the past week improved snowpack conditions in the Sierra Nevada, Great Basin, Colorado River Basin and the Rio Grande Basin, although some areas still remain in snow drought (especially the Sierra Nevada).
Jump to conditions for your region:
- Rocky Mountain Snow Conditions
- New Mexico and Arizona Snow Conditions
- Cascade Range Snow Conditions
- Sierra Nevada and Great Basin Snow Conditions
- Alaska Snow Conditions
Stations with SWE Below the 30th Percentile in the Western U.S.
Key Takeaway: Snow water equivalent (SWE) remains below the 30th percentile at 52% of stations in the western U.S. The worst snow drought conditions are in western Montana, northern Wyoming, northern Idaho, and western Washington.
Rocky Mountain Snow Conditions
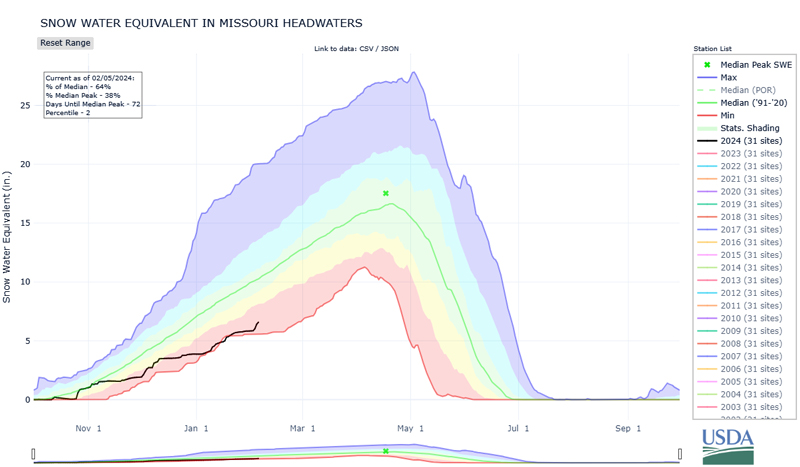
In the Rocky Mountains, snow drought conditions are worst in western Montana, northern Idaho, and northern Wyoming (i.e., northern Rocky Mountains). Conditions generally are better further south. Observations at the level of HUC 6 basins in the northern Rocky Mountains indicate 40%–65% of normal SWE, with many individual stations reporting record low SWE. For example, the Missouri River Headwaters basin (encompassing 31 SNOTEL stations) is currently at 64% of normal SWE and at the second percentile. As of February 1, measurements at several long-term snow courses in western Montana with 50–90 years of data also indicated record low SWE.
Snow Water Equivalent in the Missouri River Headwaters
Key Takeaway: Snow drought is present in the northern Rocky Mountains, including the Missouri River Headwaters basin (64% of normal).
In Colorado and Utah, SWE in most HUC 6 basins ranges from 90%–100% of normal. Snow drought is more prevalent in southern Colorado, where the Rio Grande basin is at 78% of normal SWE and the Upper San Juan basin is at 84% of normal, with several SNOTEL stations reporting less than 70% of normal SWE.
New Mexico and Arizona Snow Conditions
Snowpack conditions in New Mexico and Arizona are generally near-to-above normal, with just a handful of SNOTEL stations reporting snow drought conditions. Average SWE within HUC 6 basins ranges from 76% of normal in the Rio Grande-Caballo basin (two SNOTEL stations used) to 135% of normal in the Rio Grande-Elephant Butte basin. Conditions in the San Juan and Rio Chama basins are also only 78% and 79% of median, respectively. Conditions generally improved since early January, especially in Arizona, as several storm cycles driven by a strong subtropical jet stream (typical of moderate or strong El Niño conditions)) produced heavy snowfall in the mountains. Conditions are likely to continue to improve over the next week as several more storms progress through the region.
Cascade Range Snow Conditions
Through the first week of January, SWE conditions across Oregon and Washington were far below average and at or near record lows at several SNOTEL stations. Several mid-elevation ski resorts were unable to open due to lack of snow. Major improvements in snow drought conditions occurred during the first half of January as a series of cold and snowy storms brought most of the Oregon Cascade Range and southern Washington Cascade Range to above-normal SWE. However, the bountiful SWE conditions were short-lived as a period of above-freezing temperatures and rain-on-snow events significantly reduced the snowpack. Soon after, a mid-winter heat wave occurred, with mean average temperatures 8–10 degrees Fahrenheit above normal over the last week of January. Overnight low temperatures remained well above freezing during this period, and SWE loss continued for several days without any precipitation. A warm system on January 27–28 brought rain to high elevations and reduced SWE. Prolonged snowmelt occurred even at high-elevation SNOTEL stations (5,000–6,000 feet). For example, Mt Hood Test Site, Oregon, at 5,370 feet lost nearly four inches of SWE from January 27 through February 5.
Snowpack is currently below normal across most of the Cascade Range. The worst snow drought conditions are on the west slopes in Washington and in the Olympic Mountains, where many SNOTEL stations are reporting less than 50% of normal SWE. Conditions in the Cascade Range in southern Oregon are better, with some SNOTEL stations reporting above-normal SWE. However, in Klamath County, warmer temperatures during the latter half of January and precipitation falling mostly as rain resulted in substantial melting of the snowpack at SNOTEL stations in the Sprague and Williamson river basins. A second area of concern for snow drought are the Blue and Wallowa Mountains in northeast Oregon, where three SNOTEL sites are currently at record low SWE.
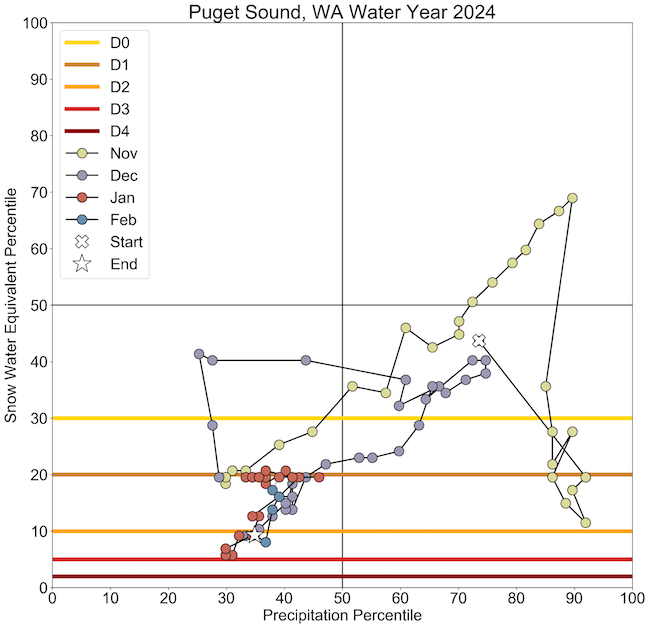
Snow Drought Phase Diagrams for Puget Sound, Washington
Key Takeaway: Combined warm and dry snow drought conditions are present in the Puget Sound Basin with ninth percentile SWE and 35th percentile accumulated precipitation. The daily evolution shows warm snow drought beginning in mid-December transitioning to warm and dry snow drought by the end of December until present.
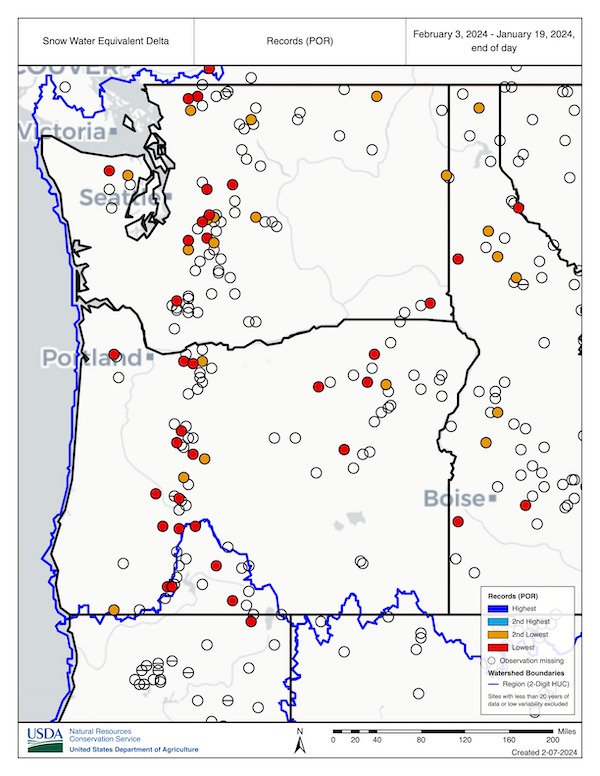
Snow Water Equivalent Delta from January 19 - February 3, 2024
Key Takeaway: Record SWE loss occurred from late January through early February in Washington and Oregon due to a combination of rain-on-snow events followed by warm and sunny conditions. Many locations lost 2-6 inches of SWE during this period.
Sierra Nevada and Great Basin Snow Conditions
Conditions in the Sierra Nevada have improved since early January, although many SNOTEL sites still report less than 60% of normal SWE as of February 4, 2024. Early and mid January brought a series of small storms and incremental SWE increases, but no major storms occurred. The biggest storm cycle of the season is ongoing at the time of writing and will likely deliver 1–4 feet of snow throughout much of the Sierra Nevada, depending on elevation. Snow drought conditions should continue to improve this week, but a drying trend is forecasted for next week.
Snowpack remains above normal for most of the Great Basin. The Black Rock Desert and the Humboldt Basins in northern Nevada are currently at 126% and 128% of normal SWE, respectively. The Harney Basin in southeast Oregon is at 107% of normal SWE, and the Great Salt Lake Basin in Utah is at 97% of normal SWE.
Alaska Snow Conditions
Snow drought concerns remain minimal throughout the monitored regions of Alaska based on SNOTEL and snow course observations. SWE in HUC 6 basins in south-central Alaska ranges from 132%–152% of normal. Upper Tsaina SNOTEL, in the Chugach Mountains, is reporting record SWE for the date (23.7 inches) based on a 20 year record, and is now at 112% of the median peak SWE that typically occurs in late April. Webcams suggest there is little snow at higher elevations in southern Southeast Alaska, although seasonal precipitation is near to above normal. Most community hydropower and potable water supplies in southern Southeast Alaska are modest, so there is the potential for impacts later in spring and summer depending on temperatures and precipitation.
* Quantifying snow drought values is an ongoing research effort. Here we have used the 30th percentile as a starting point based on partner expertise and research. Get more information on the current definition of snow drought.
For More Information, Please Contact:
Daniel McEvoy
Western Regional Climate Center
Daniel.McEvoy@dri.edu
Amanda Sheffield
NOAA/NIDIS/CIRES California-Nevada Regional Drought Information Coordinator
Amanda.Sheffield@noaa.gov
Britt Parker
NOAA/NIDIS Pacific Northwest Regional Drought Information Coordinator
Britt.Parker@noaa.gov
Gretel Follingstad
NOAA/NIDIS/CIRES Intermountain West Regional Drought Information Coordinator
Gretel.Follingstad@noaa.gov
NIDIS and its partners launched this snow drought effort in 2018 to provide data, maps, and tools for monitoring snow drought and its impacts as well as communicating the status of snow drought across the United States, including Alaska. Thank you to our partners for your continued support of this effort and review of these updates. If you would like to report snow drought impacts, please use the link below. Information collected will be shared with the states affected to help us better understand the short term, long term, and cumulative impacts of snow drought to the citizens and the economy of the regions reliant on snowpack.
Report Your Snow Drought Impacts
Data and Maps | Snow Drought
Research and Learn | Snow Drought

