Combined poor peak snowpack and/or rapid spring melt rates lead to western drought expansion and degradation.
Key Points
- Widespread warm and dry conditions since the start of spring have led to rapid snowmelt across the continental West. The Oregon Cascades have seen particularly rapid degradations.
- The poor snowpack plus rapid snowmelt has left areas of the West with not just low snow water equivalent (SWE) compared to normal for this date, but almost no SWE at all, including California at just 6% of normal and the Lower Colorado at just 4% of normal.
- Western streamflows, runoff efficiencies, soil moisture, and reservoirs are running below normal, resulting in post-winter impacts like elevated early season fire danger.
This USDA Natural Resources Conservation Service (NRCS) map shows Snow Telemetry (SNOTEL) snow water equivalent (SWE) basin values over the western U.S. as a percent of the NRCS 1981–2010 median. Only stations with at least 20 years of data are included in the station averages.
The SWE percent of normal represents the current SWE found at selected SNOTEL sites in or near the basin compared to the average value for those sites on this day. This map is valid as of May 9, 2021.
For an interactive version of this map, please visit NRCS.
This USDA Natural Resources Conservation Service (NRCS) map shows Snow Telemetry (SNOTEL) and Snow Course snow water equivalent (SWE) basin values over Alaska as a percent of the NRCS 1981–2010 median. Only stations with at least 20 years of data are included in the station averages.
The SWE percent of normal represents the current SWE found at selected SNOTEL and Snow Course sites in or near the basin compared to the average value for those sites on this day. This map is valid through the end of April 2021.
For an interactive version of this map, please visit NRCS.
SWE Percent of NRCS 1981-2010 Median
This USDA Natural Resources Conservation Service (NRCS) map shows Snow Telemetry (SNOTEL) snow water equivalent (SWE) basin values over the western U.S. as a percent of the NRCS 1981–2010 median. Only stations with at least 20 years of data are included in the station averages.
The SWE percent of normal represents the current SWE found at selected SNOTEL sites in or near the basin compared to the average value for those sites on this day. This map is valid as of May 9, 2021.
For an interactive version of this map, please visit NRCS.
This USDA Natural Resources Conservation Service (NRCS) map shows Snow Telemetry (SNOTEL) and Snow Course snow water equivalent (SWE) basin values over Alaska as a percent of the NRCS 1981–2010 median. Only stations with at least 20 years of data are included in the station averages.
The SWE percent of normal represents the current SWE found at selected SNOTEL and Snow Course sites in or near the basin compared to the average value for those sites on this day. This map is valid through the end of April 2021.
For an interactive version of this map, please visit NRCS.
Snow Drought Update for May 13, 2021
Widespread warm and dry conditions since March have led to rapid snowmelt and snow drought degradations across the continental West. By early May lower elevation sites across the region are typically snow free; however, higher elevation melt out dates can range from late May to late June. For example, on May 10, typically 31% of Western U.S. stations have melted out, and this year is 36%. At the HUC6 river basin scale, a large area of snow water equivalent (SWE) that is less than 50% of normal for this date presently covers California, Nevada, Utah, Arizona, New Mexico, southwest Colorado, southern Idaho, and southern Oregon. Statewide, California sits at just 6% of normal (based on Department of Water Resources automated snow pillows), and this season currently ties as the 5th soonest melt since the USDA Natural Resources Conservation Service (NRCS) records began in 1981. The Great Basin is at 32% of normal, Upper Colorado at 58% of normal, Lower Colorado at 4% of normal, Rio Grande at 42% of normal, and Pacific Northwest at 84% of normal. On the other hand, May 1 NRCS reports showed near- to much above-normal snowpack in the Kenai and Chugach Mountains and at elevation in the Panhandle of Alaska.
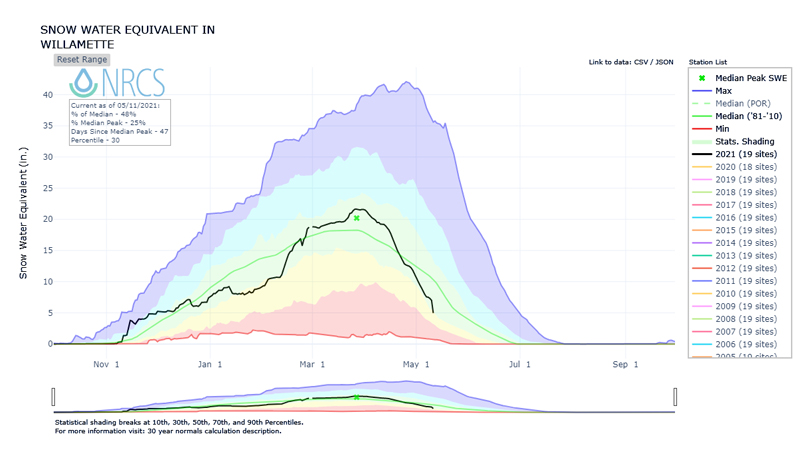
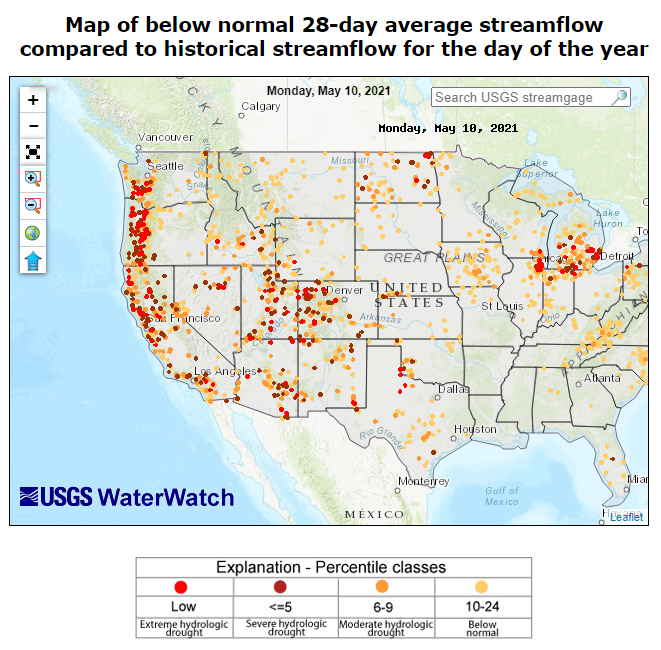
The states of Idaho, Montana, Oregon, and Washington have seen extremely low statewide precipitation totals for the months of March and April. In the 127-year PRISM precipitation record (1895 to 2021), only 1924 and 1926 have been drier in both Idaho and Oregon. The Oregon Cascades have seen particularly rapid degradations in SWE percent of normal and also general drought conditions in the region since early April. For example, the Willamette Basin was at 118% of normal SWE on April 1 and currently (May 11) sits at just 45% of normal. Precipitation in the region has been about 40% of normal since the start of spring with well above-normal temperatures since the start of April, which has led to rapid SWE declines. The 28-day streamflow percentiles on the west side of the Cascades, even extending into central Washington, are well below normal and record low in some cases. This case illustrates how both (1) April 1 SWE will not always be a good indicator of spring water supply and drought conditions and (2) snow drought onset can occur after peak SWE.
Combined poor peak SWE and and/or rapid spring melt rates across the West have led to a continued expansion and degradation of general drought conditions. Streamflows, runoff efficiencies, soil moisture, and reservoirs are running below normal, resulting in post-winter impacts like elevated early season fire danger. As of May 6, 84% of the West was in drought based on the U.S. Drought Monitor with 21% of the area in Exceptional Drought (D4).
Snow Water Equivalent and Soil Saturation in the Willamette Basin
Below-Normal Streamflow Conditions: May 10, 2021
For More Information, Please Contact:
Daniel McEvoy
Western Regional Climate Center
Daniel.McEvoy@dri.edu
Amanda Sheffield
NOAA/NIDIS California-Nevada Regional Drought Information Coordinator
Amanda.Sheffield@noaa.gov
Britt Parker
NOAA/NIDIS Pacific Northwest and Missouri River Basin Regional Drought Information Coordinator
Britt.Parker@noaa.gov
NIDIS and its partners launched this snow drought effort in 2018 to provide data, maps, and tools for monitoring snow drought and its impacts as well as communicating the status of snow drought across the United States, including Alaska. Thank you to our partners for your continued support of this effort and review of these updates. If you would like to report snow drought impacts, please use the link below. Information collected will be shared with the states affected to help us better understand the short term, long term, and cumulative impacts of snow drought to the citizens and the economy of the regions reliant on snowpack.
Report your Snow Drought Impacts Data and Maps | Snow Drought Research and Learn | Snow Drought

