A series of cold winter storms in the western United States led to a substantial reduction in the severity of snow drought.
Key Points
- Extreme, and in some cases record breaking, snowfall across much of the West led to recent, rapid recovery from snow drought.
- As of January 10, 21% of SNOTEL stations are reporting below-normal snow water equivalent (SWE), compared to 74% on December 14.
- Small areas of snow drought remain in the eastern Rocky Mountains.
- Below-normal precipitation and snowfall are forecast across much of the western coastal states over the next 1–2 weeks, but the December and early January snowfall should mitigate a return to snow drought during this time period. However, continued dry conditions into February could lead to a recurrence of snow drought.
Snow Telemetry (SNOTEL) snow water equivalent (SWE) values for watersheds in the western U.S. as a percent of the USDA Natural Resources Conservation Service (NRCS) 1991–2020 median. Only stations with at least 20 years of data are included in the station averages.
The SWE percent of normal represents the current SWE at selected SNOTEL stations in or near the basin compared to the average value for those stations on this day. This map is valid as of January 10, 2022.
For an interactive version of this map, please visit NRCS.
Snow Telemetry (SNOTEL) snow water equivalent (SWE) values in watersheds in Alaska as a percent of the USDA Natural Resources Conservation Service (NRCS) 1991–2020 median. Only stations with at least 20 years of data are included in the station averages.
The SWE percent of normal represents the current SWE at selected SNOTEL stations and Snow Course sites in or near the basin compared to the average value for those sites on this day. This map is valid as of January 10, 2022.
For an interactive version of this map, please visit NRCS.
SWE Percent of NRCS 1991-2020 Median
Snow Telemetry (SNOTEL) snow water equivalent (SWE) values for watersheds in the western U.S. as a percent of the USDA Natural Resources Conservation Service (NRCS) 1991–2020 median. Only stations with at least 20 years of data are included in the station averages.
The SWE percent of normal represents the current SWE at selected SNOTEL stations in or near the basin compared to the average value for those stations on this day. This map is valid as of January 10, 2022.
For an interactive version of this map, please visit NRCS.
Snow Telemetry (SNOTEL) snow water equivalent (SWE) values in watersheds in Alaska as a percent of the USDA Natural Resources Conservation Service (NRCS) 1991–2020 median. Only stations with at least 20 years of data are included in the station averages.
The SWE percent of normal represents the current SWE at selected SNOTEL stations and Snow Course sites in or near the basin compared to the average value for those sites on this day. This map is valid as of January 10, 2022.
For an interactive version of this map, please visit NRCS.
Snow Drought Update for January 13, 2022
This update is based on data available up to Tuesday, January 11, 2022 at 12:00 a.m. We acknowledge that additional snow is currently falling, and conditions are changing.
After a slow start to the snow season, a series of cold winter storms impacted the western U.S. from mid-December through early January. These storms led to a substantial reduction in the spatial extent of snow drought compared to a month ago. As of January 10, 21% of SNOTEL stations are reporting below-normal snow water equivalent (SWE), compared to 74% below normal that was reported in the last update on December 14.
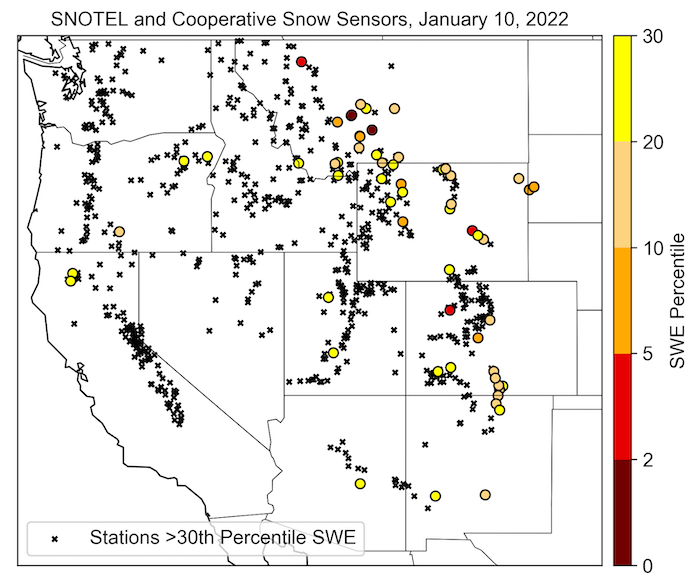
The small areas that remain in snow drought are primarily in the eastern Rocky Mountains, including the Sangre de Cristo Mountains straddling the border of New Mexico and Colorado, portions of the Bighorn Mountains in north central Wyoming, and scattered stations throughout northwest Wyoming and the eastern extent of the Rocky Mountains in Montana. Two SNOTEL stations, both near Bozeman, Montana, reported record low SWE for January 10. SWE at Pickfoot Creek in the Bigbelt Mountains is the lowest on record since 1979, and SWE at South Fork Shields in the Crazy Mountains is the lowest on record since 1981.
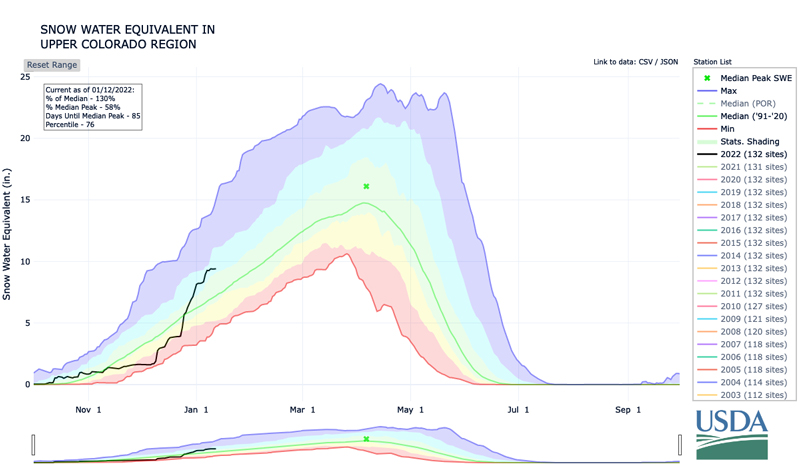
Extreme, and in some cases record breaking, snowfall across much of the West led to rapid snow drought recovery during the past few weeks. In the northern Sierra Nevada Mountains in California, Donner Pass received 214 inches (544 cm) of snowfall in December. December 2021 was the snowiest December at that location since the Central Sierra Snow Lab began keeping records in 1970. The Sierra Nevada currently has about 140%–180% of normal SWE. The Upper Colorado River Basin greatly benefited from these storms as well, and now has 130% of normal SWE compared to 75% of normal SWE just a month ago. The Pacific Northwest also has well above normal SWE. Recent cold storms and heavy snowfall led to the highest or second-highest SWE on record at a cluster of SNOTEL stations, mostly at lower elevations, in the northern Oregon and southern Washington Cascade Mountains.
Below-normal precipitation and snowfall are forecast across much of the western coastal states over the next 1–2 weeks, but the December and early January snowfall should mitigate a return to snow drought during this time period. However, continued dry conditions into February could lead to a recurrence of snow drought.
Alaskan monitoring locations show a range of SWE values from slightly below normal to record-setting highs. SNOTEL stations with lower SWE include several in the Kenai Peninsula that are reporting 80%–85% of normal SWE and the Susitna Valley, north of Anchorage, which currently has 64% of normal SWE. A small area near Valdez also has well below normal snowpack. Further inland, a series of potent storms during the second half of December led to record high SWE at three of six SNOTEL sites in the mountains northeast of Fairbanks; all six stations in the area are above 200% of normal SWE. A storm system brought heavy snowfall to southeast Alaska during January 8–11 with major impacts to local communities. A local disaster emergency was declared in Yakutat due to structure damages, including roof collapses from heavy snow and ice loads after up to six feet of new snowfall. Further south in Juneau, schools were closed for three days in a row due to ice- and snow-related hazards.
Stations with SWE Below the 30th Percentile
Upper Colorado Region: Snow Water Equivalent
* Quantifying snow drought values is an ongoing research effort. Here we have used the 30th percentile as a starting point based on partner expertise. Get more information on the current definition of snow drought here.
For More Information, Please Contact:
Daniel McEvoy
Western Regional Climate Center
Daniel.McEvoy@dri.edu
Amanda Sheffield
NOAA/NIDIS California-Nevada Regional Drought Information Coordinator
Amanda.Sheffield@noaa.gov
Britt Parker
NOAA/NIDIS Pacific Northwest and Missouri River Basin Regional Drought Information Coordinator
Britt.Parker@noaa.gov
NIDIS and its partners launched this snow drought effort in 2018 to provide data, maps, and tools for monitoring snow drought and its impacts as well as communicating the status of snow drought across the United States, including Alaska. Thank you to our partners for your continued support of this effort and review of these updates. If you would like to report snow drought impacts, please use the link below. Information collected will be shared with the states affected to help us better understand the short term, long term, and cumulative impacts of snow drought to the citizens and the economy of the regions reliant on snowpack.
Report Your Snow Drought Impacts Data and Maps | Snow Drought Research and Learn | Snow Drought

