Soil Moisture
Soil moisture plays an important role in agricultural monitoring, drought and flood forecasting, forest fire prediction, water supply management, and other natural resource activities. Soil moisture observations can forewarn of impending drought or flood conditions before other more standard indicators are triggered.
What Is Soil Moisture?

As defined by the AMS Glossary of Meteorology, soil moisture is “the total amount of water, including the water vapor, in an unsaturated soil.” Soil moisture—sometimes also called soil water—represents the water in land surfaces that is not in rivers, lakes, or groundwater, but instead resides in the pores of the soil. The level of soil moisture is determined by a host of factors beyond weather conditions, including soil type and associated vegetation. In turn, soil moisture levels affect a range of soil and plant dynamics. Surface soil moisture is the water that is in the upper 10 cm of soil, whereas root zone soil moisture is the water that is available to plants—generally considered to be in the upper 200 cm of soil.
Data, Maps, and Tools
The amount of soil moisture can have significantly different implications depending on location, season, soil type, and depth. For example, the same absolute value of soil moisture can indicate a serious drought in the Southeast, while it represents normal soils in the Southwest. Interpreting soil moisture data requires assessing and maintaining a range of other “metadata,” particularly soil characteristics. It also means that more than one unit of measure may be needed to adequately describe conditions, including not only “volumetric water” (the volume of water present), but also anomalies, daily ranking percentages, etc.
The techniques for monitoring soil moisture are undergoing rapid growth and innovation with the advent of new in situ and proximal sensors, new satellite and other remote sensing technologies, and enhanced modeling capabilities. This is leading to an increasing number of soil moisture data products in development.
An accurate depiction of soil moisture conditions can provide valuable insights for agricultural monitoring, weather prediction, and drought and flood early warning.
This map shows the moisture content of the top 1 meter of soil compared to historical conditions from 1981–2013, based on NASA's Short-term Prediction and Transition Center – Land Information System (SPoRT-LIS).
Red and orange hues indicate drier soils, while greens and blues indicate greater soil moisture.
An accurate depiction of soil moisture conditions can provide valuable insights for agricultural monitoring, weather prediction, and drought and flood early warning.
This map shows the moisture content of the top 1 meter of soil, according to NASA's Crop Condition and Soil Moisture Analytics tool (Crop-CASMA). It relies on remotely sensed soil moisture data derived from NASA missions.
Soil moisture is shown as a deviation from average soil moisture conditions from 2015–present. Brown hues indicate below-average soil moisture, and blue hues indicate above-average soil moisture.
The GRACE-Based Root Zone Soil Moisture Drought Indicator describes the current wet or dry conditions of the top 1 meter of soil, expressed as a percentile showing the probability of occurrence within the period of record from 1948 to 2014. This product is based on terrestrial water storage observations derived from NASA GRACE satellite data and integrated with other observations, using a sophisticated numerical model of land surface water and energy processes.
Red and orange hues indicate drier soil moisture conditions, while blue hues indicate wetter conditions.
Soil moisture plays an important role in drought and flood forecasting, agricultural monitoring, forest fire prediction, water supply management, and other natural resource activities. Soil moisture observations can forewarn of impending drought or flood conditions before other more standard indicators are triggered.
Learn MoreFlash drought is the rapid onset or intensification of drought. Unlike slow-evolving drought, which is caused by a decline in precipitation, flash drought occurs when low precipitation is accompanied by abnormally high temperatures, high winds, and/or changes in radiation. These sometimes-rapid changes can quickly raise evapotranspiration rates and remove available water from the landscape.
Learn MoreDrought can reduce the water availability and water quality necessary for productive farms, ranches, and grazing lands, resulting in significant negative direct and indirect economic impacts to the agricultural sector. Monitoring agricultural drought typically focuses on examining levels of precipitation, evaporative demand, soil moisture, and surface/groundwater quantity and quality.
Learn MoreDrought can result in reduced growth rates, increased stress on vegetation, and alterations or transformations to the plant community and/or the entire ecosystem. During periods of drought, plants increase their demand for water through increased evapotranspiration and longer growing seasons.
Learn MoreSoil moisture plays an important role in drought and flood forecasting, agricultural monitoring, forest fire prediction, water supply management, and other natural resource activities. Soil moisture observations can forewarn of impending drought or flood conditions before other more standard indicators are triggered.
Learn MoreSoil moisture plays an important role in drought and flood forecasting, agricultural monitoring, forest fire prediction, water supply management, and other natural resource activities. Soil moisture observations can forewarn of impending drought or flood conditions before other more standard indicators are triggered.
Learn MoreFlash drought is the rapid onset or intensification of drought. Unlike slow-evolving drought, which is caused by a decline in precipitation, flash drought occurs when low precipitation is accompanied by abnormally high temperatures, high winds, and/or changes in radiation. These sometimes-rapid changes can quickly raise evapotranspiration rates and remove available water from the landscape.
Learn MoreDrought can reduce the water availability and water quality necessary for productive farms, ranches, and grazing lands, resulting in significant negative direct and indirect economic impacts to the agricultural sector. Monitoring agricultural drought typically focuses on examining levels of precipitation, evaporative demand, soil moisture, and surface/groundwater quantity and quality.
Learn MoreDrought can result in reduced growth rates, increased stress on vegetation, and alterations or transformations to the plant community and/or the entire ecosystem. During periods of drought, plants increase their demand for water through increased evapotranspiration and longer growing seasons.
Learn More0–100 cm Soil Moisture Percentile
0–2nd Percentile
Soil moisture at 0–100cm depth is in the bottom 2% (0–2nd percentile) of historical measurements for this day of the year. Learn more.
2nd–5th Percentile
Soil moisture at 0–100cm depth falls between the 2nd to 5th percentile of historical measurements for this day of the year. Learn more.
5th–10th Percentile
Soil moisture at 0–100cm depth falls between the 5th to 10th percentile of historical measurements for this day of the year. Learn more.
10th–20th Percentile
Soil moisture at 0–100cm depth falls between the 10th to 20th percentile of historical measurements for this day of the year. Learn more.
20th–30th Percentile
Soil moisture at 0–100cm depth falls between the 20th to 30th percentile of historical measurements for this day of the year. Learn more.
30th–70th Percentile
Soil moisture at 0–100cm depth falls between the 30th to 70th percentile of historical measurements for this day of the year. Learn more.
70th–80th Percentile
Soil moisture at 0–100cm depth falls between the 70th to 80th percentile of historical measurements for this day of the year. Learn more.
80th–90th Percentile
Soil moisture at 0–100cm depth falls between the 80th to 90th percentile of historical measurements for this day of the year. Learn more.
90th–95th Percentile
Soil moisture at 0–100cm depth falls between the 90th to 95th percentile of historical measurements for this day of the year. Learn more.
95th–98th Percentile
Soil moisture at 0–100cm depth falls between the 95th to 98th percentile of historical measurements for this day of the year. Learn more.
98th–100th Percentile
Soil moisture at 0–100cm depth is in the top 2% (98th to 100th percentile) of historical measurements for this day of the year. Learn more.
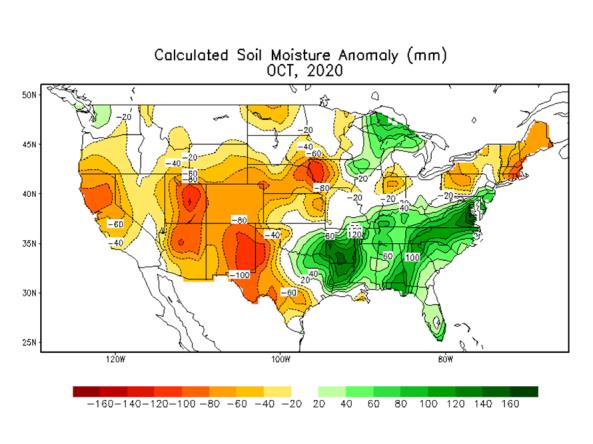
Soil Moisture Anomaly
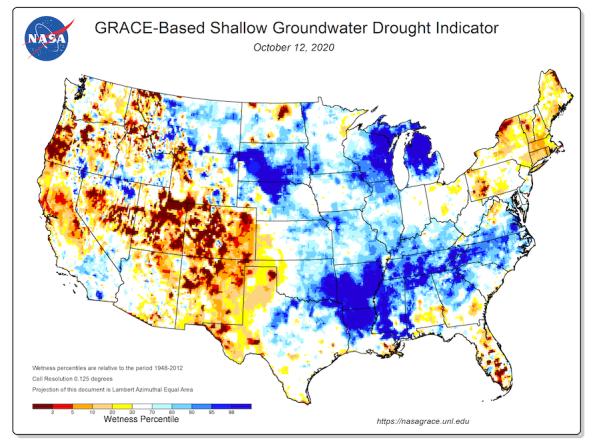
Root Zone Soil Moisture: Wetness Percentile
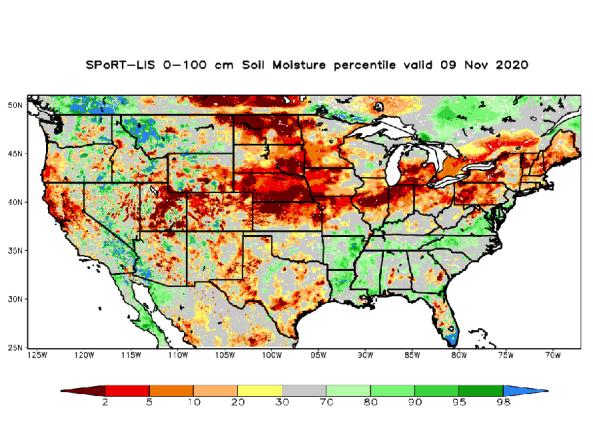
An accurate depiction of soil moisture conditions can provide valuable insights for agricultural monitoring, weather prediction, and drought and flood early warning.
This map shows the moisture content of the top 1 meter of soil compared to historical conditions from 1981–2013, based on NASA's Short-term Prediction and Transition Center – Land Information System (SPoRT-LIS).
Red and orange hues indicate drier soils, while greens and blues indicate greater soil moisture.
An accurate depiction of soil moisture conditions can provide valuable insights for agricultural monitoring, weather prediction, and drought and flood early warning.
This map shows the moisture content of the top 1 meter of soil, according to NASA's Crop Condition and Soil Moisture Analytics tool (Crop-CASMA). It relies on remotely sensed soil moisture data derived from NASA missions.
Soil moisture is shown as a deviation from average soil moisture conditions from 2015–present. Brown hues indicate below-average soil moisture, and blue hues indicate above-average soil moisture.
The GRACE-Based Root Zone Soil Moisture Drought Indicator describes the current wet or dry conditions of the top 1 meter of soil, expressed as a percentile showing the probability of occurrence within the period of record from 1948 to 2014. This product is based on terrestrial water storage observations derived from NASA GRACE satellite data and integrated with other observations, using a sophisticated numerical model of land surface water and energy processes.
Red and orange hues indicate drier soil moisture conditions, while blue hues indicate wetter conditions.
This map updates daily with data from NASA's Short-term Prediction and Transition Center – Land Information System (SPoRT-LIS).
Data are updated daily, with a 3-day delay.
Data from NASA GRACE are updated weekly on Mondays, and this Drought.gov map is updated every Tuesday.
Soil moisture plays an important role in drought and flood forecasting, agricultural monitoring, forest fire prediction, water supply management, and other natural resource activities. Soil moisture observations can forewarn of impending drought or flood conditions before other more standard indicators are triggered.
Learn MoreFlash drought is the rapid onset or intensification of drought. Unlike slow-evolving drought, which is caused by a decline in precipitation, flash drought occurs when low precipitation is accompanied by abnormally high temperatures, high winds, and/or changes in radiation. These sometimes-rapid changes can quickly raise evapotranspiration rates and remove available water from the landscape.
Learn MoreDrought can reduce the water availability and water quality necessary for productive farms, ranches, and grazing lands, resulting in significant negative direct and indirect economic impacts to the agricultural sector. Monitoring agricultural drought typically focuses on examining levels of precipitation, evaporative demand, soil moisture, and surface/groundwater quantity and quality.
Learn MoreDrought can result in reduced growth rates, increased stress on vegetation, and alterations or transformations to the plant community and/or the entire ecosystem. During periods of drought, plants increase their demand for water through increased evapotranspiration and longer growing seasons.
Learn MoreSoil moisture plays an important role in drought and flood forecasting, agricultural monitoring, forest fire prediction, water supply management, and other natural resource activities. Soil moisture observations can forewarn of impending drought or flood conditions before other more standard indicators are triggered.
Learn MoreSoil moisture plays an important role in drought and flood forecasting, agricultural monitoring, forest fire prediction, water supply management, and other natural resource activities. Soil moisture observations can forewarn of impending drought or flood conditions before other more standard indicators are triggered.
Learn MoreFlash drought is the rapid onset or intensification of drought. Unlike slow-evolving drought, which is caused by a decline in precipitation, flash drought occurs when low precipitation is accompanied by abnormally high temperatures, high winds, and/or changes in radiation. These sometimes-rapid changes can quickly raise evapotranspiration rates and remove available water from the landscape.
Learn MoreDrought can reduce the water availability and water quality necessary for productive farms, ranches, and grazing lands, resulting in significant negative direct and indirect economic impacts to the agricultural sector. Monitoring agricultural drought typically focuses on examining levels of precipitation, evaporative demand, soil moisture, and surface/groundwater quantity and quality.
Learn MoreDrought can result in reduced growth rates, increased stress on vegetation, and alterations or transformations to the plant community and/or the entire ecosystem. During periods of drought, plants increase their demand for water through increased evapotranspiration and longer growing seasons.
Learn MoreData and Map Gallery
Soil moisture data, maps, and tools vary by the source of their input data (e.g., in situ sensors, satellites, numerical models, or a blend of any of these), the depths they represent, and the metrics they display (e.g., volumetric water content, mm, changes and anomalies, daily ranking percentages). This supports a range of different end user applications.
Soil moisture conditions at the daily and monthly scales depicting total soil moisture, percentiles and anomalies, as well as monthly and seasonal change.
Groundwater and soil moisture drought indicators based on terrestrial water storage observations derived from GRACE satellite data and integrated with other observations, produced each week by NASA
NASA’s Short-term Prediction and Transition Center – Land Information System (SPoRT-LIS) provides high-resolution (about 3-km) gridded soil moisture products in real-time to support regional and lo
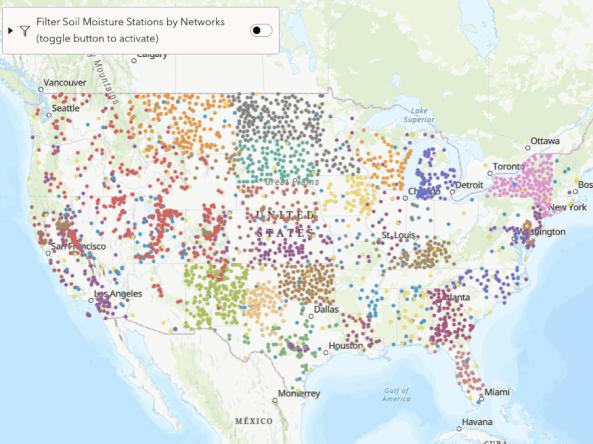
From 2018-2026, the research-based website NationalSoilMoisture.com provided high-resolution gridded soil moisture products derived from in situ soil moisture measurements, Natural Re
The Soil Climate Analysis Network (SCAN) provides soil and climate data to support natural resource assessments and conservation activities, focusing on agricultural areas of the U.S.
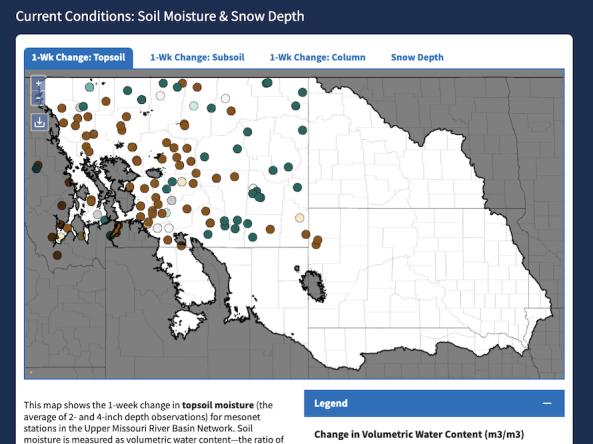
The Upper Missouri River Basin Soil Moisture and Snowpack Dashboard displays interactive maps of station-based soil moisture and snowpack data from the five state mesonets in the Upper Missou

Related Content
Soil Moisture Product Dashboard
This dashboard provides a series of root zone soil moisture maps side-by side to facilitate comparison and analysis.
Research & Learn | Flash Drought
In its simplest form, flash drought is generally considered the rapid onset of drought, which can cause extensive, unexpected damage to agriculture and economies. Changes in soil moisture can provide an early warning of flash drought.
Balancing the Water Budget: Advancements in Soil Moisture Monitoring and Interpretation
Soil moisture is a vital part of the Earth’s water budget, yet given the complexities in measuring and interpreting soil moisture, an accurate depiction of this variable has been a serious challenge over the past several decades. This means that important public needs, such as drought and flood early warning, water management, and agricultural monitoring, are not being fully addressed.
To address this situation, NIDIS is working with USDA and other partners to develop a strategy for a National Coordinated Soil Moisture Monitoring Network (NCSMMN). The goals of this initiative include:
- Establishing a national “network of networks” that effectively demonstrates data and operational coordination of in situ networks and addresses gaps in coverage
- Supporting R&D on innovative techniques to merge in situ soil moisture data with remotely-sensed and modeled hydrologic data to create near-real time, gridded, user-friendly soil moisture maps and associated tools
- Building a community of practice and expertise around soil moisture measurement and interpretation.

Soil Moisture Research and Resources
Web Resources
National Coordinated Soil Moisture Monitoring Network
Fact Sheet: National Coordinated Soil Moisture Monitoring Network
A Strategy for the National Coordinated Soil Moisture Monitoring Network
2023 National Soil Moisture Workshop: Agenda & Presentations
Soil Moisture Metadata Guidance
Soil Moisture Data Quality Guidance
Fact Sheet: NIDIS and Soil Moisture
Building a One-Stop Shop for Soil Moisture Information
The Paramount Societal Impact of Soil Moisture
UCAR Climate Guide: Soil Moisture Datasets Overview
USACE Upper Missouri River Basin Soil Moisture and Plains Snow Monitoring Build-Out
Upper Missouri River Basin (UMRB) Soil Moisture and Snowpack Maps Dashboard