U.S. flag

An official website of the United States government

The U.S. government is closed. This site will not be updated; however, NOAA websites and social media channels necessary to protect lives and property will be maintained. To learn more, visit commerce.gov.

For the latest forecasts and critical weather information, visit weather.gov.

National Weather Service Drought Information Statements

Dropdown Placeholder
Statement Label
Statement Date
Social Media Thumbnail
Example map showing National Weather Service drought information statements
Statements Data Panel
Drought Information Statements

Drought Information Statements
U.S. Drought Monitor

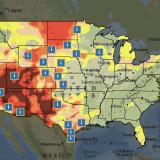
Select a Weather Forecast Office to view the latest drought information statement for that region—either as a PDF or a plain text version. Only Weather Forecast Offices with active statements published within the last 35 days are listed.

Page Summary

National Weather Service drought information statements provide up-to-date reports on the current drought situation for regional Weather Forecast Offices' county warning and forecast area. These timely statements summarize recent weather and hydrologic conditions, discuss local drought impacts, and provide a local drought outlook.

U.S. Affiliated Pacific Islands

Submitted by dustin.shackley on
Site Section
By Location | U.S. Territory
Resources Background Image
Tarzan Falls waterfall in Santa Rita, Guam.
Web Resources Label
Drought Resources for the U.S.-Affiliated Pacific Islands
Main Maps
U.S. Drought Monitor: U.S.-Affiliated Pacific Islands

Drought & Dryness Categories

Planning & Response
Drought in the U.S.-Affiliated Pacific Islands

The U.S.-Affiliated Pacific Islands (USAPI) include three U.S. territories—American Samoa, Guam, and the Commonwealth of the Northern Mariana Islands—and three independent countries—the Federated States of Micronesia, the Republic of the Marshall Islands, and the Republic of Palau. The geology of the USAPI varies greatly—from volcanic high islands, to low coral atolls. Native ecosystems, traditional agricultural systems, hydrology, and interactions with the ocean are remarkably diverse. Droughts occur regularly and are often associated with El Niño events, which are part of a natural climate cycle in the Pacific Ocean.

The USAPI is vulnerable to the compound effects of climate change, including warming, changing drought conditions, and sea level rise, which contributes to saline contamination of freshwater supplies. Low atoll islands, where water supplies are limited to rainwater catchments, are particularly vulnerable to drought periods since water storage is often insufficient to sustain the local population. Drought in the USAPI can prompt Federal disaster declarations where residents are subject to mandatory water restrictions, and emergency deliveries of food, bottled water, and reverse osmosis pumps are required. Other impacts of drought include increased wildfire risk, negative public health and tourism impacts, loss of cultural practices, and reduced crop yields. Understanding the impacts of drought in the USAPI, summarizing the current state of the science, and improving resilience are important for successful adaptation and management.

NIDIS supports eight regional Drought Early Warning Systems (DEWS) throughout the United States. In addition, NIDIS supports states and territories outside these regions, like the USAPI, by delivering drought early warning information through Drought.gov; investing in drought research to address key scientific and societal needs; and supporting the development of new tools and products that serve the entire nation.

U.S. Virgin Islands

Submitted by dustin.shackley on
Site Section
By Location | U.S. Territory
Resources Background Image
A palm tree grove at St. Croix, U.S. Virgin Islands.
Web Resources Label
Drought Resources for the U.S. Virgin Islands
Resources Section

Stay Informed: Local Drought Updates

Regional Drought Status Updates
NIDIS & its partners issue regional updates covering drought conditions, outlooks/forecasts, and local impacts.

Puerto Rico & U.S. Virgin Islands Drought Email List
Get regional drought status updates right to your inbox, as well as drought news, webinars, and other events for Puerto Rico and the U.S. Virgin Islands.

Get Involved: Submit Local Drought Impacts

Drought in your area? Tell us how drought is impacting your community by submitting a condition monitoring report. Your submissions help us better understand how drought is affecting local conditions.

State Bridge
Current Conditions

U.S. Virgin Islands Current Conditions

A number of physical indicators are important for monitoring drought, such as precipitation & temperature, water supply (e.g., groundwater), and soil moisture. Learn more about monitoring drought.

Vegetation Health Index: U.S. Virgin Islands

Unfavorable Conditions
48
Favorable Conditions
100

Recent Precipitation: U.S. Virgin Islands

Inches of Precipitation

Future Conditions

Outlooks & Forecasts for the U.S. Virgin Islands

Predicting drought in the U.S. Virgin Islands depends on the ability to forecast precipitation and temperature within the context of complex climate interactions. View more outlooks & forecasts.

Monthly Drought Outlook

Drought Is Predicted To...

Seasonal (3-Month) Drought Outlook

Drought Is Predicted To...

Main Maps
U.S. Drought Monitor: U.S. Virgin Islands

Drought & Dryness Categories

Planning & Response
Drought in the U.S. Virgin Islands

The United States Virgin Islands (USVI) is a small territory to the east of Puerto Rico that consists of three main islands—St Thomas, St Croix, and St John—and a few smaller, mostly unpopulated islands. Due to its geographical location in the center of the Caribbean, the USVI has two distinct seasons—the hurricane (wet) season from August to November and the dry season for the remainder of the year. Typically, about 40% of the annual rainfall occurs in the 3 wettest months, from September to November. Typical of many tropical islands, easternmost and leeward areas have the greatest aridity and sometimes feature vegetation (e.g., cacti) and landscapes (e.g., lack of trees) more typical of tropical dry forest and grasslands than a tropical rainforest.

Impacts from drought can be consequential since there are no significant sources of surface water (e.g., perennial rivers) and minimal groundwater due to the high relief of the islands. Most of the population draws their water from cisterns that collect rooftop water, and the rest are dependent on groundwater. Many must purchase water purified by reverse osmosis when there are no other sources. Drought also parches pastures and dries up ponds, which directly harms food and livestock production across the islands. With temperatures continuing to rise incrementally, future droughts should increase in number and be more impactful, with greater impacts on agriculture, water sources and community water collection in the territory.

NIDIS supports eight regional Drought Early Warning Systems (DEWS) throughout the United States. In addition, NIDIS supports states and territories outside these regions, like the U.S. Virgin Islands, by delivering drought early warning information through Drought.gov; investing in drought research to address key scientific and societal needs; and supporting the development of new tools and products that serve the entire nation. 

Wyoming

Submitted by maddy.sherer on
Site Section
By Location | States
Resources Background Image
A river runs through Grand Canyon of the Yellowstone in Wyoming.
Web Resources Label
Drought Resources for Wyoming
Resources Section

Stay Informed: Local Drought Updates

Drought Alert Emails
Get email updates when U.S. Drought Monitor conditions change for your location or a new drought outlook is released.

Regional Drought Status Updates
NIDIS & its partners issue regional updates covering drought conditions, outlooks/forecasts, and local impacts.

Missouri River Basin Drought Email List
Get regional drought status updates right to your inbox, as well as drought news, webinars, and other events for the Missouri River Basin.

Intermountain West Drought Email List
Get regional drought status updates right to your inbox, as well as drought news, webinars, and other events for the Intermountain West.

North Central U.S. Climate and Drought Summary and Outlook Webinars
This webinar series, which covers the region from the Rockies to the Great Lakes, includes a summary of past and current conditions, potential and ongoing impacts across sectors (e.g., agriculture, water resources, navigation), and outlook information.

Intermountain West Drought & Climate Outlook Webinars
These webinars provide the region with timely information on current and developing climate conditions such as drought, floods, and tropical storms, as well as climatic events like El Niño and La Niña.

Get Involved: Submit Local Drought Impacts

Drought in your area? Tell us how drought is impacting your community by submitting a condition monitoring report. Your submissions help us better understand how drought is affecting local conditions.

D3 Graph

U.S. Drought Monitor

The U.S. Drought Monitor (2000–present) depicts the location and intensity of drought across the country. Every Thursday, authors from NOAA, USDA, and the National Drought Mitigation Center produce a new map based on their assessments of the best available data and input from local observers. The map uses five categories: Abnormally Dry (D0), showing areas that may be going into or are coming out of drought, and four levels of drought (D1–D4). Learn more.

State Bridge
Statistics
~150,800

Wyoming residents in areas of drought, according to the Drought Monitor

Increase of
0.1%
since last week
55th

driest August on record (since 1895)

0.9 in.
total precipitation
Decrease of
0.17 in.
from normal
41st

driest January—August on record (since 1895)

10.77 in.
total precipitation
Decrease of
0.69 in.
from normal
Current Conditions

Wyoming Current Conditions

A number of physical indicators are important for monitoring drought, such as precipitation & temperature, water supply (e.g., streamflow, reservoirs), and soil moisture. Learn more about monitoring drought.

Wyoming Precipitation Conditions

Inches of Precipitation
Precipitation Shown as a Percentage of Normal Conditions
100%
Precipitation Shown as a Percentage of Normal Conditions
100%

Wyoming Temperature Conditions

Maximum Temperature (°F)
60
Departure from Normal Max Temperature (°F)
0
Departure from Normal Max Temperature (°F)
0

Wyoming Streamflow Conditions

Streamflow Conditions

Wyoming Soil Moisture Conditions

0–100 cm Soil Moisture Percentile
70
100
Soil Moisture Anomaly
0%

Future Conditions

Outlooks & Forecasts for Wyoming

Predicting drought in Wyoming depends on the ability to forecast precipitation and temperature within the context of complex climate interactions. View more outlooks & forecasts.

Future Precipitation & Temperature Conditions

Predicted Inches of Precipitation
1.75
Probability of Below-Normal Precipitation
100%
Probability of Above-Normal Precipitation
100%
Probability of Below-Normal Temperatures
100%
Probability of Above-Normal Temperatures
100%

Drought Outlooks for Wyoming

Drought Is Predicted To...

Main Maps
Current Wyoming Drought Maps

Drought & Dryness Categories
% of WY
22.2
13.9
16.3
7.7
0.0
37.9
Drought Change Since Last Week
Dry Conditions
Wet Conditions
Dry Conditions
Wet Conditions

Experimental
Experimental
Planning & Response
Drought in the Missouri River Basin

In Wyoming and across the Missouri River Basin (MRB), drought is a common climate event. Prolonged droughts in the 1930s and 1950s substantially affected water supplies, agriculture, energy, transportation of goods, and ecosystems. More recently, short-duration droughts wreaked havoc on the MRB. The intense 2012 summertime drought surprised the region, as flooding was expected to continue into a second year following the devastating floods of 2011. Flash drought in the U.S. Northern Plains and Canadian Prairies in 2017 resulted in $2.6 billion of agricultural losses alone. In 2020–2021, drought affected the same area and was a multi-billion-dollar event that had wide-reaching impacts on the region’s communities, ecosystems, water resources, and agricultural systems.

Partly in response to the floods of 2011 and then the extreme and rapidly evolving drought in 2012, NOAA’s National Integrated Drought Information System (NIDIS) launched the Missouri River Basin Drought Early Warning System (DEWS) in 2014. The Missouri River Basin DEWS is a network of regional and national partners that share information and coordinate actions to help communities in the region cope with drought. Wyoming is also part of the Intermountain West DEWS.

Reach out to Jason Gerlich, the Regional Drought Coordinator for the Missouri River Basin region, for more information, or sign up for the Missouri River Basin or Intermountain West DEWS newsletters.

Drought Resources

Wyoming State Drought Resources

Graphs Header

Historical Drought Conditions in Wyoming

Drought is a normal climate pattern that has occurred in varying degrees of length, severity, and size throughout history. Below, you can look back at past drought conditions for Wyoming according to 3 historical drought indices. The U.S. Drought Monitor is a weekly map that shows the location and intensity of drought across the country since 2000. The Standardized Precipitation Index (SPI) is a monthly depiction of drought based on precipitation. And the paleoclimate data uses tree-ring reconstructions to estimate drought conditions before we had widespread instrumental records. View more historical conditions.

West Virginia

Submitted by maddy.sherer on
Site Section
By Location | States
Resources Background Image
Blackwater Falls in West Virginia, surrounded by trees.
Web Resources Label
Drought Resources for West Virginia
Resources Section

Stay Informed: Local Drought Updates

Drought Alert Emails
Get email updates when U.S. Drought Monitor conditions change for your location or a new drought outlook is released.

Dry Times Bi-Weekly Drought Newsletter
Issued every other Thursday, Dry Times is an email newsletter with the latest drought news, events, and data & maps.

NOAA Eastern Region Climate Services Webinars
The Northeast Regional Climate Center hosts a monthly webinar with NOAA affiliates to address timely weather and climate concerns.

Get Involved: Submit Local Drought Impacts

Drought in your area? Tell us how drought is impacting your community by submitting a condition monitoring report. Your submissions help us better understand how drought is affecting local conditions.

D3 Graph

U.S. Drought Monitor

The U.S. Drought Monitor (2000–present) depicts the location and intensity of drought across the country. Every Thursday, authors from NOAA, USDA, and the National Drought Mitigation Center produce a new map based on their assessments of the best available data and input from local observers. The map uses five categories: Abnormally Dry (D0), showing areas that may be going into or are coming out of drought, and four levels of drought (D1–D4). Learn more.

State Bridge
Statistics
1.1 Million

West Virginia residents in areas of drought, according to the Drought Monitor

Decrease of
0.2%
since last week
2nd

driest August on record (since 1895)

1.72 in.
total precipitation
Decrease of
2.46 in.
from normal
45th

wettest January—August on record (since 1895)

33.88 in.
total precipitation
Increase of
1.89 in.
from normal
Current Conditions

West Virginia Current Conditions

A number of physical indicators are important for monitoring drought, such as precipitation & temperature, water supply (e.g., streamflow, reservoirs), and soil moisture. Learn more about monitoring drought.

West Virginia Precipitation Conditions

Inches of Precipitation
Precipitation Shown as a Percentage of Normal Conditions
100%
Precipitation Shown as a Percentage of Normal Conditions
100%

West Virginia Temperature Conditions

Maximum Temperature (°F)
60
Departure from Normal Max Temperature (°F)
0
Departure from Normal Max Temperature (°F)
0

West Virginia Streamflow Conditions

Streamflow Conditions

West Virginia Soil Moisture Conditions

0–100 cm Soil Moisture Percentile
70
100
Crop Moisture Index

Future Conditions

Outlooks & Forecasts for West Virginia

Predicting drought in West Virginia depends on the ability to forecast precipitation and temperature within the context of complex climate interactions. View more outlooks & forecasts.

Future Precipitation & Temperature Conditions

Predicted Inches of Precipitation
1.75
Probability of Below-Normal Precipitation
100%
Probability of Above-Normal Precipitation
100%
Probability of Below-Normal Temperatures
100%
Probability of Above-Normal Temperatures
100%

Drought Outlooks for West Virginia

Drought Is Predicted To...

Main Maps
Current West Virginia Drought Maps

Drought & Dryness Categories
% of WV
23.1
22.9
36.8
5.7
0.0
65.4
Drought Change Since Last Week
Dry Conditions
Wet Conditions
Dry Conditions
Wet Conditions

Experimental
Experimental
Planning & Response
Drought in West Virginia

West Virginia is a geographically small state, yet expands approximately 225 miles north–south and 250 miles east–west due to the uniqueness of having two "panhandles." The Central Appalachian Mountains run through the eastern portions of the state, creating a disparity in precipitation—over 60 inches of precipitation falls annually on the western side while just a little over 30 inches falls annually on the eastern side. The variation of geography and topography causes precipitation to fluctuate significantly across the state, including periods of drought.

Since 1900, West Virginia has experienced several noteworthy droughts, including 1904, 1930–31, 1941, 1954, 1966, and 1988. During the drought of 1930–31, nearly 100% of the state experienced what currently would be referred to as D4, or “exceptional drought,” for 8 months. More recently, widespread exceptional drought occurred during the summer of 1988, accompanied by a heatwave. During the 2000s, increased precipitation amounts have reduced the severity of drought periods in the state. In fact, 5 of the top 10 wettest years on record have occurred since 2000. However, intermittent drought conditions can and still occur between periods of extreme precipitation.

NIDIS supports eight regional Drought Early Warning Systems (DEWS) throughout the United States. In addition, NIDIS supports states outside these regions, like West Virginia, by delivering drought early warning information through Drought.gov; investing in drought research to address key scientific and societal needs; and supporting the development of new tools and products that serve the entire nation.

Graphs Header

Historical Drought Conditions in West Virginia

Drought is a normal climate pattern that has occurred in varying degrees of length, severity, and size throughout history. Below, you can look back at past drought conditions for West Virginia according to 3 historical drought indices. The U.S. Drought Monitor is a weekly map that shows the location and intensity of drought across the country since 2000. The Standardized Precipitation Index (SPI) is a monthly depiction of drought based on precipitation (with data going back to 1895). And the paleoclimate data uses tree-ring reconstructions to estimate drought conditions before we had widespread instrumental records, going back to the year 0 for some parts of the U.S. View more historical conditions.

Wisconsin

Submitted by maddy.sherer on
Site Section
By Location | States
Resources Background Image
Aerial view from a hiking trail in Devil's Lake State Park, Wisconsin.
Web Resources Label
Drought Resources for Wisconsin
Resources Section

Stay Informed: Local Drought Updates

Drought Alert Emails
Get email updates when U.S. Drought Monitor conditions change for your location or a new drought outlook is released.

Regional Drought Status Updates
NIDIS & its partners issue regional updates covering drought conditions, outlooks/forecasts, and local impacts.

Midwest Drought Email List
Get regional drought status updates right to your inbox, as well as drought news, webinars, and other events for the Midwest.

North Central U.S. Climate and Drought Summary and Outlook Webinars
This webinar series, which covers the region from the Rockies to the Great Lakes, includes a summary of past and current conditions, potential and ongoing impacts across sectors (e.g., agriculture, water resources, navigation), and outlook information.

Get Involved: Submit Local Drought Impacts

Drought in your area? Tell us how drought is impacting your community by submitting a condition monitoring report. Your submissions help us better understand how drought is affecting local conditions.

D3 Graph

U.S. Drought Monitor

The U.S. Drought Monitor (2000–present) depicts the location and intensity of drought across the country. Every Thursday, authors from NOAA, USDA, and the National Drought Mitigation Center produce a new map based on their assessments of the best available data and input from local observers. The map uses five categories: Abnormally Dry (D0), showing areas that may be going into or are coming out of drought, and four levels of drought (D1–D4). Learn more.

State Bridge
Statistics
~378,300

Wisconsin residents in areas of drought, according to the Drought Monitor

Increase of
11.0%
since last week
63rd

driest August on record (since 1895)

3.71 in.
total precipitation
Decrease of
0.07 in.
from normal
35th

wettest January—August on record (since 1895)

24.22 in.
total precipitation
Increase of
2.33 in.
from normal
Current Conditions

Wisconsin Current Conditions

A number of physical indicators are important for monitoring drought, such as precipitation & temperature, water supply (e.g., streamflow, reservoirs), and soil moisture. Learn more about monitoring drought.

Wisconsin Precipitation Conditions

Inches of Precipitation
Precipitation Shown as a Percentage of Normal Conditions
100%
Precipitation Shown as a Percentage of Normal Conditions
100%

Wisconsin Temperature Conditions

Maximum Temperature (°F)
60
Departure from Normal Max Temperature (°F)
0
Departure from Normal Max Temperature (°F)
0

Wisconsin Streamflow Conditions

Streamflow Conditions

Wisconsin Soil Moisture Conditions

0–100 cm Soil Moisture Percentile
70
100
Soil Moisture Anomaly
0%

Future Conditions

Outlooks & Forecasts for Wisconsin

Predicting drought in Wisconsin depends on the ability to forecast precipitation and temperature within the context of complex climate interactions. View more outlooks & forecasts.

Future Precipitation & Temperature Conditions

Predicted Inches of Precipitation
1.75
Probability of Below-Normal Precipitation
100%
Probability of Above-Normal Precipitation
100%
Probability of Below-Normal Temperatures
100%
Probability of Above-Normal Temperatures
100%

Drought Outlooks for Wisconsin

Drought Is Predicted To...

Main Maps
Current Wisconsin Drought Maps

Drought & Dryness Categories
% of WI
57.8
12.2
0.5
0.0
0.0
12.6
Drought Change Since Last Week
Dry Conditions
Wet Conditions
Dry Conditions
Wet Conditions

Experimental
Experimental
Planning & Response
Drought in the Midwest

Drought and its impacts vary from region to region—due to differences in climate. Precipitation extremes in the Midwest have a major impact on the region’s resources, economic sectors, and residents. Over the last century, precipitation trends in the Midwest have been moving towards wetter conditions and fewer droughts than the region experienced in the early 20th century. However, the Midwest has still felt adverse impacts during recent droughts, particularly in 1988 and 2012. These adverse impacts include limited barge transportation on major rivers, decreased agricultural production, challenges for municipal water supply and quality, and reduced productivity for hydropower. In 2022 and 2023, drought conditions across portions of the Mississippi River Basin caused river levels to drastically lower, which had a significant impact on the transportation of goods along the river.

An added challenge in recent years has been the tendency to transition from drought to flood and back to drought within short time spans, sometimes within a matter of months, as well as flash drought, which is a drought that intensifies rapidly.

NOAA’s National Integrated Drought Information System (NIDIS) launched the Midwest Drought Early Warning System (DEWS) in response to the 2012 drought, which highlighted the need for additional drought early warning and preparedness in the region. The Midwest DEWS is a network of regional and national partners that share information and coordinate actions to help communities in the region cope with drought. 

Reach out to Molly Woloszyn, the Regional Drought Coordinator for this region, for more information, or sign up for the Midwest DEWS newsletter.

Graphs Header

Historical Drought Conditions in Wisconsin

Drought is a normal climate pattern that has occurred in varying degrees of length, severity, and size throughout history. Below, you can look back at past drought conditions for Wisconsin according to 3 historical drought indices. The U.S. Drought Monitor is a weekly map that shows the location and intensity of drought across the country since 2000. The Standardized Precipitation Index (SPI) is a monthly depiction of drought based on precipitation (with data going back to 1895). And the paleoclimate data uses tree-ring reconstructions to estimate drought conditions before we had widespread instrumental records, going back to the year 0 for some parts of the U.S. View more historical conditions.

Washington

Submitted by maddy.sherer on
Site Section
By Location | States
Resources Background Image
Trees and colorful plants in front of mountains in Mt Rainier National Park, Washington.
Web Resources Label
Drought Resources for Washington
Resources Section

Stay Informed: Local Drought Updates

Drought Alert Emails
Get email updates when U.S. Drought Monitor conditions change for your location or a new drought outlook is released.

Regional Drought Status Updates
NIDIS & its partners issue regional updates covering drought conditions, outlooks/forecasts, and local impacts.

Pacific Northwest Drought Email List
Get regional drought status updates right to your inbox, as well as drought news, webinars, and other events for the Pacific Northwest.

Pacific Northwest DEWS Drought & Climate Outlook Webinars
These webinars provide the region with timely information on current and developing drought conditions, as well as climatic events like El Niño and La Niña.

Get Involved: Submit Local Drought Impacts

Drought in your area? Tell us how drought is impacting your community by submitting a condition monitoring report. Your submissions help us better understand how drought is affecting local conditions.

D3 Graph

U.S. Drought Monitor

The U.S. Drought Monitor (2000–present) depicts the location and intensity of drought across the country. Every Thursday, authors from NOAA, USDA, and the National Drought Mitigation Center produce a new map based on their assessments of the best available data and input from local observers. The map uses five categories: Abnormally Dry (D0), showing areas that may be going into or are coming out of drought, and four levels of drought (D1–D4). Learn more.

State Bridge
Statistics
6.6 Million

Washington residents in areas of drought, according to the Drought Monitor

Decrease of
0.6%
since last week
45th

wettest August on record (since 1895)

1.17 in.
total precipitation
Increase of
0.15 in.
from normal
7th

driest January—August on record (since 1895)

17.61 in.
total precipitation
Decrease of
6.22 in.
from normal
Current Conditions

Washington Current Conditions

A number of physical indicators are important for monitoring drought, such as precipitation & temperature, water supply (e.g., streamflow, reservoirs), and soil moisture. Learn more about monitoring drought.

Washington Precipitation Conditions

Inches of Precipitation
Precipitation Shown as a Percentage of Normal Conditions
100%
Precipitation Shown as a Percentage of Normal Conditions
100%

Washington Temperature Conditions

Maximum Temperature (°F)
60
Departure from Normal Max Temperature (°F)
0
Departure from Normal Max Temperature (°F)
0

Washington Streamflow Conditions

Streamflow Conditions

Washington Soil Moisture Conditions

0–100 cm Soil Moisture Percentile
70
100
Soil Moisture Anomaly
0%

Future Conditions

Outlooks & Forecasts for Washington

Predicting drought in Washington depends on the ability to forecast precipitation and temperature within the context of complex climate interactions. View more outlooks & forecasts.

Future Precipitation & Temperature Conditions

Predicted Inches of Precipitation
1.75
Probability of Below-Normal Precipitation
100%
Probability of Above-Normal Precipitation
100%
Probability of Below-Normal Temperatures
100%
Probability of Above-Normal Temperatures
100%

Drought Outlooks for Washington

Drought Is Predicted To...

Main Maps
Current Washington Drought Maps

Drought & Dryness Categories
% of WA
5.2
29.8
51.0
14.0
0.0
94.8
Drought Change Since Last Week
Dry Conditions
Wet Conditions
Dry Conditions
Wet Conditions

Experimental
Experimental
Planning & Response
Drought in Washington

Washington State bases its drought determinations on a drought definition found in state law. The definition is water supply-focused and includes both a hydrometeorological and impact threshold. An area is considered to be in drought when the water supply for that geographic area, or for a significant portion of that geographic area, is below or projected to be below 75% of normal and the water shortage is likely to create undue hardships for water users or the environment. Normal water supply is defined as the median amount of water available for the most recent official climate period (currently 1991–2020).   

Snowpack is critical to Washington’s water supply. Approximately three-quarters of the runoff from the Cascades originates as snowpack. (How much runoff originates as snow?) This snowpack acts as a natural reservoir, and a weak snowpack or a shift in the timing of snowmelt can impact water supply in the spring and summer. Some lower-elevation basins are more rain-dominant, and spring precipitation is important for filling up soil moisture before the summer dry period develops. Annual precipitation varies drastically across the state, with coastal Washington receiving over 80 inches of precipitation, on average, and parts of the Lower Columbia Basin east of the Cascade Mountains receiving less than 10 inches. When making drought determinations, the state Water Supply Availability Committee considers forecasted conditions in addition to existing conditions. Streamflow forecasts from both the National Weather Service and the Natural Resources Conservation Service are primary factors, but other hydrometeorological variables are considered as well.  

In response to drought in the region, NOAA’s National Integrated Drought Information System (NIDIS) launched the Pacific Northwest Drought Early Warning System (DEWS) in 2016, encompassing Washington, Idaho, Oregon, and western Montana. The Pacific Northwest DEWS is a network of regional and national partners that share information and coordinate actions to help communities in the region cope with drought.

Reach out to Jason Gerlich, the Regional Drought Coordinator for this region, for more information, or sign up for the Pacific Northwest DEWS newsletter.

Drought Resources

Washington State Drought Resources

Graphs Header

Historical Drought Conditions in Washington

Drought is a normal climate pattern that has occurred in varying degrees of length, severity, and size throughout history. Below, you can look back at past drought conditions for Washington according to 3 historical drought indices. The U.S. Drought Monitor is a weekly map that shows the location and intensity of drought across the country since 2000. The Standardized Precipitation Index (SPI) is a monthly depiction of drought based on precipitation (with data going back to 1895). And the paleoclimate data uses tree-ring reconstructions to estimate drought conditions before we had widespread instrumental records, going back to the year 0 for some parts of the U.S. View more historical conditions.

Vermont

Submitted by maddy.sherer on
Site Section
By Location | States
Resources Background Image
Fall foliage along the Nulhegan River in northeastern Vermont.
Web Resources Label
Drought Resources for Vermont
Resources Section

Stay Informed: Local Drought Updates

Drought Alert Emails
Get email updates when U.S. Drought Monitor conditions change for your location or a new drought outlook is released.

Northeast Drought Status Updates
NIDIS & its partners issue regional updates covering drought conditions, outlooks/forecasts, and local impacts.

Northeast Drought Email List
Get regional drought status updates right to your inbox, as well as drought news, webinars, and other events for the Northeast.

NOAA Eastern Region Climate Services Webinars
The Northeast Regional Climate Center hosts a monthly webinar with NOAA affiliates to address timely weather and climate concerns.

Get Involved: Submit Local Drought Impacts

Drought in your area? Tell us how drought is impacting your community by submitting a condition monitoring report. Your submissions help us better understand how drought is affecting local conditions.

D3 Graph

U.S. Drought Monitor

The U.S. Drought Monitor (2000–present) depicts the location and intensity of drought across the country. Every Thursday, authors from NOAA, USDA, and the National Drought Mitigation Center produce a new map based on their assessments of the best available data and input from local observers. The map uses five categories: Abnormally Dry (D0), showing areas that may be going into or are coming out of drought, and four levels of drought (D1–D4). Learn more.

State Bridge
Statistics
~625,700

Vermont residents in areas of drought, according to the Drought Monitor

Change of
0.0%
since last week
1st

driest August on record (since 1895)

1.43 in.
total precipitation
Decrease of
2.56 in.
from normal
62nd

driest January—August on record (since 1895)

27.32 in.
total precipitation
Decrease of
0.24 in.
from normal
Current Conditions

Vermont Current Conditions

A number of physical indicators are important for monitoring drought, such as precipitation & temperature, water supply (e.g., streamflow, reservoirs), and soil moisture. Learn more about monitoring drought.

Vermont Precipitation Conditions

Inches of Precipitation
Precipitation Shown as a Percentage of Normal Conditions
100%
Precipitation Shown as a Percentage of Normal Conditions
100%

Vermont Temperature Conditions

Maximum Temperature (°F)
60
Departure from Normal Max Temperature (°F)
0
Departure from Normal Max Temperature (°F)
0

Vermont Streamflow Conditions

Streamflow Conditions

Vermont Soil Moisture Conditions

0–100 cm Soil Moisture Percentile
70
100
Soil Moisture Anomaly
0%

Future Conditions

Outlooks & Forecasts for Vermont

Predicting drought in Vermont depends on the ability to forecast precipitation and temperature within the context of complex climate interactions. View more outlooks & forecasts.

Future Precipitation & Temperature Conditions

Predicted Inches of Precipitation
1.75
Probability of Below-Normal Precipitation
100%
Probability of Above-Normal Precipitation
100%
Probability of Below-Normal Temperatures
100%
Probability of Above-Normal Temperatures
100%

Drought Outlooks for Vermont

Drought Is Predicted To...

Main Maps
Current Vermont Drought Maps

Drought & Dryness Categories
% of VT
0.0
12.0
41.1
46.9
0.0
100.0
Drought Change Since Last Week
Dry Conditions
Wet Conditions
Dry Conditions
Wet Conditions

Experimental
Experimental
Planning & Response
Drought in the Northeast

Known best for its autumn foliage, thick forests, rocky soils, and abundant freshwater resources, the northeastern United States is characterized by a diverse climate that is not often associated with drought. However, in 2000, 2016, 2020, and 2022, New York and New England experienced historic drought conditions not seen since the 1960s.

The Northeast also frequently experiences “flash” droughts—the rapid onset of intense dry periods that can follow a period of normal to above-normal precipitation. While these flash droughts may last only 2–6 months, they can have profound impacts in the region, resulting in agricultural losses, shortages in public water supplies, and very low streamflows.

NOAA’s National Integrated Drought Information System (NIDIS) launched the Northeast Drought Early Warning System (DEWS) to improve drought early warning capacity and build long-term drought resilience throughout New England and New York. The Northeast DEWS is a network of regional and national partners that share information and coordinate actions to help communities in the region cope with drought.

Reach out to Sylvia Reeves (NIDIS Regional Drought Coordinator for this region) or Dr. Lesley-Ann L. Dupigny-Giroux (Vermont State Climatologist) for more information, or sign up for the Northeast DEWS newsletter.

Drought Resources

Vermont State Drought Resources

Graphs Header

Historical Drought Conditions in Vermont

Drought is a normal climate pattern that has occurred in varying degrees of length, severity, and size throughout history. Below, you can look back at past drought conditions for Vermont according to 3 historical drought indices. The U.S. Drought Monitor is a weekly map that shows the location and intensity of drought across the country since 2000. The Standardized Precipitation Index (SPI) is a monthly depiction of drought based on precipitation (with data going back to 1895). And the paleoclimate data uses tree-ring reconstructions to estimate drought conditions before we had widespread instrumental records, going back to the year 0 for some parts of the U.S. View more historical conditions.

Virginia

Submitted by maddy.sherer on
Site Section
By Location | States
Resources Background Image
View of rapids in the Potomac River at sunset, at Great Falls Park, Virginia.
Web Resources Label
Drought Resources for Virginia
Resources Section

Stay Informed: Local Drought Updates

Drought Alert Emails
Get email updates when U.S. Drought Monitor conditions change for your location or a new drought outlook is released.

Southeast DEWS Drought Email List
Get regional drought status updates right to your inbox, as well as drought news, webinars, and other events for the Southeast.

Southeast Climate Monthly Webinars
This webinar series provides the Southeast region with timely information on current and developing climate conditions, such as drought, floods, and tropical storms, as well as climatic events like El Niño and La Niña. 

Get Involved: Submit Local Drought Impacts

Drought in your area? Tell us how drought is impacting your community by submitting a condition monitoring report. Your submissions help us better understand how drought is affecting local conditions.

D3 Graph

U.S. Drought Monitor

The U.S. Drought Monitor (2000–present) depicts the location and intensity of drought across the country. Every Thursday, authors from NOAA, USDA, and the National Drought Mitigation Center produce a new map based on their assessments of the best available data and input from local observers. The map uses five categories: Abnormally Dry (D0), showing areas that may be going into or are coming out of drought, and four levels of drought (D1–D4). Learn more.

State Bridge
Statistics
4.1 Million

Virginia residents in areas of drought, according to the Drought Monitor

Increase of
0.1%
since last week
19th

driest August on record (since 1895)

2.62 in.
total precipitation
Decrease of
1.73 in.
from normal
25th

wettest January—August on record (since 1895)

34.16 in.
total precipitation
Increase of
3.95 in.
from normal
Current Conditions

Virginia Current Conditions

A number of physical indicators are important for monitoring drought, such as precipitation & temperature, water supply (e.g., streamflow, groundwater), and soil moisture. Learn more about monitoring drought.

Virginia Precipitation Conditions

Inches of Precipitation
Precipitation Shown as a Percentage of Normal Conditions
100%
Precipitation Shown as a Percentage of Normal Conditions
100%

Virginia Temperature Conditions

Maximum Temperature (°F)
60
Departure from Normal Max Temperature (°F)
0
Departure from Normal Max Temperature (°F)
0

Virginia Streamflow Conditions

Streamflow Conditions

Virginia Soil Moisture Conditions

0–100 cm Soil Moisture Percentile
70
100
Soil Moisture Anomaly
0%

Future Conditions

Outlooks & Forecasts for Virginia

Predicting drought in Virginia depends on the ability to forecast precipitation and temperature within the context of complex climate interactions. View more outlooks & forecasts.

Future Precipitation & Temperature Conditions

Predicted Inches of Precipitation
1.75
Probability of Below-Normal Precipitation
100%
Probability of Above-Normal Precipitation
100%
Probability of Below-Normal Temperatures
100%
Probability of Above-Normal Temperatures
100%

Drought Outlooks for Virginia

Drought Is Predicted To...

Main Maps
Current Virginia Drought Maps

Drought & Dryness Categories
% of VA
33.9
41.2
9.5
0.0
0.0
50.7
Drought Change Since Last Week
Dry Conditions
Wet Conditions
Dry Conditions
Wet Conditions

Experimental
Experimental
Planning & Response
Drought in Virginia

Drought conditions in Virginia are assessed by the Virginia Drought Management Task Force (VA DMTF), a collaboration of drought experts from various government agencies in Virginia and West Virginia, and organized by the Virginia Department of Environmental Quality (DEQ). Members of the VA DMTF meet on an as-needed basis when drought conditions are present or expected to develop across any portion of Virginia. They also submit their drought condition recommendations to the National Drought Mitigation Center for updates to the weekly U.S. Drought Monitor map. The VA DMTF evaluates variables including rainfall, streamflow, groundwater levels, regional climate, soil moisture, water storage in reservoirs, ecological conditions, municipal water restrictions, and the time of year. These conditions are closely monitored and can rapidly change, especially during the summer months, which bring about higher evaporation rates. Through this partnership, DEQ makes recommendations for Drought Stage declarations that help local watershed managers make vital water usage decisions.

Virginia generally receives over 40 inches of precipitation per year and is historically considered “water rich." However, droughts are not uncommon, and Virginia has a history of multi-year droughts, including the recently experienced record-breaking droughts of 1999–2002, 2007–2008, and 2010–2012. Virginia also experienced a high-impact drought during the late summer and fall of 2023 that was a primary factor in several major wildfires, including the Matts Creek Fire in the Jefferson National Forest. Fifteen Virginia localities also qualified for USDA emergency loans due to their severe (D2) to extreme (D3) drought designations. Droughts in Virginia and across the Southeast can have far-reaching impacts on agriculture, water availability, and wildfires. Drought conditions can also develop rapidly, especially when the lack of rain and high temperatures combine to quickly increase the loss of water from the landscape via evapotranspiration. There is increased regional awareness of how these rapid-onset droughts, sometimes referred to as "flash droughts," can cause significant agricultural economic impacts and supply concerns to other water users.

NOAA’s National Integrated Drought Information System (NIDIS) launched the Southeast Drought Early Warning System (DEWS) in 2020, which includes Alabama, Florida, Georgia, North Carolina, South Carolina, Tennessee, and Virginia. The Southeast DEWS is a network of regional and national partners that share information and coordinate actions to help communities in the region cope with drought.

Reach out to Elliot Wickham, the Regional Drought Coordinator for this region, for more information, or sign up for the Southeast DEWS newsletter.

Drought Resources

Virginia State Drought Resources

Graphs Header

Historical Drought Conditions in Virginia

Drought is a normal climate pattern that has occurred in varying degrees of length, severity, and size throughout history. Below, you can look back at past drought conditions for Virginia according to 3 historical drought indices. The U.S. Drought Monitor is a weekly map that shows the location and intensity of drought across the country since 2000. The Standardized Precipitation Index (SPI) is a monthly depiction of drought based on precipitation (with data going back to 1895). And the paleoclimate data uses tree-ring reconstructions to estimate drought conditions before we had widespread instrumental records, going back to the year 0 for some parts of the U.S. View more historical conditions.

Utah

Submitted by maddy.sherer on
Site Section
By Location | States
Resources Background Image
Rock formations in Zion National Park, Utah.
Web Resources Label
Drought Resources for Utah
Resources Section

Stay Informed: Local Drought Updates

Drought Alert Emails
Get email updates when U.S. Drought Monitor conditions change for your location or a new drought outlook is released.

Intermountain West Drought Status Updates
NIDIS & its partners issue regional updates covering drought conditions, outlooks/forecasts, and local impacts.

Intermountain West Drought Email List
Get regional drought status updates right to your inbox, as well as drought news, webinars, and other events for the Intermountain West.

Intermountain West Drought & Climate Outlook Webinars
These webinars provide the region with timely information on current and developing climate conditions such as drought, floods, and tropical storms, as well as climatic events like El Niño and La Niña.

Get Involved: Submit Local Drought Impacts

Drought in your area? Tell us how drought is impacting your community by submitting a condition monitoring report. Your submissions help us better understand how drought is affecting local conditions.

D3 Graph

U.S. Drought Monitor

The U.S. Drought Monitor (2000–present) depicts the location and intensity of drought across the country. Every Thursday, authors from NOAA, USDA, and the National Drought Mitigation Center produce a new map based on their assessments of the best available data and input from local observers. The map uses five categories: Abnormally Dry (D0), showing areas that may be going into or are coming out of drought, and four levels of drought (D1–D4). Learn more.

State Bridge
Statistics
1.6 Million

Utah residents in areas of drought, according to the Drought Monitor

Decrease of
0.2%
since last week
62nd

driest August on record (since 1895)

1.05 in.
total precipitation
Decrease of
0.16 in.
from normal
11th

driest January—August on record (since 1895)

6.0 in.
total precipitation
Decrease of
3.10 in.
from normal
Current Conditions

Utah Current Conditions

A number of physical indicators are important for monitoring drought, such as precipitation & temperature, water supply (e.g., streamflow, reservoirs), and soil moisture. Learn more about monitoring drought.

Utah Precipitation Conditions

Inches of Precipitation
Precipitation Shown as a Percentage of Normal Conditions
100%
Precipitation Shown as a Percentage of Normal Conditions
100%

Utah Temperature Conditions

Maximum Temperature (°F)
60
Departure from Normal Max Temperature (°F)
0
Departure from Normal Max Temperature (°F)
0

Utah Streamflow Conditions

Streamflow Conditions

Utah Soil Moisture Conditions

0–100 cm Soil Moisture Percentile
70
100
Soil Moisture Anomaly
0%

Future Conditions

Outlooks & Forecasts for Utah

Predicting drought in Utah depends on the ability to forecast precipitation and temperature within the context of complex climate interactions. View more outlooks & forecasts.

Future Precipitation & Temperature Conditions

Predicted Inches of Precipitation
1.75
Probability of Below-Normal Precipitation
100%
Probability of Above-Normal Precipitation
100%
Probability of Below-Normal Temperatures
100%
Probability of Above-Normal Temperatures
100%

Drought Outlooks for Utah

Drought Is Predicted To...

Main Maps
Current Utah Drought Maps

Drought & Dryness Categories
% of UT
5.8
48.6
41.5
4.1
0.0
94.2
Drought Change Since Last Week
Dry Conditions
Wet Conditions
Dry Conditions
Wet Conditions

Experimental
Experimental
Planning & Response
Drought in the Intermountain West

Drought and its impacts vary from region to region—due to differences in climate. In Colorado and across the Intermountain West region (Utah, Wyoming, Colorado, Arizona, and western New Mexico), drought onset may occur quickly and last a season, or begin gradually and last decades. The Rocky Mountain regions rely on winter snowpack to sustain cities, towns, agriculture and recreation. In the Southwest, the summer monsoons help people, and livestock, get through the hot summer months. 

The Colorado River is the largest perennial stream in the Intermountain West, feeding the two largest reservoirs in the United States. Winter snowpack in the Colorado Rockies usually sets the tone for drought conditions from year to year.

To help foster interstate coordination to cope with current and future droughts and growing water demands, NOAA’s National Integrated Drought Information System (NIDIS) launched the Intermountain West Drought Early Warning System (DEWS). The Intermountain West DEWS is a network of regional and national partners that share information and coordinate actions to help communities in the region cope with current and future droughts. 

Reach out to Meredith Muth, the Acting Regional Drought Coordinator for this region, for more information, or sign up for the Intermountain West DEWS newsletter.

Drought Resources

Utah State Drought Resources

Graphs Header

Historical Drought Conditions in Utah

Drought is a normal climate pattern that has occurred in varying degrees of length, severity, and size throughout history. Below, you can look back at past drought conditions for Utah according to 3 historical drought indices. The U.S. Drought Monitor is a weekly map that shows the location and intensity of drought across the country since 2000. The Standardized Precipitation Index (SPI) is a monthly depiction of drought based on precipitation (with data going back to 1895). And the paleoclimate data uses tree-ring reconstructions to estimate drought conditions before we had widespread instrumental records, going back to the year 0 for some parts of the U.S. View more historical conditions.

Subscribe to